Special notes of this burst
Image
Pre-slew 15.0-350.0 keV image (Event data)
#   RAcent    DECcent   POSerr    Theta     Phi              Peak Cts       SNR   Name
  350.9207    29.7631   0.0036    36.3844  -124.7862        18.0223877     53.209 TRIG_00348128

Foreground time interval of the image:
 -4.899 165.008 (delta_t = 169.907 [sec])
Background time interval of the image:
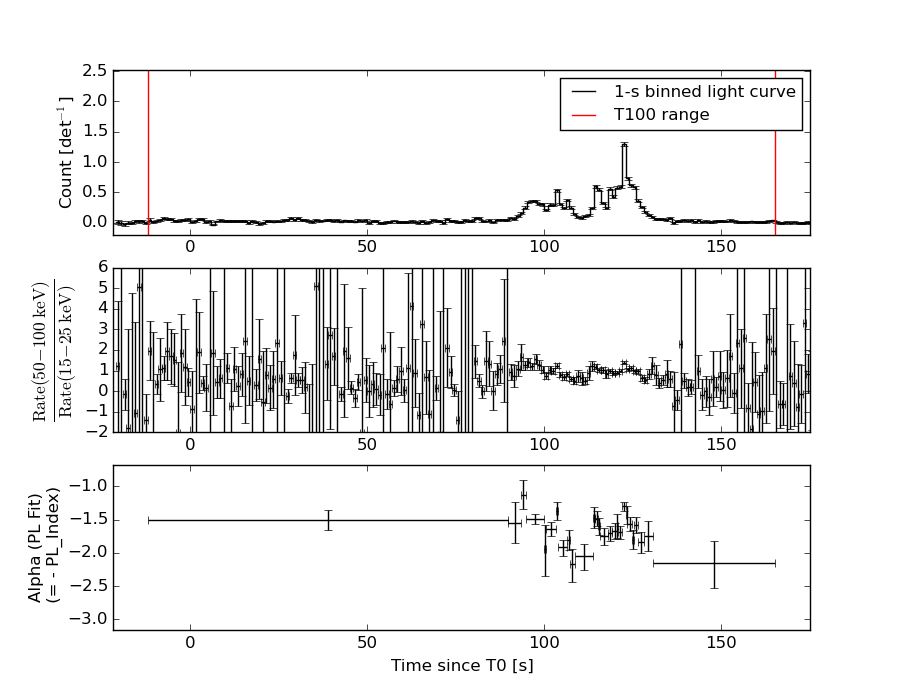
Lightcurves
Notes:
- 1) The mask-weighted light curves are using the flight position.
- 2) Multiple plots of different time binning/intervals are shown to cover all scenarios of short/long GRBs, rate/image triggers, and real/false positives.
- 3) For all the mask-weighted lightcurves, the y-axis units are counts/sec/det where a det is 0.4 x 0.4 = 0.16 sq cm.
- 4) The verticle lines correspond to following: green dotted lines are T50 interval, black dotted lines are T90 interval, blue solid line(s) is a spacecraft slew start time, and orange solid line(s) is a spacecraft slew end time.
- 5) Time of each bin is in the middle of the bin.
1 s binning
From T0-310 s to T0+310 s
From T100_start - 20 s to T100_end + 30 s
Full time interval
64 ms binning
Full time interval
From T100_start to T100_end
From T0-5 sec to T0+5 sec
16 ms binning
From T100_start-5 s to T100_start+5 s
8 ms binning
From T100_start-3 s to T100_start+3 s
2 ms binning
From T100_start-1 s to T100_start+1 s
SN=5 or 10 sec. binning (whichever binning is satisfied first)
SN=5 or 10 sec. binning (T < 200 sec)
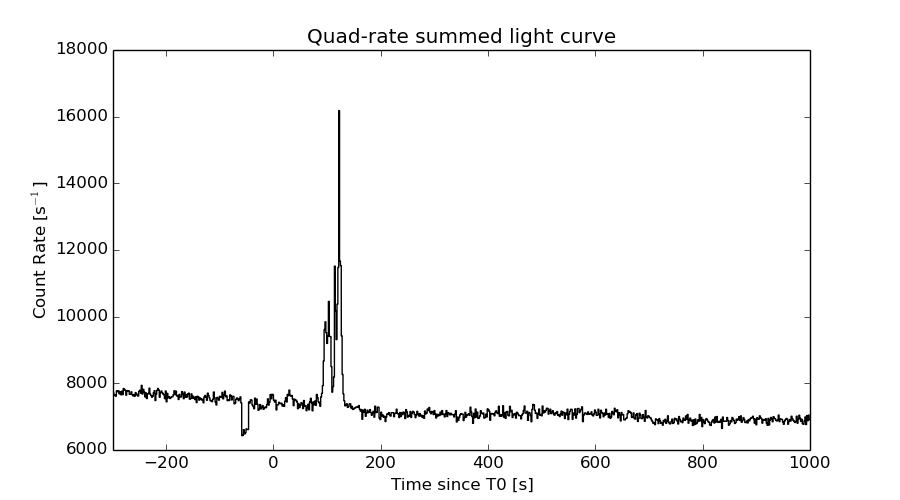
Quad-rate summed light curves (from T0-300s to T0+1000s)
Spectral Evolution
Spectra
Notes:
- 1) The fitting includes the systematic errors.
- 2) When the burst includes telescope slew time periods, the fitting uses an average response file made from multiple 5-s response files through out the slew time plus single time preiod for the non-slew times, and weighted by the total counts in the corresponding time period using addrmf. An average response file is needed becuase a spectral fit using the pre-slew DRM will introduce some errors in both a spectral shape and a normalization if the PHA file contains a lot of the slew/post-slew time interval.
- 3) For fits to more complicated models (e.g. a power-law over a cutoff power-law), the BAT team has decided to require a chi-square improvement of more than 6 for each extra dof.
Time averaged spectrum fit using the average DRM
Power-law model
Time interval is from  -11.948 sec. to  165.008 sec.

Spectral model in power-law:
------------------------------------------------------------
Parameters  : value       lower 90%   higher 90%
Photon index: 1.62833     ( -0.0473648   0.0474909 )
Norm@50keV  : 6.76467E-03    ( -0.000164195   0.000164175 )
------------------------------------------------------------
#Fit statistic : Chi-Squared =          45.63 using 59 PHA bins.
# Reduced chi-squared =         0.8006 for     57 degrees of freedom
# Null hypothesis probability =   8.602492e-01

Photon flux (15-150 keV)    in 177 sec: 0.877088 ( -0.0245258  0.0246484 ) ph/cm2/s
Energy fluence (15-150 keV)             : 1.11611e-05 ( -2.79568e-07  2.7981e-07 ) ergs/cm2
Cutoff power-law model
Time interval is from  -11.948 sec. to  165.008 sec.
Spectral model in the cutoff power-law:
------------------------------------------------------------
Parameters  : value       lower 90%   higher 90%
Photon index: 1.51801     ( -0.186229   0.135973 )
Epeak [keV] : 242.678      ( -117.719 -242.678 )
Norm@50keV  : 7.58682E-03    ( -0.000933805   0.00157001 )
------------------------------------------------------------
#Fit statistic : Chi-Squared =          44.54 using 59 PHA bins.
# Reduced chi-squared =         0.7954 for     56 degrees of freedom
# Null hypothesis probability =   8.649266e-01

Photon flux (15-150 keV)    in 177 sec: 0.868507 ( -0.027835  0.024951 ) ph/cm2/s
Energy fluence (15-150 keV)             : 1.10835e-05 ( -3.10387e-07  3.05874e-07 ) ergs/cm2
Band function
Time interval is from  -11.948 sec. to  165.008 sec.

Spectral model in the Band function:
------------------------------------------------------------
Parameters  : value       lower 90%   higher 90%
alpha       : -0.794239   ( 1.12958   1.12958 )
beta        : -1.64181    ( -0.0615684   0.0546789 )
Epeak [keV] : 39.2982      ( -39.2596 419.59 )
Norm@50keV   : 2.62006E-02    ( -0.0263636   834779 )
------------------------------------------------------------
#Fit statistic : Chi-Squared =          44.86 using 59 PHA bins.
# Reduced chi-squared =         0.8157 for     55 degrees of freedom
# Null hypothesis probability =   8.336801e-01

Photon flux (15-150 keV)    in 177 sec:  (    ) ph/cm2/s
Energy fluence (15-150 keV)             : 0 ( 0  0 ) ergs/cm2
Single BB
Spectral model blackbody:
------------------------------------------------------------
Parameters  : value    Lower 90%  Upper 90%
kT [keV]    : 16.3999  (  )
R^2/D10^2   : 6.65138E-02  (   )
(R is the radius in km and D10 is the distance to the source in units of 10 kpc)
------------------------------------------------------------
#Fit statistic : Chi-Squared =         435.20 using 59 PHA bins.
# Reduced chi-squared =         7.6351 for     57 degrees of freedom
# Null hypothesis probability =   1.209654e-59

Energy  Fluence     90% Error
[keV]   [erg/cm2]   [erg/cm2]
15- 25  6.509e-07   3.363e-08
25- 50  2.797e-06   9.204e-08
50-150  5.306e-06   2.177e-07
15-150  8.754e-06   2.248e-07
Thermal bremsstrahlung (OTTB)
Spectral model: thermal bremsstrahlung
------------------------------------------------------------
Parameters  : value         Lower 90%    Upper 90%
kT [keV]    : 189.748       (-24.3051      -189.169)
Norm        : 3.49491       (-0.0983246     0.106561)
------------------------------------------------------------
#Fit statistic : Chi-Squared =          49.62 using 59 PHA bins.
# Reduced chi-squared =         0.8706 for     57 degrees of freedom
# Null hypothesis probability =   7.453735e-01

Energy  Fluence     90% Error
[keV]   [erg/cm2]   [erg/cm2]
15- 25  1.550e-06   7.806e-08
25- 50  2.964e-06   1.735e-07
50-150  6.394e-06   1.389e-06
15-150  1.091e-05   1.597e-06
Double BB
Spectral model: bbodyrad<1> + bbodyrad<2>
------------------------------------------------------------
Parameters  : value         Lower 90%    Upper 90%
kT1 [keV]   : 6.45953        (-0.531974      0.576568)
R1^2/D10^2  : 1.26765        (-0.354005      0.518955)
kT2 [keV]   : 25.4123        (-1.66555      1.99442)
R2^2/D10^2  : 1.16570E-02    (-0.00283709   0.00336786)
------------------------------------------------------------
#Fit statistic : Chi-Squared =          41.58 using 59 PHA bins.
# Reduced chi-squared =         0.7561 for     55 degrees of freedom
# Null hypothesis probability =   9.092251e-01

Energy  Fluence     90% Error
[keV]   [erg/cm2]   [erg/cm2]
15- 25  1.602e-06   1.380e-07
25- 50  2.913e-06   1.416e-07
50-150  6.466e-06   3.443e-07
15-150  1.098e-05   4.859e-07
Peak spectrum fit
Power-law model

Time interval is from  122.048 sec. to  123.048 sec.

Spectral model in power-law:
------------------------------------------------------------
Parameters  : value       lower 90%   higher 90%
Photon index: 1.30308     ( -0.0709804   0.0708966 )
Norm@50keV  : 9.17034E-02    ( -0.00354666   0.00354663 )
------------------------------------------------------------
#Fit statistic : Chi-Squared =          61.24 using 59 PHA bins.
# Reduced chi-squared =          1.074 for     57 degrees of freedom
# Null hypothesis probability =   3.264042e-01

Photon flux (15-150 keV)    in 1 sec: 10.9467 ( -0.448116  0.449197 ) ph/cm2/s
Energy fluence (15-150 keV)             : 9.05514e-07 ( -3.81074e-08  3.82625e-08 ) ergs/cm2
Cutoff power-law model
Time interval is from  122.048 sec. to  123.048 sec.
Spectral model in the cutoff power-law:
------------------------------------------------------------
Parameters  : value       lower 90%   higher 90%
Photon index: 1.29933     (     )
Epeak [keV] : 1.00000E+04      (   )
Norm@50keV  : 9.20874E-02    ( -0.00356137   0.00356138 )
------------------------------------------------------------
#Fit statistic : Chi-Squared =          61.29 using 59 PHA bins.
# Reduced chi-squared =          1.095 for     56 degrees of freedom
# Null hypothesis probability =   2.919059e-01

Photon flux (15-150 keV)    in 1 sec: 10.9447 ( -0.4478  0.4463 ) ph/cm2/s
Energy fluence (15-150 keV)             : 9.04845e-07 ( -3.7248e-08  3.8251e-08 ) ergs/cm2
Band function
Time interval is from  122.048 sec. to  123.048 sec.

Spectral model in the Band function:
------------------------------------------------------------
Parameters  : value       lower 90%   higher 90%
alpha       : -0.928491   ( 0.93978   0.93978 )
beta        : -1.31431    ( 1.31414   0.0810858 )
Epeak [keV] : 83.0217      ( -87.4745 625.711 )
Norm@50keV   : 0.165003    ( -0.0664356   0 )
------------------------------------------------------------
#Fit statistic : Chi-Squared =          61.19 using 59 PHA bins.
# Reduced chi-squared =          1.113 for     55 degrees of freedom
# Null hypothesis probability =   2.635460e-01

Photon flux (15-150 keV)    in 1 sec:  (    ) ph/cm2/s
Energy fluence (15-150 keV)             : 0 ( 0  0 ) ergs/cm2
Single BB
Spectral model blackbody:
------------------------------------------------------------
Parameters  : value    Lower 90%  Upper 90%
kT [keV]    : 18.3232  (  )
R^2/D10^2   : 0.641557  (   )
(R is the radius in km and D10 is the distance to the source in units of 10 kpc)
------------------------------------------------------------
#Fit statistic : Chi-Squared =         242.67 using 59 PHA bins.
# Reduced chi-squared =         4.2574 for     57 degrees of freedom
# Null hypothesis probability =   9.234765e-25

Energy  Fluence     90% Error
[keV]   [erg/cm2]   [erg/cm2]
15- 25  4.288e-08   3.655e-09
25- 50  2.009e-07   1.170e-08
50-150  4.918e-07   3.350e-08
15-150  7.356e-07   3.645e-08
Thermal bremsstrahlung (OTTB)
Spectral model: thermal bremsstrahlung
------------------------------------------------------------
Parameters  : value         Lower 90%    Upper 90%
kT [keV]    : 200.000       (      )
Norm        : 45.7387       (-1.79216     1.79166)
------------------------------------------------------------
#Fit statistic : Chi-Squared =         106.34 using 59 PHA bins.
# Reduced chi-squared =         1.8656 for     57 degrees of freedom
# Null hypothesis probability =   8.059140e-05

Energy  Fluence     90% Error
[keV]   [erg/cm2]   [erg/cm2]
15- 25  1.139e-07   4.650e-09
25- 50  2.192e-07   9.250e-09
50-150  4.806e-07   2.010e-08
15-150  8.137e-07   3.350e-08
Double BB
Spectral model: bbodyrad<1> + bbodyrad<2>
------------------------------------------------------------
Parameters  : value         Lower 90%    Upper 90%
kT1 [keV]   : 8.94373        (-1.15953      1.23558)
R1^2/D10^2  : 4.95780        (-1.61325      2.72214)
kT2 [keV]   : 42.5991        (-8.35309      16.0261)
R2^2/D10^2  : 3.46403E-02    (-0.019857   0.032876)
------------------------------------------------------------
#Fit statistic : Chi-Squared =          64.90 using 59 PHA bins.
# Reduced chi-squared =          1.180 for     55 degrees of freedom
# Null hypothesis probability =   1.698173e-01

Energy  Fluence     90% Error
[keV]   [erg/cm2]   [erg/cm2]
15- 25  8.471e-08   1.100e-08
25- 50  2.158e-07   2.095e-08
50-150  6.150e-07   1.140e-07
15-150  9.155e-07   1.303e-07
Pre-slew spectrum (Pre-slew PHA with pre-slew DRM)
Power-law model
Spectral model in power-law:
------------------------------------------------------------
Parameters  : value       lower 90%   higher 90%
Photon index: 1.63547     ( -0.0474176   0.0475087 )
Norm@50keV  : 6.90137E-03    ( -0.000167619   0.000167599 )
------------------------------------------------------------
#Fit statistic : Chi-Squared =          44.79 using 59 PHA bins.
# Reduced chi-squared =         0.7857 for     57 degrees of freedom
# Null hypothesis probability =   8.797736e-01

Photon flux (15-150 keV)    in 169.9 sec: 0.896880 ( -0.0251038  0.0252117 ) ph/cm2/s
Energy fluence (15-150 keV)             : 1.09215e-05 ( -2.73614e-07  2.73974e-07 ) ergs/cm2
Cutoff power-law model
Spectral model in the cutoff power-law:
------------------------------------------------------------
Parameters  : value       lower 90%   higher 90%
Photon index: 1.53270     ( -0.186031   0.129164 )
Epeak [keV] : 251.918      (   )
Norm@50keV  : 7.68177E-03    (     )
------------------------------------------------------------
#Fit statistic : Chi-Squared =          43.84 using 59 PHA bins.
# Reduced chi-squared =         0.7829 for     56 degrees of freedom
# Null hypothesis probability =   8.810677e-01

Photon flux (15-150 keV)    in 169.9 sec: 0.888697 ( -0.02847  0.014324 ) ph/cm2/s
Energy fluence (15-150 keV)             : 1.08505e-05 ( -3.04121e-07  2.98073e-07 ) ergs/cm2
Band function
Spectral model in the Band function:
------------------------------------------------------------
Parameters  : value       lower 90%   higher 90%
alpha       : -0.966789   ( 1.12538   1.12538 )
beta        : -1.65023    ( -0.0624419   0.0552755 )
Epeak [keV] : 44.1679      ( -44.0443 -44.0443 )
Norm@50keV   : 1.98127E-02    ( -0.0201493   918767 )
------------------------------------------------------------
#Fit statistic : Chi-Squared =          43.97 using 59 PHA bins.
# Reduced chi-squared =         0.7994 for     55 degrees of freedom
# Null hypothesis probability =   8.570446e-01

Photon flux (15-150 keV)    in 169.9 sec:  (    ) ph/cm2/s
Energy fluence (15-150 keV)             : 0 ( 0  0 ) ergs/cm2
S(25-50 keV) vs. S(50-100 keV) plot
S(25-50 keV)  = 2.93e-06
S(50-100 keV) = 3.79e-06
T90 vs. Hardness ratio plot
T90                                   = 117.004000008106 sec.
Hardness ratio (energy fluence ratio) = 1.29352
Color vs. Color plot
Count Ratio  (25-50 keV) / (15-25 keV) = 1.30637
Count Ratio (50-100 keV) / (15-25 keV) = 1.01445
Mask shadow pattern
IMX = -4.203805169982753E-01, IMY = 6.051591383681547E-01
TIME vs. PHA plot around the trigger time
TIME vs. DetID plot around the trigger time
100 us light curve (15-350 keV)
Spacecraft aspect plot
Bright source in the pre-burst/pre-slew/post-slew images
Pre-burst image of 15-350 keV band
Time interval of the image:
Pre-slew background subtracted image of 15-350 keV band
Time interval of the image:
-4.899400 165.008000

# RAcent  DECcent POSerr Theta    Phi  PeakCts   SNR AngSep     Name
#  [deg]    [deg]    ['] [deg]  [deg]                   [']
288.8042  10.9288    1.7  34.0  113.5   2.0943   6.8    1.1	GRS 1915+105
299.5729  35.1965    0.4  36.9  159.1   7.8576  28.3    0.9	Cyg X-1
308.0669  40.9091    2.6  38.2  173.4   1.1338   4.5    3.3	Cyg X-3
326.2396  38.1791   11.1  33.3 -163.5   0.2368   1.0    9.1	Cyg X-2
291.2683  -2.4922    2.8  32.2   88.6   1.3365   4.1 ------	UNKNOWN
350.9207  29.7631    0.2  36.4 -124.8  18.0209  53.2 ------	UNKNOWN
Post-slew image of 15-350 keV band
Time interval of the image:
730.300600 963.182300

# RAcent  DECcent POSerr Theta    Phi  PeakCts   SNR AngSep     Name
#  [deg]    [deg]    ['] [deg]  [deg]                   [']
 83.6299  22.0007    0.6  52.7 -177.8   8.8541  19.3    0.8	Crab
308.0120  40.8491   34.3  56.9  -26.2  -0.3210  -0.3    7.6	Cyg X-3
 68.7119  36.8851    3.3  36.4 -161.9   0.7355   3.5 ------	UNKNOWN
 19.4086  36.8103    3.2  41.1  -97.8   2.8772   3.6 ------	UNKNOWN
Plot creation:
Sun May 31 04:38:03 EDT 2015