Click here for the BAT GCN circular template
Image
Pre-slew 15.0-350.0 keV image (Event data)
#   RAcent    DECcent   POSerr    Theta     Phi              Peak Cts       SNR   Name
   95.0923    -8.9620   0.0020    33.1437     3.8649        10.6201444     94.740 TRIG_00348152

Foreground time interval of the image:
 -0.140   9.413 (delta_t =   9.553 [sec])
Background time interval of the image:
-239.488  -0.140 (delta_t = 239.348 [sec])
Lightcurves
Notes:
- 1) The mask-weighted light curves are using the flight position.
- 2) Multiple plots of different time binning/intervals are shown to cover all scenarios of short/long GRBs, rate/image triggers, and real/false positives.
- 3) For all the mask-weighted lightcurves, the y-axis units are counts/sec/det where a det is 0.4 x 0.4 = 0.16 sq cm.
- 4) The verticle lines correspond to following: green dotted lines are T50 interval, black dotted lines are T90 interval, blue solid line(s) is a spacecraft slew start time, and orange solid line(s) is a spacecraft slew end time.
- 5) Time of each bin is in the middle of the bin.
1 s binning
From T0-310 s to T0+310 s

From T100_start - 20 s to T100_end + 30 s
Full time interval

64 ms binning
Full time interval

From T100_start to T100_end
From T0-5 sec to T0+5 sec

16 ms binning
From T100_start-5 s to T100_start+5 s

8 ms binning
From T100_start-3 s to T100_start+3 s
2 ms binning
From T100_start-1 s to T100_start+1 s
SN=5 or 10 sec. binning (whichever binning is satisfied first)
SN=5 or 10 sec. binning (T < 200 sec)

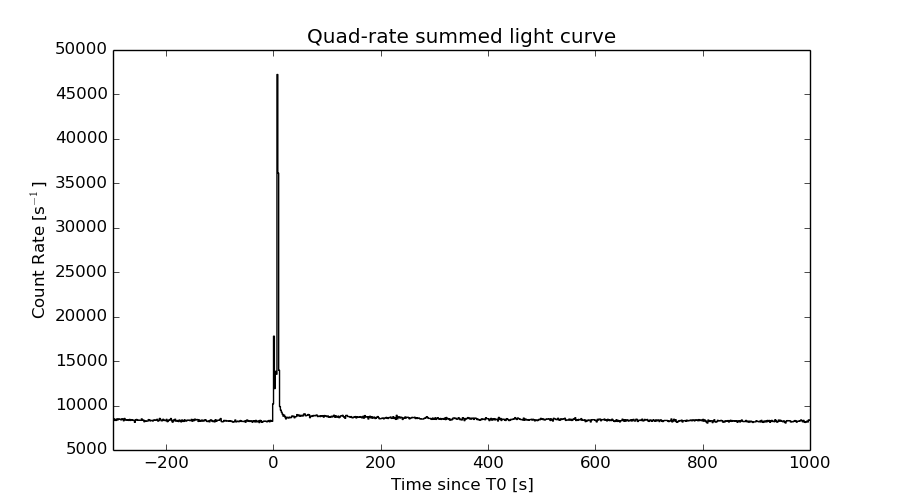
Quad-rate summed light curves (from T0-300s to T0+1000s)
Spectral Evolution

Spectra
Notes:
- 1) The fitting includes the systematic errors.
- 2) When the burst includes telescope slew time periods, the fitting uses an average response file made from multiple 5-s response files through out the slew time plus single time preiod for the non-slew times, and weighted by the total counts in the corresponding time period using addrmf. An average response file is needed becuase a spectral fit using the pre-slew DRM will introduce some errors in both a spectral shape and a normalization if the PHA file contains a lot of the slew/post-slew time interval.
- 3) For fits to more complicated models (e.g. a power-law over a cutoff power-law), the BAT team has decided to require a chi-square improvement of more than 6 for each extra dof.
Time averaged spectrum fit using the average DRM
Power-law model
Time interval is from   -0.140 sec. to  326.136 sec.

Spectral model in power-law:
------------------------------------------------------------
Parameters  : value       lower 90%   higher 90%
Photon index: 1.28784     ( -0.0456424   0.0455382 )
Norm@50keV  : 3.30618E-03    ( -7.58519e-05   7.57632e-05 )
------------------------------------------------------------
#Fit statistic : Chi-Squared =          63.69 using 59 PHA bins.
# Reduced chi-squared =          1.117 for     57 degrees of freedom
# Null hypothesis probability =   2.527831e-01

Photon flux (15-150 keV)    in 326.3 sec: 0.393566 ( -0.0100354  0.0101059 ) ph/cm2/s
Energy fluence (15-150 keV)             : 1.06925e-05 ( -2.54233e-07  2.54823e-07 ) ergs/cm2
Cutoff power-law model

Time interval is from   -0.140 sec. to  326.136 sec.
Spectral model in the cutoff power-law:
------------------------------------------------------------
Parameters  : value       lower 90%   higher 90%
Photon index: 1.28661     ( -0.0872032   0.0437425 )
Epeak [keV] : 9999.30      ( -9999.36 -9999.36 )
Norm@50keV  : 3.31714E-03    ( -7.55903e-05   0.000295026 )
------------------------------------------------------------
#Fit statistic : Chi-Squared =          63.81 using 59 PHA bins.
# Reduced chi-squared =          1.139 for     56 degrees of freedom
# Null hypothesis probability =   2.210613e-01

Photon flux (15-150 keV)    in 326.3 sec: 0.393783 ( -0.010523  0.009674 ) ph/cm2/s
Energy fluence (15-150 keV)             : 1.06912e-05 ( -2.50631e-07  2.4851e-07 ) ergs/cm2
Band function

Time interval is from   -0.140 sec. to  326.136 sec.

Spectral model in the Band function:
------------------------------------------------------------
Parameters  : value       lower 90%   higher 90%
alpha       : -1.01185   ( 1.01225   1.01225 )
beta        : -1.28782    ( -0.0455385   0.0456357 )
Epeak [keV] : 45.9358      ( -45.5584 -45.5584 )
Norm@50keV   : 6.34182E-03    ( -0.00217967   0 )
------------------------------------------------------------
#Fit statistic : Chi-Squared =          63.69 using 59 PHA bins.
# Reduced chi-squared =          1.158 for     55 degrees of freedom
# Null hypothesis probability =   1.972125e-01

Photon flux (15-150 keV)    in 326.3 sec:  (    ) ph/cm2/s
Energy fluence (15-150 keV)             : 0 ( 0  0 ) ergs/cm2
Single BB

Spectral model blackbody:
------------------------------------------------------------
Parameters  : value    Lower 90%  Upper 90%
kT [keV]    : 20.2372  (  )
R^2/D10^2   : 1.62747E-02  (   )
(R is the radius in km and D10 is the distance to the source in units of 10 kpc)
------------------------------------------------------------
#Fit statistic : Chi-Squared =         464.33 using 59 PHA bins.
# Reduced chi-squared =         8.1461 for     57 degrees of freedom
# Null hypothesis probability =   3.371218e-65

Energy  Fluence     90% Error
[keV]   [erg/cm2]   [erg/cm2]
15- 25  4.173e-07   2.137e-08
25- 50  2.095e-06   7.472e-08
50-150  6.370e-06   2.284e-07
15-150  8.882e-06   2.235e-07
Thermal bremsstrahlung (OTTB)

Spectral model: thermal bremsstrahlung
------------------------------------------------------------
Parameters  : value         Lower 90%    Upper 90%
kT [keV]    : 199.363       (      )
Norm        : 1.67665       (     )
------------------------------------------------------------
#Fit statistic : Chi-Squared =         199.85 using 59 PHA bins.
# Reduced chi-squared =         3.5061 for     57 degrees of freedom
# Null hypothesis probability =   9.416757e-18

Energy  Fluence     90% Error
[keV]   [erg/cm2]   [erg/cm2]
15- 25  1.362e-06   3.622e-08
25- 50  2.621e-06   7.162e-08
50-150  5.747e-06   1.436e-07
15-150  9.730e-06   2.561e-07
Double BB

Spectral model: bbodyrad<1> + bbodyrad<2>
------------------------------------------------------------
Parameters  : value         Lower 90%    Upper 90%
kT1 [keV]   : 7.11320        (-0.684455      0.764311)
R1^2/D10^2  : 0.341285        (-0.10347      0.158241)
kT2 [keV]   : 31.2236        (-2.34103      2.96803)
R2^2/D10^2  : 3.42991E-03    (-0.000879627   0.00101898)
------------------------------------------------------------
#Fit statistic : Chi-Squared =          75.83 using 59 PHA bins.
# Reduced chi-squared =          1.379 for     55 degrees of freedom
# Null hypothesis probability =   3.277374e-02

Energy  Fluence     90% Error
[keV]   [erg/cm2]   [erg/cm2]
15- 25  1.087e-06   1.038e-07
25- 50  2.343e-06   1.220e-07
50-150  7.297e-06   3.704e-07
15-150  1.073e-05   4.552e-07
Peak spectrum fit
Power-law model

Time interval is from    6.492 sec. to    7.492 sec.

Spectral model in power-law:
------------------------------------------------------------
Parameters  : value       lower 90%   higher 90%
Photon index: 0.743320     ( -0.0390962   0.0388378 )
Norm@50keV  : 0.199274    ( -0.00457439   0.00456205 )
------------------------------------------------------------
#Fit statistic : Chi-Squared =          72.49 using 59 PHA bins.
# Reduced chi-squared =          1.272 for     57 degrees of freedom
# Null hypothesis probability =   8.101370e-02

Photon flux (15-150 keV)    in 1 sec: 22.9651 ( -0.509398  0.509641 ) ph/cm2/s
Energy fluence (15-150 keV)             : 2.38604e-06 ( -5.51623e-08  5.51983e-08 ) ergs/cm2
Cutoff power-law model

Time interval is from    6.492 sec. to    7.492 sec.
Spectral model in the cutoff power-law:
------------------------------------------------------------
Parameters  : value       lower 90%   higher 90%
Photon index: 0.469117     ( -0.167958   0.161994 )
Epeak [keV] : 353.484      ( -108.943 389.818 )
Norm@50keV  : 0.256932    ( -0.0351092   0.0419726 )
------------------------------------------------------------
#Fit statistic : Chi-Squared =          64.01 using 59 PHA bins.
# Reduced chi-squared =          1.143 for     56 degrees of freedom
# Null hypothesis probability =   2.159743e-01

Photon flux (15-150 keV)    in 1 sec: 22.7575 ( -0.5215  0.5221 ) ph/cm2/s
Energy fluence (15-150 keV)             : 2.37389e-06 ( 0  0 ) ergs/cm2
Band function

Time interval is from    6.492 sec. to    7.492 sec.

Spectral model in the Band function:
------------------------------------------------------------
Parameters  : value       lower 90%   higher 90%
alpha       : -0.877209   ( 0.877209   0.877209 )
beta        : -0.743322    ( -0.0388364   0.0390977 )
Epeak [keV] : 15.4149      ( -15.4149 -15.4149 )
Norm@50keV   : 0.284993    ( -0.0901966   0 )
------------------------------------------------------------
#Fit statistic : Chi-Squared =          72.49 using 59 PHA bins.
# Reduced chi-squared =          1.318 for     55 degrees of freedom
# Null hypothesis probability =   5.704862e-02

Photon flux (15-150 keV)    in 1 sec:  (    ) ph/cm2/s
Energy fluence (15-150 keV)             : 0 ( 0  0 ) ergs/cm2
Single BB

Spectral model blackbody:
------------------------------------------------------------
Parameters  : value    Lower 90%  Upper 90%
kT [keV]    : 27.1201  (  )
R^2/D10^2   : 0.471764  (   )
(R is the radius in km and D10 is the distance to the source in units of 10 kpc)
------------------------------------------------------------
#Fit statistic : Chi-Squared =         283.52 using 59 PHA bins.
# Reduced chi-squared =         4.9741 for     57 degrees of freedom
# Null hypothesis probability =   8.631279e-32

Energy  Fluence     90% Error
[keV]   [erg/cm2]   [erg/cm2]
15- 25  5.763e-08   2.450e-09
25- 50  3.402e-07   1.180e-08
50-150  1.826e-06   5.750e-08
15-150  2.223e-06   5.400e-08
Thermal bremsstrahlung (OTTB)

Spectral model: thermal bremsstrahlung
------------------------------------------------------------
Parameters  : value         Lower 90%    Upper 90%
kT [keV]    : 199.363       (      )
Norm        : 88.9226       (     )
------------------------------------------------------------
#Fit statistic : Chi-Squared =        1186.83 using 59 PHA bins.
# Reduced chi-squared =        20.8215 for     57 degrees of freedom
# Null hypothesis probability =  6.504723e-211

Energy  Fluence     90% Error
[keV]   [erg/cm2]   [erg/cm2]
15- 25  2.214e-07   5.300e-09
25- 50  4.259e-07   1.035e-08
50-150  9.342e-07   2.245e-08
15-150  1.582e-06   3.600e-08
Double BB

Spectral model: bbodyrad<1> + bbodyrad<2>
------------------------------------------------------------
Parameters  : value         Lower 90%    Upper 90%
kT1 [keV]   : 11.3085        (-1.55484      1.76989)
R1^2/D10^2  : 2.96754        (-0.831859      1.32255)
kT2 [keV]   : 45.8531        (-5.87672      10.2705)
R2^2/D10^2  : 8.87560E-02    (-0.0381815   0.0447127)
------------------------------------------------------------
#Fit statistic : Chi-Squared =          66.94 using 59 PHA bins.
# Reduced chi-squared =          1.217 for     55 degrees of freedom
# Null hypothesis probability =   1.297541e-01

Energy  Fluence     90% Error
[keV]   [erg/cm2]   [erg/cm2]
15- 25  1.015e-07   1.031e-08
25- 50  3.875e-07   2.655e-08
50-150  1.896e-06   1.825e-07
15-150  2.385e-06   1.925e-07
Pre-slew spectrum (Pre-slew PHA with pre-slew DRM)
Power-law model

Spectral model in power-law:
------------------------------------------------------------
Parameters  : value       lower 90%   higher 90%
Photon index: 0.941024     ( -0.028074   0.0279475 )
Norm@50keV  : 7.36929E-02    ( -0.00120795   0.00120523 )
------------------------------------------------------------
#Fit statistic : Chi-Squared =          56.97 using 59 PHA bins.
# Reduced chi-squared =         0.9994 for     57 degrees of freedom
# Null hypothesis probability =   4.763479e-01

Photon flux (15-150 keV)    in 9.553 sec: 8.46441 ( -0.141149  0.141311 ) ph/cm2/s
Energy fluence (15-150 keV)             : 7.77802e-06 ( -1.20462e-07  1.20438e-07 ) ergs/cm2
Cutoff power-law model

Spectral model in the cutoff power-law:
------------------------------------------------------------
Parameters  : value       lower 90%   higher 90%
Photon index: 0.700018     ( -0.120431   0.117438 )
Epeak [keV] : 350.220      ( -93.7307 256.595 )
Norm@50keV  : 9.13985E-02    ( -0.00892596   0.0101 )
------------------------------------------------------------
#Fit statistic : Chi-Squared =          44.50 using 59 PHA bins.
# Reduced chi-squared =         0.7946 for     56 degrees of freedom
# Null hypothesis probability =   8.659444e-01

Photon flux (15-150 keV)    in 9.553 sec: 8.35533 ( -0.14892  0.14939 ) ph/cm2/s
Energy fluence (15-150 keV)             : 7.74582e-06 ( -1.22766e-07  1.22584e-07 ) ergs/cm2
Band function

Spectral model in the Band function:
------------------------------------------------------------
Parameters  : value       lower 90%   higher 90%
alpha       : -0.628350   ( -0.131503   0.337217 )
beta        : -1.07911    ( 1.13623   0.155408 )
Epeak [keV] : 260.024      ( -231.145 288.955 )
Norm@50keV   : 9.93597E-02    ( -0.0111555   0.164328 )
------------------------------------------------------------
#Fit statistic : Chi-Squared =          44.58 using 59 PHA bins.
# Reduced chi-squared =         0.8106 for     55 degrees of freedom
# Null hypothesis probability =   8.412095e-01

Photon flux (15-150 keV)    in 9.553 sec:  (    ) ph/cm2/s
Energy fluence (15-150 keV)             : 0 ( 0  0 ) ergs/cm2
S(25-50 keV) vs. S(50-100 keV) plot

S(25-50 keV)  = 2.36e-06
S(50-100 keV) = 3.87e-06
T90 vs. Hardness ratio plot
T90                                   = 186.504000008106 sec.
Hardness ratio (energy fluence ratio) = 1.63983
Color vs. Color plot

Count Ratio  (25-50 keV) / (15-25 keV) = 1.377
Count Ratio (50-100 keV) / (15-25 keV) = 1.29355
Mask shadow pattern

IMX = 6.514938543516368E-01, IMY = -4.401298218217560E-02
TIME vs. PHA plot around the trigger time
TIME vs. DetID plot around the trigger time

100 us light curve (15-350 keV)

Spacecraft aspect plot

Bright source in the pre-burst/pre-slew/post-slew images
Pre-burst image of 15-350 keV band
Time interval of the image:
-239.488000 -0.140000

# RAcent  DECcent POSerr Theta    Phi  PeakCts   SNR AngSep     Name
#  [deg]    [deg]    ['] [deg]  [deg]                   [']
135.5397 -40.4832    3.2  33.5   98.8   1.4320   3.6    4.3	Vela X-1
118.1907 -16.1626    2.3  34.9   46.7   1.6212   4.9 ------	UNKNOWN
 94.5195 -47.6405    2.1   6.4  151.5   0.8794   5.5 ------	UNKNOWN
307.5708 -77.7434    2.4  58.3 -175.6   5.5786   4.7 ------	UNKNOWN
 28.0554 -45.3677    2.8  44.3 -121.0   3.0174   4.1 ------	UNKNOWN
Pre-slew background subtracted image of 15-350 keV band
Time interval of the image:
-0.140000 9.412600

# RAcent  DECcent POSerr Theta    Phi  PeakCts   SNR AngSep     Name
#  [deg]    [deg]    ['] [deg]  [deg]                   [']
135.3190 -40.5206    4.7  33.3   98.7  -0.5006  -2.5    9.8	Vela X-1
121.6680 -28.0923    2.1  28.7   67.1   0.8213   5.4 ------	UNKNOWN
 95.0923  -8.9620    0.1  33.1    3.9  10.6201  94.7 ------	UNKNOWN
 55.0412 -41.3793    3.2  26.4 -105.2   0.4031   3.6 ------	UNKNOWN
333.7286 -69.6842    3.9  59.4 -163.2   1.7916   3.0 ------	UNKNOWN
 54.2722 -17.8141    4.2  39.2  -67.5   0.6474   2.8 ------	UNKNOWN
Post-slew image of 15-350 keV band
Time interval of the image:
62.212600 962.561900

# RAcent  DECcent POSerr Theta    Phi  PeakCts   SNR AngSep     Name
#  [deg]    [deg]    ['] [deg]  [deg]                   [']
 83.6246  22.0198    0.2  33.0  -25.1  37.2400  61.8    0.6	Crab
117.1545 -55.1754    3.3  49.4  158.3   5.7843   3.5 ------	UNKNOWN
 95.0790  -8.9799    1.6   0.0 -149.0   4.1805   7.2 ------	UNKNOWN
 99.2073  45.5876    3.4  54.7   -1.8   6.9297   3.4 ------	UNKNOWN
 92.3966  -0.5497    3.2   8.8  -23.2   1.8354   3.6 ------	UNKNOWN
 69.3340  -6.0196    3.3  25.7  -90.6   2.3449   3.5 ------	UNKNOWN
Plot creation:
Sun May 31 04:36:24 EDT 2015