Click here for the BAT GCN circular template
Image
Pre-slew 15.0-350.0 keV image (Event data)
#   RAcent    DECcent   POSerr    Theta     Phi              Peak Cts       SNR   Name
  239.2334    35.5174   0.0046    19.6844    27.5262         4.2855766     42.007 TRIG_00348428

Foreground time interval of the image:
-35.172  27.429 (delta_t =  62.601 [sec])
Background time interval of the image:
-239.072 -35.172 (delta_t = 203.900 [sec])
Lightcurves
Notes:
- 1) The mask-weighted light curves are using the flight position.
- 2) Multiple plots of different time binning/intervals are shown to cover all scenarios of short/long GRBs, rate/image triggers, and real/false positives.
- 3) For all the mask-weighted lightcurves, the y-axis units are counts/sec/det where a det is 0.4 x 0.4 = 0.16 sq cm.
- 4) The verticle lines correspond to following: green dotted lines are T50 interval, black dotted lines are T90 interval, blue solid line(s) is a spacecraft slew start time, and orange solid line(s) is a spacecraft slew end time.
- 5) Time of each bin is in the middle of the bin.
1 s binning
From T0-310 s to T0+310 s

From T100_start - 20 s to T100_end + 30 s
Full time interval
64 ms binning
Full time interval

From T100_start to T100_end

From T0-5 sec to T0+5 sec

16 ms binning
From T100_start-5 s to T100_start+5 s

Blue+Cyan dotted lines: Time interval of the scaled map
From 0.000000 to 2.048000
8 ms binning
From T100_start-3 s to T100_start+3 s

Blue+Cyan dotted lines: Time interval of the scaled map
From 0.000000 to 2.048000
2 ms binning
From T100_start-1 s to T100_start+1 s

Blue+Cyan dotted lines: Time interval of the scaled map
From 0.000000 to 2.048000
SN=5 or 10 sec. binning (whichever binning is satisfied first)
SN=5 or 10 sec. binning (T < 200 sec)

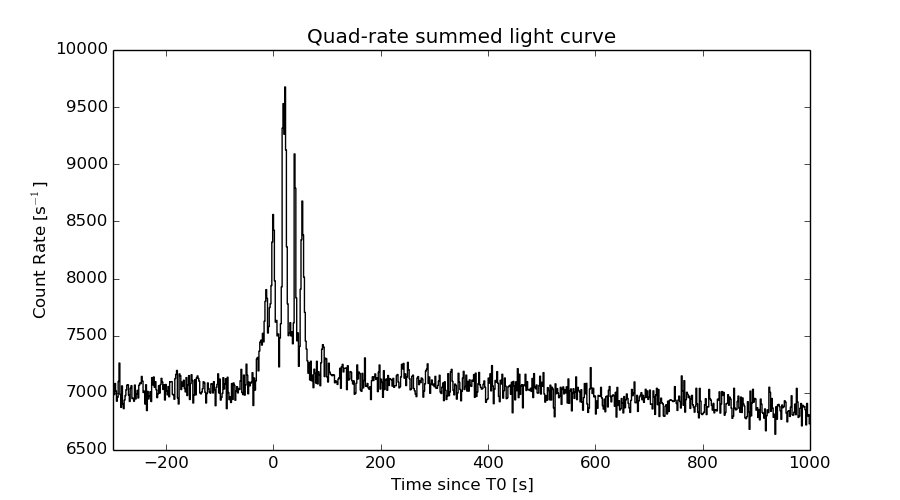
Quad-rate summed light curves (from T0-300s to T0+1000s)
Spectral Evolution

Spectra
Notes:
- 1) The fitting includes the systematic errors.
- 2) When the burst includes telescope slew time periods, the fitting uses an average response file made from multiple 5-s response files through out the slew time plus single time preiod for the non-slew times, and weighted by the total counts in the corresponding time period using addrmf. An average response file is needed becuase a spectral fit using the pre-slew DRM will introduce some errors in both a spectral shape and a normalization if the PHA file contains a lot of the slew/post-slew time interval.
- 3) For fits to more complicated models (e.g. a power-law over a cutoff power-law), the BAT team has decided to require a chi-square improvement of more than 6 for each extra dof.
Time averaged spectrum fit using the average DRM
Power-law model

Time interval is from  -35.172 sec. to   94.640 sec.

Spectral model in power-law:
------------------------------------------------------------
Parameters  : value       lower 90%   higher 90%
Photon index: 2.26112     ( -0.0795108   0.0809617 )
Norm@50keV  : 2.53084E-03    ( -0.000112364   0.000111374 )
------------------------------------------------------------
#Fit statistic : Chi-Squared =          39.84 using 59 PHA bins.
# Reduced chi-squared =         0.6989 for     57 degrees of freedom
# Null hypothesis probability =   9.591410e-01

Photon flux (15-150 keV)    in 129.8 sec: 0.432920 ( -0.0168316  0.0169314 ) ph/cm2/s
Energy fluence (15-150 keV)             : 3.11782e-06 ( -1.16963e-07  1.17552e-07 ) ergs/cm2
Cutoff power-law model
Time interval is from  -35.172 sec. to   94.640 sec.
Spectral model in the cutoff power-law:
------------------------------------------------------------
Parameters  : value       lower 90%   higher 90%
Photon index: 1.94523     ( -0.327671   0.0502425 )
Epeak [keV] : 7.61784      ( -6.33142 20.0202 )
Norm@50keV  : 3.74849E-03    ( -0.000674738   0.00186746 )
------------------------------------------------------------
#Fit statistic : Chi-Squared =          37.20 using 59 PHA bins.
# Reduced chi-squared =         0.6643 for     56 degrees of freedom
# Null hypothesis probability =   9.750852e-01

Photon flux (15-150 keV)    in 129.8 sec: 0.421946 ( -0.020063  0.020174 ) ph/cm2/s
Energy fluence (15-150 keV)             : 3.01612e-06 ( -1.55228e-07  1.56902e-07 ) ergs/cm2
Band function

Time interval is from  -35.172 sec. to   94.640 sec.

Spectral model in the Band function:
------------------------------------------------------------
Parameters  : value       lower 90%   higher 90%
alpha       : -1.93849   ( 1.83037   1.83037 )
beta        : -10.0000    ( 10   1.77636e-15 )
Epeak [keV] : 8.38877      ( -1.80292 18.9363 )
Norm@50keV   : 3.77680E-03    ( -0.000214151   0.00156083 )
------------------------------------------------------------
#Fit statistic : Chi-Squared =          37.21 using 59 PHA bins.
# Reduced chi-squared =         0.6765 for     55 degrees of freedom
# Null hypothesis probability =   9.684755e-01

Photon flux (15-150 keV)    in 129.8 sec:  (    ) ph/cm2/s
Energy fluence (15-150 keV)             : 3.01048e-06 ( 0  0 ) ergs/cm2
Single BB

Spectral model blackbody:
------------------------------------------------------------
Parameters  : value    Lower 90%  Upper 90%
kT [keV]    : 9.82601  (  )
R^2/D10^2   : 0.187354  (   )
(R is the radius in km and D10 is the distance to the source in units of 10 kpc)
------------------------------------------------------------
#Fit statistic : Chi-Squared =         186.27 using 59 PHA bins.
# Reduced chi-squared =         3.2679 for     57 degrees of freedom
# Null hypothesis probability =   1.240743e-15

Energy  Fluence     90% Error
[keV]   [erg/cm2]   [erg/cm2]
15- 25  4.752e-07   3.122e-08
25- 50  1.152e-06   4.348e-08
50-150  5.715e-07   5.562e-08
15-150  2.199e-06   8.242e-08
Thermal bremsstrahlung (OTTB)

Spectral model: thermal bremsstrahlung
------------------------------------------------------------
Parameters  : value         Lower 90%    Upper 90%
kT [keV]    : 50.4121       (-5.08979      6.32285)
Norm        : 2.31315       (-0.160695     0.192131)
------------------------------------------------------------
#Fit statistic : Chi-Squared =          45.97 using 59 PHA bins.
# Reduced chi-squared =         0.8064 for     57 degrees of freedom
# Null hypothesis probability =   8.520336e-01

Energy  Fluence     90% Error
[keV]   [erg/cm2]   [erg/cm2]
15- 25  7.355e-07   4.433e-08
25- 50  1.059e-06   4.322e-08
50-150  1.037e-06   9.034e-08
15-150  2.832e-06   1.168e-07
Double BB

Spectral model: bbodyrad<1> + bbodyrad<2>
------------------------------------------------------------
Parameters  : value         Lower 90%    Upper 90%
kT1 [keV]   : 4.93746        (-0.632546      0.696119)
R1^2/D10^2  : 2.22797        (-0.941307      1.89331)
kT2 [keV]   : 16.2469        (-1.74412      2.28154)
R2^2/D10^2  : 1.91013E-02    (-0.0082842   0.0122757)
------------------------------------------------------------
#Fit statistic : Chi-Squared =          41.61 using 59 PHA bins.
# Reduced chi-squared =         0.7565 for     55 degrees of freedom
# Null hypothesis probability =   9.087630e-01

Energy  Fluence     90% Error
[keV]   [erg/cm2]   [erg/cm2]
15- 25  8.034e-07   1.080e-07
25- 50  9.981e-07   9.326e-08
50-150  1.083e-06   1.480e-07
15-150  2.884e-06   2.921e-07
Peak spectrum fit
Power-law model

Time interval is from   17.320 sec. to   18.320 sec.

Spectral model in power-law:
------------------------------------------------------------
Parameters  : value       lower 90%   higher 90%
Photon index: 1.80489     ( -0.153807   0.158289 )
Norm@50keV  : 1.42878E-02    ( -0.00134687   0.00132168 )
------------------------------------------------------------
#Fit statistic : Chi-Squared =          47.01 using 59 PHA bins.
# Reduced chi-squared =         0.8248 for     57 degrees of freedom
# Null hypothesis probability =   8.245727e-01

Photon flux (15-150 keV)    in 1 sec: 1.97258 ( -0.161632  0.161843 ) ph/cm2/s
Energy fluence (15-150 keV)             : 1.31512e-07 ( -1.25445e-08  1.26936e-08 ) ergs/cm2
Cutoff power-law model

Time interval is from   17.320 sec. to   18.320 sec.
Spectral model in the cutoff power-law:
------------------------------------------------------------
Parameters  : value       lower 90%   higher 90%
Photon index: 2.03040     (     )
Epeak [keV] : 13.1839      (   )
Norm@50keV  : 1.09663E-02    (     )
------------------------------------------------------------
#Fit statistic : Chi-Squared =          46.62 using 59 PHA bins.
# Reduced chi-squared =         0.8324 for     56 degrees of freedom
# Null hypothesis probability =   8.099779e-01

Photon flux (15-150 keV)    in 1 sec: 1.97420 ( -0.24319  0.15997 ) ph/cm2/s
Energy fluence (15-150 keV)             : 1.30933e-07 ( -1.1984e-08  1.3044e-08 ) ergs/cm2
Band function

Time interval is from   17.320 sec. to   18.320 sec.

Spectral model in the Band function:
------------------------------------------------------------
Parameters  : value       lower 90%   higher 90%
alpha       : 4.89474   ( -4.89474   -4.89474 )
beta        : -1.82604    ( -0.169896   0.160345 )
Epeak [keV] : 18.4146      ( -18.4146 4.85125 )
Norm@50keV   : 1.15811E+04    ( -935.626   1.30999e+07 )
------------------------------------------------------------
#Fit statistic : Chi-Squared =          46.86 using 59 PHA bins.
# Reduced chi-squared =         0.8520 for     55 degrees of freedom
# Null hypothesis probability =   7.745440e-01

Photon flux (15-150 keV)    in 1 sec:  (    ) ph/cm2/s
Energy fluence (15-150 keV)             : 0 ( 0  0 ) ergs/cm2
Single BB
Spectral model blackbody:
------------------------------------------------------------
Parameters  : value    Lower 90%  Upper 90%
kT [keV]    : 11.5704  (-1.38903  1.6037)
R^2/D10^2   : 0.516669  (-0.195077   0.313923)
(R is the radius in km and D10 is the distance to the source in units of 10 kpc)
------------------------------------------------------------
#Fit statistic : Chi-Squared =         104.42 using 59 PHA bins.
# Reduced chi-squared =         1.8320 for     57 degrees of freedom
# Null hypothesis probability =   1.296958e-04

Energy  Fluence     90% Error
[keV]   [erg/cm2]   [erg/cm2]
15- 25  1.457e-08   2.285e-09
25- 50  4.390e-08   4.455e-09
50-150  3.446e-08   6.785e-09
15-150  9.294e-08   9.695e-09
Thermal bremsstrahlung (OTTB)
Spectral model: thermal bremsstrahlung
------------------------------------------------------------
Parameters  : value         Lower 90%    Upper 90%
kT [keV]    : 110.671       (-32.7546      55.5288)
Norm        : 8.40827       (-0.903732     1.15187)
------------------------------------------------------------
#Fit statistic : Chi-Squared =          51.46 using 59 PHA bins.
# Reduced chi-squared =         0.9028 for     57 degrees of freedom
# Null hypothesis probability =   6.820663e-01

Energy  Fluence     90% Error
[keV]   [erg/cm2]   [erg/cm2]
15- 25  2.196e-08   2.610e-09
25- 50  3.871e-08   4.430e-09
50-150  6.630e-08   2.353e-08
15-150  1.270e-07   2.839e-08
Double BB

Spectral model: bbodyrad<1> + bbodyrad<2>
------------------------------------------------------------
Parameters  : value         Lower 90%    Upper 90%
kT1 [keV]   : 5.44566        (-1.0629      1.27271)
R1^2/D10^2  : 6.65381        (-3.66285      9.63423)
kT2 [keV]   : 24.0448        (-5.02358      8.91281)
R2^2/D10^2  : 2.89311E-02    (-0.0190586   0.0393879)
------------------------------------------------------------
#Fit statistic : Chi-Squared =          47.17 using 59 PHA bins.
# Reduced chi-squared =         0.8575 for     55 degrees of freedom
# Null hypothesis probability =   7.646548e-01

Energy  Fluence     90% Error
[keV]   [erg/cm2]   [erg/cm2]
15- 25  2.547e-08   7.700e-09
25- 50  3.452e-08   7.610e-09
50-150  7.208e-08   2.825e-08
15-150  1.321e-07   3.880e-08
Pre-slew spectrum (Pre-slew PHA with pre-slew DRM)
Power-law model

Spectral model in power-law:
------------------------------------------------------------
Parameters  : value       lower 90%   higher 90%
Photon index: 2.13801     ( -0.0803492   0.0817394 )
Norm@50keV  : 3.57275E-03    ( -0.000163533   0.00016214 )
------------------------------------------------------------
#Fit statistic : Chi-Squared =          64.37 using 59 PHA bins.
# Reduced chi-squared =          1.129 for     57 degrees of freedom
# Null hypothesis probability =   2.343167e-01

Photon flux (15-150 keV)    in 62.6 sec: 0.572865 ( -0.0231704  0.0232639 ) ph/cm2/s
Energy fluence (15-150 keV)             : 2.08631e-06 ( -8.54434e-08  8.59323e-08 ) ergs/cm2
Cutoff power-law model
Spectral model in the cutoff power-law:
------------------------------------------------------------
Parameters  : value       lower 90%   higher 90%
Photon index: 1.76142     ( -0.342882   0.263224 )
Epeak [keV] : 28.0645      ( -23.2956 11.147 )
Norm@50keV  : 5.70596E-03    ( -0.00156933   0.00298277 )
------------------------------------------------------------
#Fit statistic : Chi-Squared =          60.18 using 59 PHA bins.
# Reduced chi-squared =          1.075 for     56 degrees of freedom
# Null hypothesis probability =   3.271527e-01

Photon flux (15-150 keV)    in 62.6 sec: 0.556424 ( -0.026596  0.02669 ) ph/cm2/s
Energy fluence (15-150 keV)             : 2.00383e-06 ( -1.07597e-07  1.08786e-07 ) ergs/cm2
Band function

Spectral model in the Band function:
------------------------------------------------------------
Parameters  : value       lower 90%   higher 90%
alpha       : -1.76138   ( -0.183437   0.315829 )
beta        : -10.0000    ( 10   5.32907e-15 )
Epeak [keV] : 28.0626      ( -14.9359 9.56084 )
Norm@50keV   : 5.70477E-03    ( -0.00155454   0.00298252 )
------------------------------------------------------------
#Fit statistic : Chi-Squared =          60.18 using 59 PHA bins.
# Reduced chi-squared =          1.094 for     55 degrees of freedom
# Null hypothesis probability =   2.939409e-01

Photon flux (15-150 keV)    in 62.6 sec: 0.559641 (    ) ph/cm2/s
Energy fluence (15-150 keV)             : 2.00097e-06 ( -2.00053e-06  -1.07478e-07 ) ergs/cm2
S(25-50 keV) vs. S(50-100 keV) plot
S(25-50 keV)  = 1.00e-06
S(50-100 keV) = 8.34e-07
T90 vs. Hardness ratio plot

T90                                   = 82.0200000107288 sec.
Hardness ratio (energy fluence ratio) = 0.834
Color vs. Color plot

Count Ratio  (25-50 keV) / (15-25 keV) = 0.857956
Count Ratio (50-100 keV) / (15-25 keV) = 0.384999
Mask shadow pattern
IMX = 3.172481208132875E-01, IMY = -1.653331985812935E-01
TIME vs. PHA plot around the trigger time
Blue+Cyan dotted lines: Time interval of the scaled map
From 0.000000 to 2.048000
TIME vs. DetID plot around the trigger time

Blue+Cyan dotted lines: Time interval of the scaled map
From 0.000000 to 2.048000
100 us light curve (15-350 keV)
Blue+Cyan dotted lines: Time interval of the scaled map
From 0.000000 to 2.048000
Spacecraft aspect plot

Bright source in the pre-burst/pre-slew/post-slew images
Pre-burst image of 15-350 keV band
Time interval of the image:
-239.072000 -35.172000

# RAcent  DECcent POSerr Theta    Phi  PeakCts   SNR AngSep     Name
#  [deg]    [deg]    ['] [deg]  [deg]                   [']
254.5693  35.4392  216.0  27.0    1.5  -0.0090  -0.1    8.0	Her X-1
278.3590  14.2679    2.8  56.9   -4.0   3.3071   4.0 ------	UNKNOWN
295.3121  56.3331    3.1  39.5  -60.1   1.4305   3.7 ------	UNKNOWN
313.8640  72.0748    3.0  40.9  -87.3   2.7546   3.8 ------	UNKNOWN
Pre-slew background subtracted image of 15-350 keV band
Time interval of the image:
-35.172000 27.428600

# RAcent  DECcent POSerr Theta    Phi  PeakCts   SNR AngSep     Name
#  [deg]    [deg]    ['] [deg]  [deg]                   [']
254.4516  35.3464   16.9  27.0    1.8  -0.0735  -0.7    0.4	Her X-1
239.2334  35.5174    0.3  19.7   27.5   4.2857  42.0 ------	UNKNOWN
Post-slew image of 15-350 keV band
Time interval of the image:
76.028590 963.009400

# RAcent  DECcent POSerr Theta    Phi  PeakCts   SNR AngSep     Name
#  [deg]    [deg]    ['] [deg]  [deg]                   [']
254.3081  35.3222    9.1  12.3  -58.8   0.4874   1.3    7.4	Her X-1
268.4075  -1.4195    2.8  45.9   -7.9   3.3298   4.1    3.1	SW J1753.5-0127
288.7681  10.9662    2.8  51.0  -39.1   9.0292   4.1    2.2	GRS 1915+105
173.6672  45.8942    3.0  49.4  158.2   5.4547   3.9 ------	UNKNOWN
194.6563  46.4026    3.0  34.9  157.0   2.6192   3.8 ------	UNKNOWN
Plot creation:
Sun May 31 04:34:39 EDT 2015