Special notes of this burst
Image
Pre-slew 15.0-350.0 keV image (Event data)
#   RAcent    DECcent   POSerr    Theta     Phi              Peak Cts       SNR   Name
   34.9932    -7.1461   0.0267    33.9036   -98.2825         0.0605495      7.224 TRIG_00349447

Foreground time interval of the image:
 -0.004   0.080 (delta_t =   0.084 [sec])
Background time interval of the image:
-239.460  -0.004 (delta_t = 239.456 [sec])
Lightcurves
Notes:
- 1) The mask-weighted light curves are using the flight position.
- 2) Multiple plots of different time binning/intervals are shown to cover all scenarios of short/long GRBs, rate/image triggers, and real/false positives.
- 3) For all the mask-weighted lightcurves, the y-axis units are counts/sec/det where a det is 0.4 x 0.4 = 0.16 sq cm.
- 4) The verticle lines correspond to following: green dotted lines are T50 interval, black dotted lines are T90 interval, blue solid line(s) is a spacecraft slew start time, and orange solid line(s) is a spacecraft slew end time.
- 5) Time of each bin is in the middle of the bin.
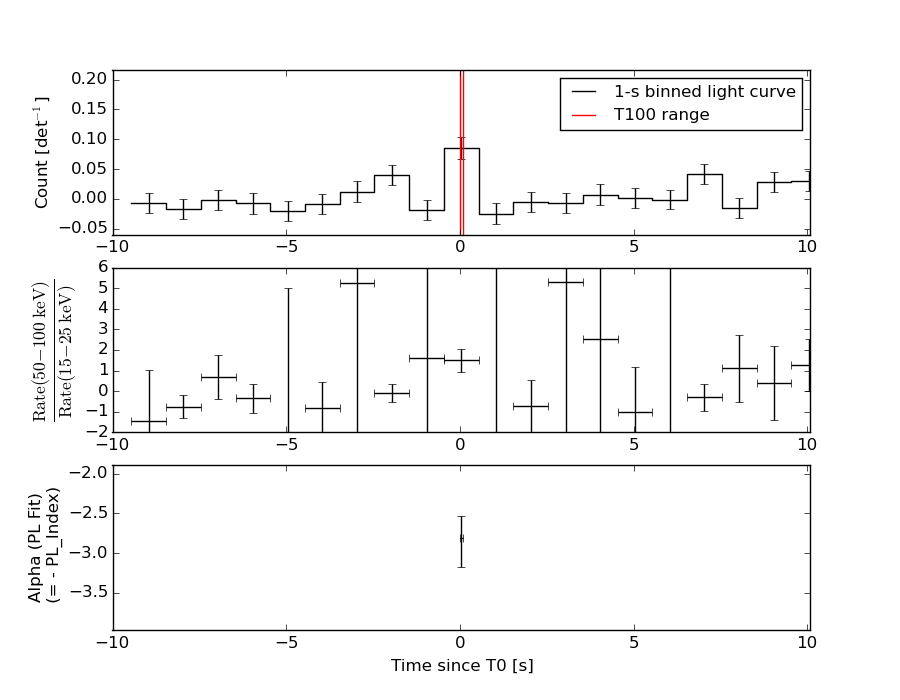
1 s binning
From T0-310 s to T0+310 s

From T100_start - 20 s to T100_end + 30 s

Full time interval

64 ms binning
Full time interval
From T100_start to T100_end
From T0-5 sec to T0+5 sec
16 ms binning
From T100_start-5 s to T100_start+5 s
Blue+Cyan dotted lines: Time interval of the scaled map
From 0.000000 to 0.064000
8 ms binning
From T100_start-3 s to T100_start+3 s

Blue+Cyan dotted lines: Time interval of the scaled map
From 0.000000 to 0.064000
2 ms binning
From T100_start-1 s to T100_start+1 s

Blue+Cyan dotted lines: Time interval of the scaled map
From 0.000000 to 0.064000
SN=5 or 10 sec. binning (whichever binning is satisfied first)

SN=5 or 10 sec. binning (T < 200 sec)

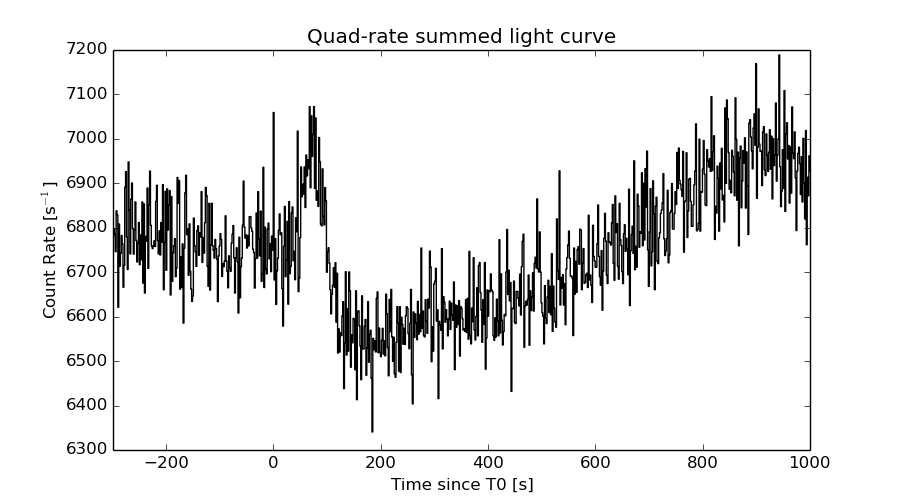
Quad-rate summed light curves (from T0-300s to T0+1000s)
Spectral Evolution
Spectra
Notes:
- 1) The fitting includes the systematic errors.
- 2) When the burst includes telescope slew time periods, the fitting uses an average response file made from multiple 5-s response files through out the slew time plus single time preiod for the non-slew times, and weighted by the total counts in the corresponding time period using addrmf. An average response file is needed becuase a spectral fit using the pre-slew DRM will introduce some errors in both a spectral shape and a normalization if the PHA file contains a lot of the slew/post-slew time interval.
- 3) For fits to more complicated models (e.g. a power-law over a cutoff power-law), the BAT team has decided to require a chi-square improvement of more than 6 for each extra dof.
Time averaged spectrum fit using the average DRM
Power-law model
Time interval is from   -0.004 sec. to    0.080 sec.

Spectral model in power-law:
------------------------------------------------------------
Parameters  : value       lower 90%   higher 90%
Photon index: 2.81195     ( -0.286027   0.359697 )
Norm@50keV  : 1.57426E-02    ( -0.00495657   0.00474087 )
------------------------------------------------------------
#Fit statistic : Chi-Squared =          71.35 using 59 PHA bins.
# Reduced chi-squared =          1.252 for     57 degrees of freedom
# Null hypothesis probability =   9.565205e-02

Photon flux (15-150 keV)    in 0.084 sec: 3.78991 ( -1.03195  1.03137 ) ph/cm2/s
Energy fluence (15-150 keV)             : 1.46635e-08 ( -3.92583e-09  3.92317e-09 ) ergs/cm2
Cutoff power-law model

Time interval is from   -0.004 sec. to    0.080 sec.
Spectral model in the cutoff power-law:
------------------------------------------------------------
Parameters  : value       lower 90%   higher 90%
Photon index: -0.386937     ( -1.51945   1.52813 )
Epeak [keV] : 42.7819      ( -16.0674 10.2574 )
Norm@50keV  : 0.716237    ( -0.715879   3.82658 )
------------------------------------------------------------
#Fit statistic : Chi-Squared =          59.51 using 59 PHA bins.
# Reduced chi-squared =          1.063 for     56 degrees of freedom
# Null hypothesis probability =   3.489917e-01

Photon flux (15-150 keV)    in 0.084 sec: 4.59244 ( -1.15358  1.14187 ) ph/cm2/s
Energy fluence (15-150 keV)             : 2.23227e-08 ( -5.41724e-09  5.42951e-09 ) ergs/cm2
Band function

Time interval is from   -0.004 sec. to    0.080 sec.

Spectral model in the Band function:
------------------------------------------------------------
Parameters  : value       lower 90%   higher 90%
alpha       : 0.397644   ( -2.34629   1.49103 )
beta        : -10.0000    ( 10   20 )
Epeak [keV] : 42.9154      ( -6.71562 10.0896 )
Norm@50keV   : 0.720529    ( -0.72055   3.83618 )
------------------------------------------------------------
#Fit statistic : Chi-Squared =          59.52 using 59 PHA bins.
# Reduced chi-squared =          1.082 for     55 degrees of freedom
# Null hypothesis probability =   3.147060e-01

Photon flux (15-150 keV)    in 0.084 sec:  (    ) ph/cm2/s
Energy fluence (15-150 keV)             : 0 ( 0  0 ) ergs/cm2
Single BB
Spectral model blackbody:
------------------------------------------------------------
Parameters  : value    Lower 90%  Upper 90%
kT [keV]    : 12.6492  (-1.74226  1.39995)
R^2/D10^2   : 1.05661  (-0.439875   0.822368)
(R is the radius in km and D10 is the distance to the source in units of 10 kpc)
------------------------------------------------------------
#Fit statistic : Chi-Squared =          60.19 using 59 PHA bins.
# Reduced chi-squared =          1.056 for     57 degrees of freedom
# Null hypothesis probability =   3.609848e-01

Energy  Fluence     90% Error
[keV]   [erg/cm2]   [erg/cm2]
15- 25  3.012e-09   9.975e-10
25- 50  1.007e-08   3.182e-09
50-150  1.002e-08   3.170e-09
15-150  2.309e-08   5.846e-09
Thermal bremsstrahlung (OTTB)
Spectral model: thermal bremsstrahlung
------------------------------------------------------------
Parameters  : value         Lower 90%    Upper 90%
kT [keV]    : 38.1487       (-8.98744      10.048)
Norm        : 31.2188       (-9.53867     11.1651)
------------------------------------------------------------
#Fit statistic : Chi-Squared =          63.06 using 59 PHA bins.
# Reduced chi-squared =          1.106 for     57 degrees of freedom
# Null hypothesis probability =   2.708255e-01

Energy  Fluence     90% Error
[keV]   [erg/cm2]   [erg/cm2]
15- 25  5.923e-09   1.828e-09
25- 50  7.631e-09   1.846e-09
50-150  5.601e-09   2.152e-09
15-150  1.916e-08   4.729e-09
Double BB

Spectral model: bbodyrad<1> + bbodyrad<2>
------------------------------------------------------------
Parameters  : value         Lower 90%    Upper 90%
kT1 [keV]   : 3.83980        (-3.64547      3.67464)
R1^2/D10^2  : 45.2189        (-44.3319      -45.7446)
kT2 [keV]   : 13.4017        (-1.7583      1.90815)
R2^2/D10^2  : 0.706054    (-0.424239   0.520116)
------------------------------------------------------------
#Fit statistic : Chi-Squared =          56.61 using 59 PHA bins.
# Reduced chi-squared =          1.029 for     55 degrees of freedom
# Null hypothesis probability =   4.146709e-01

Energy  Fluence     90% Error
[keV]   [erg/cm2]   [erg/cm2]
15- 25  5.081e-09   2.574e-09
25- 50  8.935e-09   4.761e-09
50-150  9.285e-09   4.957e-09
15-150  2.330e-08   1.151e-08
Peak spectrum fit
Power-law model

Time interval is from   -0.460 sec. to    0.540 sec.

Spectral model in power-law:
------------------------------------------------------------
Parameters  : value       lower 90%   higher 90%
Photon index: 1.44491     ( -0.604344   0.655158 )
Norm@50keV  : 6.03281E-03    ( -0.00198196   0.00190634 )
------------------------------------------------------------
#Fit statistic : Chi-Squared =          54.27 using 59 PHA bins.
# Reduced chi-squared =         0.9521 for     57 degrees of freedom
# Null hypothesis probability =   5.780794e-01

Photon flux (15-150 keV)    in 1 sec: 0.742546 ( -0.237386  0.23789 ) ph/cm2/s
Energy fluence (15-150 keV)             : 5.7784e-08 ( -2.05145e-08  2.07454e-08 ) ergs/cm2
Cutoff power-law model

Time interval is from   -0.460 sec. to    0.540 sec.
Spectral model in the cutoff power-law:
------------------------------------------------------------
Parameters  : value       lower 90%   higher 90%
Photon index: 1.46213     ( -1.43262   0.645408 )
Epeak [keV] : 9999.36      ( -9999.36 -9999.36 )
Norm@50keV  : 6.00486E-03    ( -0.00604307   0.0256364 )
------------------------------------------------------------
#Fit statistic : Chi-Squared =          54.28 using 59 PHA bins.
# Reduced chi-squared =         0.9692 for     56 degrees of freedom
# Null hypothesis probability =   5.403054e-01

Photon flux (15-150 keV)    in 1 sec: 0.745607 ( -0.241347  0.2348 ) ph/cm2/s
Energy fluence (15-150 keV)             : 5.7778e-08 ( -2.05015e-08  2.06353e-08 ) ergs/cm2
Band function

Time interval is from   -0.460 sec. to    0.540 sec.

Spectral model in the Band function:
------------------------------------------------------------
Parameters  : value       lower 90%   higher 90%
alpha       : -4.19930   ( 4.21347   4.1993 )
beta        : -1.44487    ( -0.656081   0.604316 )
Epeak [keV] : 120.980      ( -120.98 -120.98 )
Norm@50keV   : 0.819948    ( -0.269451   0.2591 )
------------------------------------------------------------
#Fit statistic : Chi-Squared =          54.27 using 59 PHA bins.
# Reduced chi-squared =         0.9868 for     55 degrees of freedom
# Null hypothesis probability =   5.024186e-01

Photon flux (15-150 keV)    in 1 sec:  (    ) ph/cm2/s
Energy fluence (15-150 keV)             : 0 ( 0  0 ) ergs/cm2
Single BB
Spectral model blackbody:
------------------------------------------------------------
Parameters  : value    Lower 90%  Upper 90%
kT [keV]    : 23.2921  (  )
R^2/D10^2   : 1.97024E-02  (-0.0196983   0.047738)
(R is the radius in km and D10 is the distance to the source in units of 10 kpc)
------------------------------------------------------------
#Fit statistic : Chi-Squared =          57.82 using 59 PHA bins.
# Reduced chi-squared =          1.014 for     57 degrees of freedom
# Null hypothesis probability =   4.449655e-01

Energy  Fluence     90% Error
[keV]   [erg/cm2]   [erg/cm2]
15- 25  1.002e-08   6.335e-09
25- 50  9.787e-09   6.640e-09
50-150  8.619e-10   7.750e-10
15-150  2.067e-08   1.328e-08
Thermal bremsstrahlung (OTTB)

Spectral model: thermal bremsstrahlung
------------------------------------------------------------
Parameters  : value         Lower 90%    Upper 90%
kT [keV]    : 199.363       (-199.363      -199.363)
Norm        : 3.03694       (-0.953062     0.953081)
------------------------------------------------------------
#Fit statistic : Chi-Squared =          54.83 using 59 PHA bins.
# Reduced chi-squared =         0.9618 for     57 degrees of freedom
# Null hypothesis probability =   5.571134e-01

Energy  Fluence     90% Error
[keV]   [erg/cm2]   [erg/cm2]
15- 25  7.562e-09   4.708e-09
25- 50  1.455e-08   8.960e-09
50-150  3.190e-08   1.960e-08
15-150  5.401e-08   3.281e-08
Double BB
Spectral model: bbodyrad<1> + bbodyrad<2>
------------------------------------------------------------
Parameters  : value         Lower 90%    Upper 90%
kT1 [keV]   : 4.16910        (-1.72864      2.39909)
R1^2/D10^2  : 7.98486        (-7.11194      131.149)
kT2 [keV]   : 29.0569        (-9.49727      24.624)
R2^2/D10^2  : 8.64318E-03    (-0.00715513   0.0220789)
------------------------------------------------------------
#Fit statistic : Chi-Squared =          49.99 using 59 PHA bins.
# Reduced chi-squared =         0.9089 for     55 degrees of freedom
# Null hypothesis probability =   6.660387e-01

Energy  Fluence     90% Error
[keV]   [erg/cm2]   [erg/cm2]
15- 25  1.001e-08   6.180e-09
25- 50  1.067e-08   5.705e-09
50-150  4.281e-08   2.681e-08
15-150  6.349e-08   3.507e-08
Pre-slew spectrum (Pre-slew PHA with pre-slew DRM)
Power-law model
Spectral model in power-law:
------------------------------------------------------------
Parameters  : value       lower 90%   higher 90%
Photon index: 2.81195     ( -0.286027   0.359697 )
Norm@50keV  : 1.57426E-02    ( -0.00495657   0.00474087 )
------------------------------------------------------------
#Fit statistic : Chi-Squared =          71.35 using 59 PHA bins.
# Reduced chi-squared =          1.252 for     57 degrees of freedom
# Null hypothesis probability =   9.565205e-02

Photon flux (15-150 keV)    in 0.084 sec: 3.78991 ( -1.03195  1.03137 ) ph/cm2/s
Energy fluence (15-150 keV)             : 1.46635e-08 ( -3.92583e-09  3.92317e-09 ) ergs/cm2
Cutoff power-law model
Spectral model in the cutoff power-law:
------------------------------------------------------------
Parameters  : value       lower 90%   higher 90%
Photon index: -0.386937     ( -1.51945   1.52813 )
Epeak [keV] : 42.7819      ( -16.0674 10.2574 )
Norm@50keV  : 0.716237    ( -0.715879   3.82658 )
------------------------------------------------------------
#Fit statistic : Chi-Squared =          59.51 using 59 PHA bins.
# Reduced chi-squared =          1.063 for     56 degrees of freedom
# Null hypothesis probability =   3.489917e-01

Photon flux (15-150 keV)    in 0.084 sec: 4.59244 ( -1.15358  1.14187 ) ph/cm2/s
Energy fluence (15-150 keV)             : 2.23227e-08 ( -5.41724e-09  5.42951e-09 ) ergs/cm2
Band function

Spectral model in the Band function:
------------------------------------------------------------
Parameters  : value       lower 90%   higher 90%
alpha       : 0.397644   ( -2.34629   1.49103 )
beta        : -10.0000    ( 10   5.32907e-15 )
Epeak [keV] : 42.9154      ( -6.71562 10.0896 )
Norm@50keV   : 0.720529    ( -0.72055   3.83618 )
------------------------------------------------------------
#Fit statistic : Chi-Squared =          59.52 using 59 PHA bins.
# Reduced chi-squared =          1.082 for     55 degrees of freedom
# Null hypothesis probability =   3.147060e-01

Photon flux (15-150 keV)    in 0.084 sec:  (    ) ph/cm2/s
Energy fluence (15-150 keV)             : 0 ( 0  0 ) ergs/cm2
S(25-50 keV) vs. S(50-100 keV) plot

S(25-50 keV)  = 4.93e-09
S(50-100 keV) = 2.81e-09
T90 vs. Hardness ratio plot
T90                                   = 0.0679999887943268 sec.
Hardness ratio (energy fluence ratio) = 0.56998
Color vs. Color plot
Count Ratio  (25-50 keV) / (15-25 keV) = 1.49749
Count Ratio (50-100 keV) / (15-25 keV) = 1.926
Mask shadow pattern
IMX = -9.681319995077575E-02, IMY = 6.650541571305872E-01
TIME vs. PHA plot around the trigger time

Blue+Cyan dotted lines: Time interval of the scaled map
From 0.000000 to 0.064000
TIME vs. DetID plot around the trigger time

Blue+Cyan dotted lines: Time interval of the scaled map
From 0.000000 to 0.064000
100 us light curve (15-350 keV)

Blue+Cyan dotted lines: Time interval of the scaled map
From 0.000000 to 0.064000
Spacecraft aspect plot

Bright source in the pre-burst/pre-slew/post-slew images
Pre-burst image of 15-350 keV band
Time interval of the image:
-239.460000 -0.004000

# RAcent  DECcent POSerr Theta    Phi  PeakCts   SNR AngSep     Name
#  [deg]    [deg]    ['] [deg]  [deg]                   [']
 83.6346  22.0256    0.3  37.5    8.4   9.4631  36.1    0.7	Crab
 80.4760 -61.4824    2.6  49.6  158.6   2.9173   4.5 ------	UNKNOWN
Pre-slew background subtracted image of 15-350 keV band
Time interval of the image:
-0.004000 0.080000

# RAcent  DECcent POSerr Theta    Phi  PeakCts   SNR AngSep     Name
#  [deg]    [deg]    ['] [deg]  [deg]                   [']
 83.7281  21.9945    4.5  37.5    8.5   0.0128   2.5    5.4	Crab
 99.3549  12.1759    2.4  39.0   37.5   0.0320   4.9 ------	UNKNOWN
 55.2775 -50.7497    2.1  39.8  179.3   0.0277   5.6 ------	UNKNOWN
 47.3758  15.4479    2.1  35.3  -52.2   0.0318   5.5 ------	UNKNOWN
 34.9933  -7.1461    1.6  33.9  -98.3   0.0604   7.2 ------	UNKNOWN
 30.0958   0.7846    2.8  40.8  -88.0   0.0701   4.1 ------	UNKNOWN
Post-slew image of 15-350 keV band
Time interval of the image:
172.440600 933.340600

# RAcent  DECcent POSerr Theta    Phi  PeakCts   SNR AngSep     Name
#  [deg]    [deg]    ['] [deg]  [deg]                   [']
189.5234  -2.6594    2.3  33.9   85.3   4.4988   5.1 ------	UNKNOWN
128.6642 -12.5358    2.6  44.2 -168.3   2.9386   4.5 ------	UNKNOWN
185.7659  63.9561    3.1  49.5  -24.5   3.1819   3.8 ------	UNKNOWN
Plot creation:
Sun May 31 04:28:49 EDT 2015