Special notes of this burst
Image
Pre-slew 15.0-350.0 keV image (Event data)
#RAcent DECcent POSerr Theta  Phi  Peak_Cts  SNR Name
209.706 47.001 0.000 18.903 18.099 3.995 12.617 TRIG_00349450

Image time interval: -239.000 to 336.000 [sec]
Lightcurves
Notes:
- 1) The mask-weighted light curves are using the flight position.
- 2) Multiple plots of different time binning/intervals are shown to cover all scenarios of short/long GRBs, rate/image triggers, and real/false positives.
- 3) For all the mask-weighted lightcurves, the y-axis units are counts/sec/det where a det is 0.4 x 0.4 = 0.16 sq cm.
- 4) The verticle lines correspond to following: green dotted lines are T50 interval, black dotted lines are T90 interval, blue solid line(s) is a spacecraft slew start time, and orange solid line(s) is a spacecraft slew end time.
- 5) Time of each bin is in the middle of the bin.
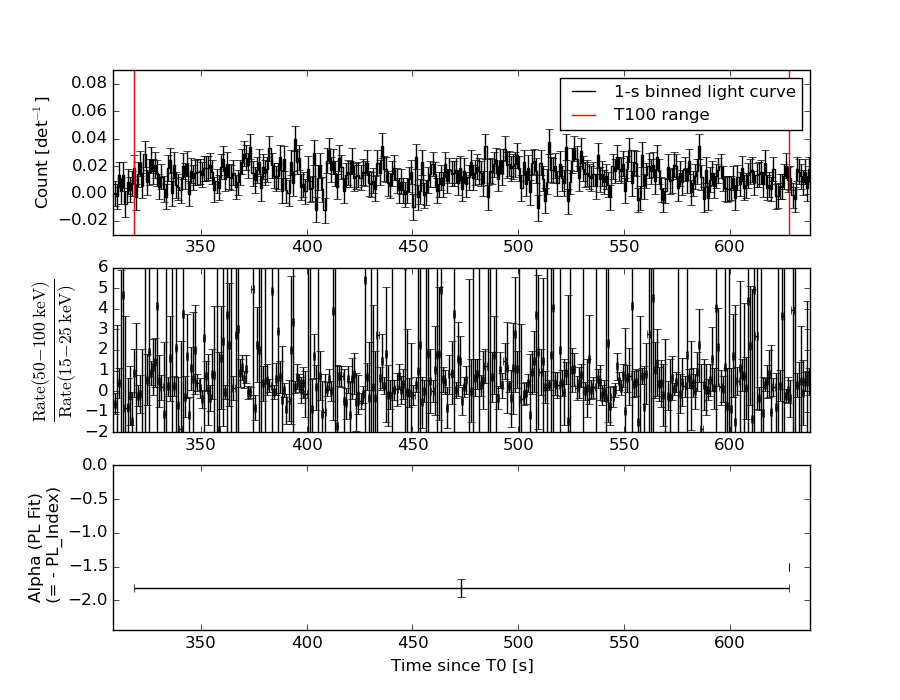
1 s binning
From T0-310 s to T0+310 s
From T100_start - 20 s to T100_end + 30 s
Full time interval

64 ms binning
Full time interval
From T100_start to T100_end

From T0-5 sec to T0+5 sec
16 ms binning
From T100_start-5 s to T100_start+5 s

8 ms binning
From T100_start-3 s to T100_start+3 s

2 ms binning
From T100_start-1 s to T100_start+1 s

SN=5 or 10 sec. binning (whichever binning is satisfied first)
SN=5 or 10 sec. binning (T < 200 sec)

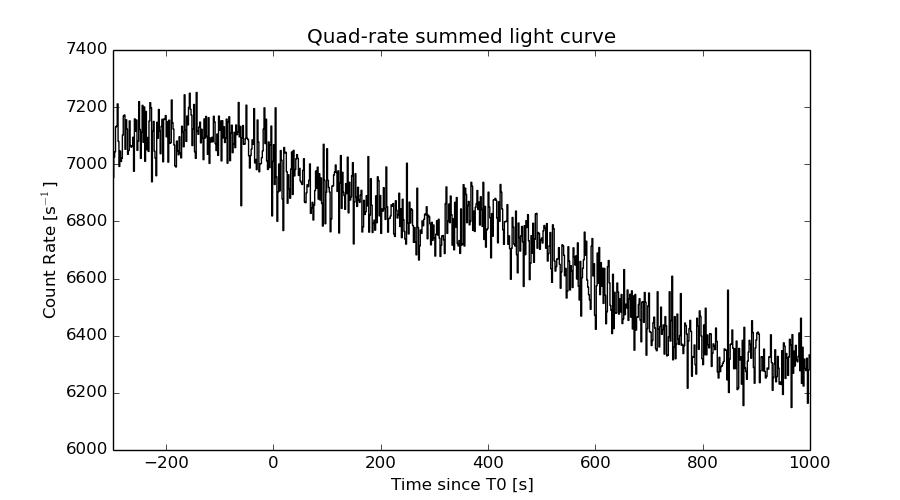
Quad-rate summed light curves (from T0-300s to T0+1000s)
Spectral Evolution
Spectra
Notes:
- 1) The fitting includes the systematic errors.
- 2) When the burst includes telescope slew time periods, the fitting uses an average response file made from multiple 5-s response files through out the slew time plus single time preiod for the non-slew times, and weighted by the total counts in the corresponding time period using addrmf. An average response file is needed becuase a spectral fit using the pre-slew DRM will introduce some errors in both a spectral shape and a normalization if the PHA file contains a lot of the slew/post-slew time interval.
- 3) For fits to more complicated models (e.g. a power-law over a cutoff power-law), the BAT team has decided to require a chi-square improvement of more than 6 for each extra dof.
Time averaged spectrum fit using the average DRM
Power-law model
Time interval is from  318.376 sec. to  627.744 sec.

Spectral model in power-law:
------------------------------------------------------------
Parameters  : value       lower 90%   higher 90%
Photon index: 1.81356     ( -0.1341   0.137419 )
Norm@50keV  : 7.66940E-04    ( -5.98188e-05   5.87748e-05 )
------------------------------------------------------------
#Fit statistic : Chi-Squared =          60.81 using 59 PHA bins.
# Reduced chi-squared =          1.067 for     57 degrees of freedom
# Null hypothesis probability =   3.404404e-01

Photon flux (15-150 keV)    in 309.4 sec: 0.106243 ( -0.00711587  0.0071296 ) ph/cm2/s
Energy fluence (15-150 keV)             : 2.18355e-06 ( -1.72245e-07  1.74529e-07 ) ergs/cm2
Cutoff power-law model

Time interval is from  318.376 sec. to  627.744 sec.
Spectral model in the cutoff power-law:
------------------------------------------------------------
Parameters  : value       lower 90%   higher 90%
Photon index: 2.52388     ( -0.140361   0.135232 )
Epeak [keV] : 179.780      ( -9999.35 -9999.36 )
Norm@50keV  : 3.57902E-04    (     )
------------------------------------------------------------
#Fit statistic : Chi-Squared =          59.56 using 59 PHA bins.
# Reduced chi-squared =          1.064 for     56 degrees of freedom
# Null hypothesis probability =   3.474051e-01

Photon flux (15-150 keV)    in 309.4 sec: 0.106388 ( -0.0073748  0.006997 ) ph/cm2/s
Energy fluence (15-150 keV)             : 2.18501e-06 ( -1.73524e-07  1.65192e-07 ) ergs/cm2
Band function
Time interval is from  318.376 sec. to  627.744 sec.

Spectral model in the Band function:
------------------------------------------------------------
Parameters  : value       lower 90%   higher 90%
alpha       : -1.43161   ( 1.44847   1.44847 )
beta        : -1.81297    ( -0.137464   0.134012 )
Epeak [keV] : 21.2047      ( -18.229 -18.229 )
Norm@50keV   : 1.81384E-03    ( -0.000880528   0.0624402 )
------------------------------------------------------------
#Fit statistic : Chi-Squared =          60.81 using 59 PHA bins.
# Reduced chi-squared =          1.106 for     55 degrees of freedom
# Null hypothesis probability =   2.746753e-01

Photon flux (15-150 keV)    in 309.4 sec:  (    ) ph/cm2/s
Energy fluence (15-150 keV)             : 0 ( 0  0 ) ergs/cm2
Single BB
Spectral model blackbody:
------------------------------------------------------------
Parameters  : value    Lower 90%  Upper 90%
kT [keV]    : 11.1876  (  )
R^2/D10^2   : 3.05806E-02  (   )
(R is the radius in km and D10 is the distance to the source in units of 10 kpc)
------------------------------------------------------------
#Fit statistic : Chi-Squared =         149.76 using 59 PHA bins.
# Reduced chi-squared =         2.6273 for     57 degrees of freedom
# Null hypothesis probability =   2.889383e-10

Energy  Fluence     90% Error
[keV]   [erg/cm2]   [erg/cm2]
15- 25  2.482e-07   2.879e-08
25- 50  7.172e-07   5.585e-08
50-150  5.136e-07   8.601e-08
15-150  1.479e-06   1.170e-07
Thermal bremsstrahlung (OTTB)

Spectral model: thermal bremsstrahlung
------------------------------------------------------------
Parameters  : value         Lower 90%    Upper 90%
kT [keV]    : 104.805       (-25.6942      51.3794)
Norm        : 0.457705       (-0.0449392     0.0476818)
------------------------------------------------------------
#Fit statistic : Chi-Squared =          69.63 using 59 PHA bins.
# Reduced chi-squared =          1.222 for     57 degrees of freedom
# Null hypothesis probability =   1.216683e-01

Energy  Fluence     90% Error
[keV]   [erg/cm2]   [erg/cm2]
15- 25  3.701e-07   3.960e-08
25- 50  6.459e-07   5.090e-08
50-150  1.074e-06   3.431e-07
15-150  2.090e-06   3.923e-07
Double BB
Spectral model: bbodyrad<1> + bbodyrad<2>
------------------------------------------------------------
Parameters  : value         Lower 90%    Upper 90%
kT1 [keV]   : 5.63662        (-0.847806      0.951413)
R1^2/D10^2  : 0.322029        (-0.14664      0.307806)
kT2 [keV]   : 26.3581        (-5.04939      8.30614)
R2^2/D10^2  : 1.14690E-03    (-0.000671016   0.00125502)
------------------------------------------------------------
#Fit statistic : Chi-Squared =          59.16 using 59 PHA bins.
# Reduced chi-squared =          1.076 for     55 degrees of freedom
# Null hypothesis probability =   3.262227e-01

Energy  Fluence     90% Error
[keV]   [erg/cm2]   [erg/cm2]
15- 25  4.240e-07   8.908e-08
25- 50  5.741e-07   1.027e-07
50-150  1.260e-06   3.679e-07
15-150  2.258e-06   5.165e-07
Peak spectrum fit
Power-law model

Time interval is from  409.700 sec. to  410.700 sec.

Spectral model in power-law:
------------------------------------------------------------
Parameters  : value       lower 90%   higher 90%
Photon index: 1.98042     ( -0.722189   0.809983 )
Norm@50keV  : 1.97128E-03    ( -0.00102612   0.000995049 )
------------------------------------------------------------
#Fit statistic : Chi-Squared =          72.69 using 59 PHA bins.
# Reduced chi-squared =          1.275 for     57 degrees of freedom
# Null hypothesis probability =   7.863088e-02

Photon flux (15-150 keV)    in 1 sec: 0.293061 ( -0.110276  0.110401 ) ph/cm2/s
Energy fluence (15-150 keV)             : 1.81615e-08 ( -8.37396e-09  9.56668e-09 ) ergs/cm2
Cutoff power-law model

Time interval is from  409.700 sec. to  410.700 sec.
Spectral model in the cutoff power-law:
------------------------------------------------------------
Parameters  : value       lower 90%   higher 90%
Photon index: -5.02724     (     )
Epeak [keV] : 25.8275      ( -4.46184 5.3358 )
Norm@50keV  : 367.880    (     )
------------------------------------------------------------
#Fit statistic : Chi-Squared =          66.86 using 59 PHA bins.
# Reduced chi-squared =          1.194 for     56 degrees of freedom
# Null hypothesis probability =   1.517703e-01

Photon flux (15-150 keV)    in 1 sec: 0.292142 0.291086 (    ) ph/cm2/s
Energy fluence (15-150 keV)             : 2.10558e-16 ( 0  0 ) ergs/cm2
Band function
Time interval is from  409.700 sec. to  410.700 sec.

Spectral model in the Band function:
------------------------------------------------------------
Parameters  : value       lower 90%   higher 90%
alpha       : 5.00000   ( -3.21109   -5 )
beta        : -7.06107    ( 6.92171   4.5275 )
Epeak [keV] : 25.8730      ( -4.0882 4.63199 )
Norm@50keV   : 381.291    ( -125.202   866.32 )
------------------------------------------------------------
#Fit statistic : Chi-Squared =          66.59 using 59 PHA bins.
# Reduced chi-squared =          1.211 for     55 degrees of freedom
# Null hypothesis probability =   1.359468e-01

Photon flux (15-150 keV)    in 1 sec:  (    ) ph/cm2/s
Energy fluence (15-150 keV)             : 0 ( 0  0 ) ergs/cm2
Single BB

Spectral model blackbody:
------------------------------------------------------------
Parameters  : value    Lower 90%  Upper 90%
kT [keV]    : 6.31266  (-1.44606  2.00804)
R^2/D10^2   : 0.901837  (-0.895224   1.68728)
(R is the radius in km and D10 is the distance to the source in units of 10 kpc)
------------------------------------------------------------
#Fit statistic : Chi-Squared =          69.90 using 59 PHA bins.
# Reduced chi-squared =          1.226 for     57 degrees of freedom
# Null hypothesis probability =   1.172642e-01

Energy  Fluence     90% Error
[keV]   [erg/cm2]   [erg/cm2]
15- 25  5.118e-09   3.154e-09
25- 50  5.690e-09   3.782e-09
50-150  6.388e-10   5.770e-10
15-150  1.145e-08   7.570e-09
Thermal bremsstrahlung (OTTB)
Spectral model: thermal bremsstrahlung
------------------------------------------------------------
Parameters  : value         Lower 90%    Upper 90%
kT [keV]    : 41.2406       (-25.9865      -41.1887)
Norm        : 1.82809       (-1.00715     2.59581)
------------------------------------------------------------
#Fit statistic : Chi-Squared =          72.95 using 59 PHA bins.
# Reduced chi-squared =          1.280 for     57 degrees of freedom
# Null hypothesis probability =   7.568865e-02

Energy  Fluence     90% Error
[keV]   [erg/cm2]   [erg/cm2]
15- 25  4.240e-09   2.680e-09
25- 50  5.652e-09   3.732e-09
50-150  4.520e-09   3.797e-09
15-150  1.441e-08   9.660e-09
Double BB
R1^2/D10^2  : 4.84804E-05        (-3.85965e-05      0.00246318)
kT2 [keV]   : 6.03483        (-1.36269      1.73752)
R2^2/D10^2  : 1.02828    (-0.707938   1.99421)
------------------------------------------------------------
#Fit statistic : Chi-Squared =          69.90 using 59 PHA bins.
#Fit statistic : Chi-Squared =          65.77 using 59 PHA bins.
#Fit statistic : Chi-Squared =          65.73 using 59 PHA bins.
# Reduced chi-squared =          1.271 for     55 degrees of freedom
# Reduced chi-squared =          1.196 for     55 degrees of freedom
# Reduced chi-squared =          1.195 for     55 degrees of freedom
# Null hypothesis probability =   8.503706e-02
# Null hypothesis probability =   1.517506e-01
# Null hypothesis probability =   1.524276e-01

Energy  Fluence     90% Error
[keV]   [erg/cm2]   [erg/cm2]
15- 25  5.097e-09   3.070e-03
25- 50  5.761e-09   3.052e-02
50-150  6.687e-10   7.325e-01
15-150  1.153e-08   6.965e-01
Pre-slew spectrum (Pre-slew PHA with pre-slew DRM)
Power-law model

Spectral model in power-law:
------------------------------------------------------------
Parameters  : value       lower 90%   higher 90%
Photon index: 1.93293     ( -0.530287   0.63337 )
Norm@50keV  : 7.86595E-04    ( -0.000295944   0.000263847 )
------------------------------------------------------------
#Fit statistic : Chi-Squared =          64.15 using 59 PHA bins.
# Reduced chi-squared =          1.125 for     57 degrees of freedom
# Null hypothesis probability =   2.402196e-01

Photon flux (15-150 keV)    in 17.72 sec: 0.114496 ( -0.0282146  0.0282156 ) ph/cm2/s
Energy fluence (15-150 keV)             : 1.28201e-07 ( -4.23515e-08  4.53035e-08 ) ergs/cm2
Cutoff power-law model

Spectral model in the cutoff power-law:
------------------------------------------------------------
Parameters  : value       lower 90%   higher 90%
Photon index: 2.92138     ( -1.54574   7.10543e-15 )
Epeak [keV] : 280.693      (   )
Norm@50keV  : 2.54592E-04    (     )
------------------------------------------------------------
#Fit statistic : Chi-Squared =          61.51 using 59 PHA bins.
# Reduced chi-squared =          1.098 for     56 degrees of freedom
# Null hypothesis probability =   2.853775e-01

Photon flux (15-150 keV)    in 17.72 sec: 0.114405 ( -0.0281759  0.028167 ) ph/cm2/s
Energy fluence (15-150 keV)             : 1.2697e-07 ( -4.10512e-08  2.41584e-08 ) ergs/cm2
Band function
Spectral model in the Band function:
------------------------------------------------------------
Parameters  : value       lower 90%   higher 90%
alpha       : -1.60066   ( 1.60071   1.60071 )
beta        : -1.93294    ( 1.93311   0.53023 )
Epeak [keV] : 11.3778      ( -11.375 -11.375 )
Norm@50keV   : 1.90639E-03    ( -0.00190666   0.0409848 )
------------------------------------------------------------
#Fit statistic : Chi-Squared =          64.15 using 59 PHA bins.
# Reduced chi-squared =          1.166 for     55 degrees of freedom
# Null hypothesis probability =   1.864053e-01

Photon flux (15-150 keV)    in 17.72 sec:  (    ) ph/cm2/s
Energy fluence (15-150 keV)             : 0 ( 0  0 ) ergs/cm2
S(25-50 keV) vs. S(50-100 keV) plot

S(25-50 keV)  = 6.18e-07
S(50-100 keV) = 7.03e-07
T90 vs. Hardness ratio plot

T90                                   = 266.940000027418 sec.
Hardness ratio (energy fluence ratio) = 1.13754
Color vs. Color plot
Count Ratio  (25-50 keV) / (15-25 keV) = 0.989203
Count Ratio (50-100 keV) / (15-25 keV) = 0.715677
Mask shadow pattern

IMX = 0.325497189204, IMY = -0.10638003043
TIME vs. PHA plot around the trigger time
TIME vs. DetID plot around the trigger time
100 us light curve (15-350 keV)

Spacecraft aspect plot

Bright source in the pre-burst/pre-slew/post-slew images
Pre-burst image of 15-350 keV band
Time interval of the image:
-239.000000 318.376000

# RAcent  DECcent POSerr Theta    Phi  PeakCts   SNR AngSep     Name
#  [deg]    [deg]    ['] [deg]  [deg]                   [']
254.4731  35.4002    4.7  53.3    5.0   2.8492   2.5    3.5	Her X-1
209.6969  47.0072    1.0  18.9   18.1   3.7318  12.1 ------	UNKNOWN
215.8100  55.3435    2.8  21.1   -8.2   1.3152   4.2 ------	UNKNOWN
111.7201  31.4564    3.2  53.7 -154.4   3.6750   3.6 ------	UNKNOWN
294.8754  75.1889    3.4  47.0  -53.0   6.0351   3.4 ------	UNKNOWN
Pre-slew background subtracted image of 15-350 keV band
Time interval of the image:
318.376000 336.100590

# RAcent  DECcent POSerr Theta    Phi  PeakCts   SNR AngSep     Name
#  [deg]    [deg]    ['] [deg]  [deg]                   [']
254.4949  35.2991    3.8  53.4    5.0   0.5001   3.1    3.2	Her X-1
275.5954  88.9970    1.9  39.5  -70.1   0.6801   6.1 ------	UNKNOWN
Post-slew image of 15-350 keV band
Time interval of the image:
376.100590 963.095200

# RAcent  DECcent POSerr Theta    Phi  PeakCts   SNR AngSep     Name
#  [deg]    [deg]    ['] [deg]  [deg]                   [']
254.4220  35.3145    1.2  35.1   -1.4   4.2340   9.3    2.4	Her X-1
158.6473  34.1156    2.7  40.1  175.8   1.9586   4.3 ------	UNKNOWN
209.6975  47.0107    0.7   0.0 -156.4   5.0072  16.3 ------	UNKNOWN
136.9516  30.0991    3.2  57.2 -173.8   5.4999   3.6 ------	UNKNOWN
252.9744  51.2439    2.9  28.2  -29.2   1.3404   3.9 ------	UNKNOWN
128.1843  35.8053    3.5  59.4 -163.2   9.1257   3.3 ------	UNKNOWN
Plot creation:
Wed Nov 25 14:46:13 EST 2015