Special notes of this burst
Image
Pre-slew 15.0-350.0 keV image (Event data)
#   RAcent    DECcent   POSerr    Theta     Phi              Peak Cts       SNR   Name
  148.8895    18.1660   0.0069    25.0329  -172.0965         1.1413986     27.872 TRIG_00350184

Foreground time interval of the image:
 -0.668  10.669 (delta_t =  11.337 [sec])
Background time interval of the image:
-30.331  -0.668 (delta_t =  29.663 [sec])
Lightcurves
Notes:
- 1) The mask-weighted light curves are using the flight position.
- 2) Multiple plots of different time binning/intervals are shown to cover all scenarios of short/long GRBs, rate/image triggers, and real/false positives.
- 3) For all the mask-weighted lightcurves, the y-axis units are counts/sec/det where a det is 0.4 x 0.4 = 0.16 sq cm.
- 4) The verticle lines correspond to following: green dotted lines are T50 interval, black dotted lines are T90 interval, blue solid line(s) is a spacecraft slew start time, and orange solid line(s) is a spacecraft slew end time.
- 5) Time of each bin is in the middle of the bin.
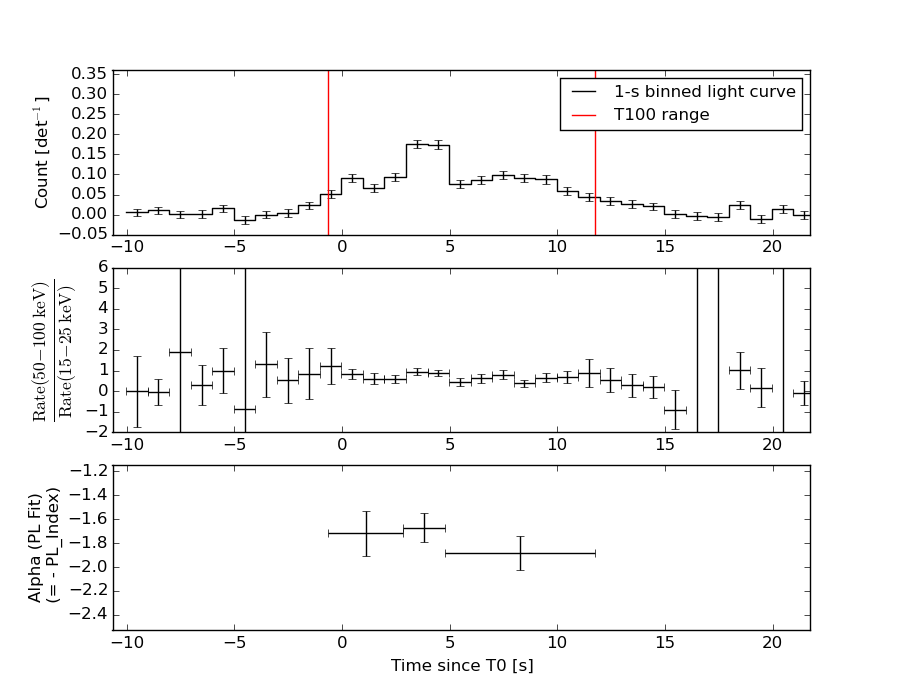
1 s binning
From T0-310 s to T0+310 s
From T100_start - 20 s to T100_end + 30 s
Full time interval
64 ms binning
Full time interval
From T100_start to T100_end
From T0-5 sec to T0+5 sec
16 ms binning
From T100_start-5 s to T100_start+5 s
Blue+Cyan dotted lines: Time interval of the scaled map
From 0.000000 to 1.024000
8 ms binning
From T100_start-3 s to T100_start+3 s
Blue+Cyan dotted lines: Time interval of the scaled map
From 0.000000 to 1.024000
2 ms binning
From T100_start-1 s to T100_start+1 s
Blue+Cyan dotted lines: Time interval of the scaled map
From 0.000000 to 1.024000
SN=5 or 10 sec. binning (whichever binning is satisfied first)
SN=5 or 10 sec. binning (T < 200 sec)
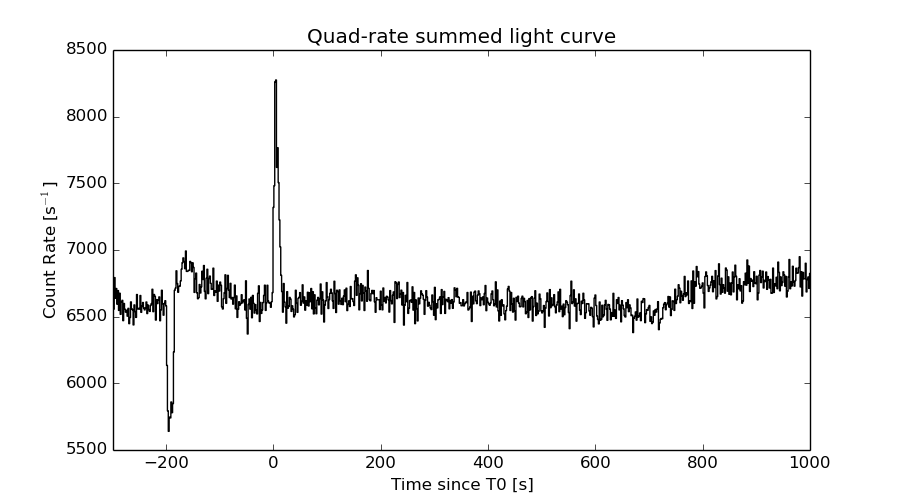
Quad-rate summed light curves (from T0-300s to T0+1000s)
Spectral Evolution
Spectra
Notes:
- 1) The fitting includes the systematic errors.
- 2) When the burst includes telescope slew time periods, the fitting uses an average response file made from multiple 5-s response files through out the slew time plus single time preiod for the non-slew times, and weighted by the total counts in the corresponding time period using addrmf. An average response file is needed becuase a spectral fit using the pre-slew DRM will introduce some errors in both a spectral shape and a normalization if the PHA file contains a lot of the slew/post-slew time interval.
- 3) For fits to more complicated models (e.g. a power-law over a cutoff power-law), the BAT team has decided to require a chi-square improvement of more than 6 for each extra dof.
Time averaged spectrum fit using the average DRM
Power-law model
Time interval is from   -0.668 sec. to   11.740 sec.

Spectral model in power-law:
------------------------------------------------------------
Parameters  : value       lower 90%   higher 90%
Photon index: 1.80835     ( -0.0913861   0.0928842 )
Norm@50keV  : 6.00078E-03    ( -0.000344025   0.000341766 )
------------------------------------------------------------
#Fit statistic : Chi-Squared =          63.75 using 59 PHA bins.
# Reduced chi-squared =          1.118 for     57 degrees of freedom
# Null hypothesis probability =   2.510726e-01

Photon flux (15-150 keV)    in 12.41 sec: 0.829584 ( -0.0436881  0.0437352 ) ph/cm2/s
Energy fluence (15-150 keV)             : 6.85384e-07 ( -3.99194e-08  4.01986e-08 ) ergs/cm2
Cutoff power-law model
Time interval is from   -0.668 sec. to   11.740 sec.
Spectral model in the cutoff power-law:
------------------------------------------------------------
Parameters  : value       lower 90%   higher 90%
Photon index: 0.764934     ( -0.49693   0.442233 )
Epeak [keV] : 53.2297      ( -5.82968 9.47163 )
Norm@50keV  : 2.20758E-02    ( -0.00926473   0.0189616 )
------------------------------------------------------------
#Fit statistic : Chi-Squared =          45.10 using 59 PHA bins.
# Reduced chi-squared =         0.8054 for     56 degrees of freedom
# Null hypothesis probability =   8.510667e-01

Photon flux (15-150 keV)    in 12.41 sec: 0.789110 ( -0.046408  0.046486 ) ph/cm2/s
Energy fluence (15-150 keV)             : 6.24656e-07 ( -4.52891e-08  4.62707e-08 ) ergs/cm2
Band function
Time interval is from   -0.668 sec. to   11.740 sec.

Spectral model in the Band function:
------------------------------------------------------------
Parameters  : value       lower 90%   higher 90%
alpha       : -0.164311   ( -0.860046   1.78093 )
beta        : -2.36817    ( 2.3709   0.309107 )
Epeak [keV] : 44.6353      ( -9.23723 12.2751 )
Norm@50keV   : 5.30639E-02    ( -0.0589562   0.839013 )
------------------------------------------------------------
#Fit statistic : Chi-Squared =          42.95 using 59 PHA bins.
# Reduced chi-squared =         0.7810 for     55 degrees of freedom
# Null hypothesis probability =   8.810758e-01

Photon flux (15-150 keV)    in 12.41 sec: 0.786358 ( 6.21364  -0.046304 ) ph/cm2/s
Energy fluence (15-150 keV)             : 6.36325e-07 ( -6.36238e-07  -4.43099e-08 ) ergs/cm2
Single BB
Spectral model blackbody:
------------------------------------------------------------
Parameters  : value    Lower 90%  Upper 90%
kT [keV]    : 11.6745  (-0.665771  0.714067)
R^2/D10^2   : 0.221507  (-0.0444341   0.0549384)
(R is the radius in km and D10 is the distance to the source in units of 10 kpc)
------------------------------------------------------------
#Fit statistic : Chi-Squared =          84.75 using 59 PHA bins.
# Reduced chi-squared =          1.487 for     57 degrees of freedom
# Null hypothesis probability =   9.958949e-03

Energy  Fluence     90% Error
[keV]   [erg/cm2]   [erg/cm2]
15- 25  7.902e-08   7.266e-09
25- 50  2.407e-07   1.477e-08
50-150  1.936e-07   2.389e-08
15-150  5.133e-07   2.929e-08
Thermal bremsstrahlung (OTTB)
Spectral model: thermal bremsstrahlung
------------------------------------------------------------
Parameters  : value         Lower 90%    Upper 90%
kT [keV]    : 94.8841       (-15.9882      21.7966)
Norm        : 3.72117       (-0.27405     0.302033)
------------------------------------------------------------
#Fit statistic : Chi-Squared =          48.98 using 59 PHA bins.
# Reduced chi-squared =         0.8593 for     57 degrees of freedom
# Null hypothesis probability =   7.662001e-01

Energy  Fluence     90% Error
[keV]   [erg/cm2]   [erg/cm2]
15- 25  1.206e-07   1.041e-08
25- 50  2.064e-07   1.247e-08
50-150  3.244e-07   9.363e-08
15-150  6.514e-07   1.007e-07
Double BB

Spectral model: bbodyrad<1> + bbodyrad<2>
------------------------------------------------------------
Parameters  : value         Lower 90%    Upper 90%
kT1 [keV]   : 7.94478        (-1.4198      1.29644)
R1^2/D10^2  : 0.640776        (-0.225614      0.479574)
kT2 [keV]   : 22.9762        (-5.24096      10.2313)
R2^2/D10^2  : 1.05028E-02    (-0.00797743   0.0219597)
------------------------------------------------------------
#Fit statistic : Chi-Squared =          43.37 using 59 PHA bins.
# Reduced chi-squared =         0.7885 for     55 degrees of freedom
# Null hypothesis probability =   8.715436e-01

Energy  Fluence     90% Error
[keV]   [erg/cm2]   [erg/cm2]
15- 25  1.028e-07   1.695e-08
25- 50  2.238e-07   3.984e-08
50-150  3.068e-07   1.279e-07
15-150  6.334e-07   1.634e-07
Peak spectrum fit
Power-law model
Time interval is from    3.616 sec. to    4.616 sec.

Spectral model in power-law:
------------------------------------------------------------
Parameters  : value       lower 90%   higher 90%
Photon index: 1.64895     ( -0.151241   0.155164 )
Norm@50keV  : 1.33376E-02    ( -0.00128587   0.00127092 )
------------------------------------------------------------
#Fit statistic : Chi-Squared =          44.36 using 59 PHA bins.
# Reduced chi-squared =         0.7783 for     57 degrees of freedom
# Null hypothesis probability =   8.888824e-01

Photon flux (15-150 keV)    in 1 sec: 1.74096 ( -0.154358  0.154429 ) ph/cm2/s
Energy fluence (15-150 keV)             : 1.24058e-07 ( -1.26903e-08  1.28251e-08 ) ergs/cm2
Cutoff power-law model

Time interval is from    3.616 sec. to    4.616 sec.
Spectral model in the cutoff power-law:
------------------------------------------------------------
Parameters  : value       lower 90%   higher 90%
Photon index: 1.22392     ( -0.664054   0.498232 )
Epeak [keV] : 85.9772      ( -30.0847 -85.9772 )
Norm@50keV  : 2.25040E-02    ( -0.00998   0.0278536 )
------------------------------------------------------------
#Fit statistic : Chi-Squared =          42.80 using 59 PHA bins.
# Reduced chi-squared =         0.7643 for     56 degrees of freedom
# Null hypothesis probability =   9.026979e-01

Photon flux (15-150 keV)    in 1 sec: 1.71484 ( -0.15854  0.15837 ) ph/cm2/s
Energy fluence (15-150 keV)             : 1.19944e-07 ( -1.4019e-08  1.404e-08 ) ergs/cm2
Band function
Time interval is from    3.616 sec. to    4.616 sec.

Spectral model in the Band function:
------------------------------------------------------------
Parameters  : value       lower 90%   higher 90%
alpha       : -1.22382   ( -0.378313   0.577007 )
beta        : -10.0000    ( 10   1.42109e-14 )
Epeak [keV] : 85.9566      ( -25.5718 -85.9566 )
Norm@50keV   : 2.25037E-02    ( -0.00998369   0.0279046 )
------------------------------------------------------------
#Fit statistic : Chi-Squared =          42.80 using 59 PHA bins.
# Reduced chi-squared =         0.7782 for     55 degrees of freedom
# Null hypothesis probability =   8.844548e-01

Photon flux (15-150 keV)    in 1 sec: 1.72230 (    ) ph/cm2/s
Energy fluence (15-150 keV)             : 1.20607e-07 ( 0  0 ) ergs/cm2
Single BB
Spectral model blackbody:
------------------------------------------------------------
Parameters  : value    Lower 90%  Upper 90%
kT [keV]    : 12.6245  (-1.37574  1.5813)
R^2/D10^2   : 0.357168  (-0.123675   0.184731)
(R is the radius in km and D10 is the distance to the source in units of 10 kpc)
------------------------------------------------------------
#Fit statistic : Chi-Squared =          70.54 using 59 PHA bins.
# Reduced chi-squared =          1.237 for     57 degrees of freedom
# Null hypothesis probability =   1.073406e-01

Energy  Fluence     90% Error
[keV]   [erg/cm2]   [erg/cm2]
15- 25  1.207e-08   1.938e-09
25- 50  4.026e-08   4.780e-09
50-150  3.986e-08   9.110e-09
15-150  9.219e-08   1.141e-08
Thermal bremsstrahlung (OTTB)
Spectral model: thermal bremsstrahlung
------------------------------------------------------------
Parameters  : value         Lower 90%    Upper 90%
kT [keV]    : 150.645       (-51.3121      -149.372)
Norm        : 7.20544       (-0.696335     0.452121)
------------------------------------------------------------
#Fit statistic : Chi-Squared =          42.81 using 59 PHA bins.
# Reduced chi-squared =         0.7511 for     57 degrees of freedom
# Null hypothesis probability =   9.184462e-01

Energy  Fluence     90% Error
[keV]   [erg/cm2]   [erg/cm2]
15- 25  1.850e-08   2.325e-09
25- 50  3.431e-08   8.195e-09
50-150  6.785e-08   2.986e-08
15-150  1.207e-07   4.091e-08
Double BB
Spectral model: bbodyrad<1> + bbodyrad<2>
------------------------------------------------------------
Parameters  : value         Lower 90%    Upper 90%
kT1 [keV]   : 7.33094        (-1.92307      1.97531)
R1^2/D10^2  : 1.72550        (-0.905906      2.14292)
kT2 [keV]   : 26.1589        (-7.19265      17.2812)
R2^2/D10^2  : 1.85568E-02    (-0.0151819   0.0462464)
------------------------------------------------------------
#Fit statistic : Chi-Squared =          42.64 using 59 PHA bins.
# Reduced chi-squared =         0.7752 for     55 degrees of freedom
# Null hypothesis probability =   8.879677e-01

Energy  Fluence     90% Error
[keV]   [erg/cm2]   [erg/cm2]
15- 25  1.774e-08   5.647e-09
25- 50  3.580e-08   1.287e-08
50-150  6.743e-08   3.344e-08
15-150  1.210e-07   4.562e-08
Pre-slew spectrum (Pre-slew PHA with pre-slew DRM)
Power-law model
Spectral model in power-law:
------------------------------------------------------------
Parameters  : value       lower 90%   higher 90%
Photon index: 1.82574     ( -0.0914679   0.093087 )
Norm@50keV  : 6.25251E-03    ( -0.000362335   0.000359828 )
------------------------------------------------------------
#Fit statistic : Chi-Squared =          64.95 using 59 PHA bins.
# Reduced chi-squared =          1.139 for     57 degrees of freedom
# Null hypothesis probability =   2.194352e-01

Photon flux (15-150 keV)    in 11.34 sec: 0.870332 ( -0.0459646  0.0460113 ) ph/cm2/s
Energy fluence (15-150 keV)             : 6.52241e-07 ( -3.81851e-08  3.84579e-08 ) ergs/cm2
Cutoff power-law model

Spectral model in the cutoff power-law:
------------------------------------------------------------
Parameters  : value       lower 90%   higher 90%
Photon index: 0.708069     ( -0.501682   0.446986 )
Epeak [keV] : 51.7478      ( -5.34697 8.09876 )
Norm@50keV  : 2.53365E-02    ( -0.0107442   0.0221158 )
------------------------------------------------------------
#Fit statistic : Chi-Squared =          43.69 using 59 PHA bins.
# Reduced chi-squared =         0.7802 for     56 degrees of freedom
# Null hypothesis probability =   8.843107e-01

Photon flux (15-150 keV)    in 11.34 sec: 0.825696 ( -0.048697  0.048774 ) ph/cm2/s
Energy fluence (15-150 keV)             : 5.91635e-07 ( -4.27269e-08  4.37792e-08 ) ergs/cm2
Band function
Spectral model in the Band function:
------------------------------------------------------------
Parameters  : value       lower 90%   higher 90%
alpha       : -6.59158E-02   ( -0.932506   1.5731 )
beta        : -2.45224    ( 2.46719   0.36269 )
Epeak [keV] : 44.0941      ( -9.37894 12.7625 )
Norm@50keV   : 6.45129E-02    ( -0.053674   0.61494 )
------------------------------------------------------------
#Fit statistic : Chi-Squared =          42.73 using 59 PHA bins.
# Reduced chi-squared =         0.7768 for     55 degrees of freedom
# Null hypothesis probability =   8.860650e-01

Photon flux (15-150 keV)    in 11.34 sec: 0.825582 ( 6.17442  -0.0486 ) ph/cm2/s
Energy fluence (15-150 keV)             : 6.02719e-07 ( -6.02639e-07  -4.26667e-08 ) ergs/cm2
S(25-50 keV) vs. S(50-100 keV) plot
S(25-50 keV)  = 1.94e-07
S(50-100 keV) = 2.21e-07
T90 vs. Hardness ratio plot
T90                                   = 10.3039999902248 sec.
Hardness ratio (energy fluence ratio) = 1.13918
Color vs. Color plot
Count Ratio  (25-50 keV) / (15-25 keV) = 1.38949
Count Ratio (50-100 keV) / (15-25 keV) = 0.736603
Mask shadow pattern
IMX = -4.625712549329783E-01, IMY = 6.421546464279676E-02
TIME vs. PHA plot around the trigger time
Blue+Cyan dotted lines: Time interval of the scaled map
From 0.000000 to 1.024000
TIME vs. DetID plot around the trigger time
Blue+Cyan dotted lines: Time interval of the scaled map
From 0.000000 to 1.024000
100 us light curve (15-350 keV)
Blue+Cyan dotted lines: Time interval of the scaled map
From 0.000000 to 1.024000
Spacecraft aspect plot
Bright source in the pre-burst/pre-slew/post-slew images
Pre-burst image of 15-350 keV band
Time interval of the image:
-30.331400 -0.668000

# RAcent  DECcent POSerr Theta    Phi  PeakCts   SNR AngSep     Name
#  [deg]    [deg]    ['] [deg]  [deg]                   [']
Pre-slew background subtracted image of 15-350 keV band
Time interval of the image:
-0.668000 10.668590

# RAcent  DECcent POSerr Theta    Phi  PeakCts   SNR AngSep     Name
#  [deg]    [deg]    ['] [deg]  [deg]                   [']
173.3315  -7.9001    2.5  46.6  136.4   0.7632   4.7 ------	UNKNOWN
148.8895  18.1660    0.4  25.0 -172.1   1.1413  27.9 ------	UNKNOWN
Post-slew image of 15-350 keV band
Time interval of the image:
56.668600 718.368600

# RAcent  DECcent POSerr Theta    Phi  PeakCts   SNR AngSep     Name
#  [deg]    [deg]    ['] [deg]  [deg]                   [']
171.8137 -15.3837    2.8  40.4  122.8   4.2765   4.1 ------	UNKNOWN
199.9093  44.4618    2.6  49.8   24.7   6.2192   4.4 ------	UNKNOWN
143.8336 -35.9680    2.2  54.4  163.2  10.2847   5.3 ------	UNKNOWN
133.7167 -21.6997    2.6  42.6  179.3   2.5525   4.5 ------	UNKNOWN
116.6207 -17.2765    3.3  47.6 -158.2   2.4617   3.5 ------	UNKNOWN
109.0433  53.8552    3.8  47.0  -53.0   5.6618   3.1 ------	UNKNOWN
Plot creation:
Sun May 31 04:19:04 EDT 2015