Special notes of this burst
Image
Pre-slew 15.0-350.0 keV image (Event data)
#   RAcent    DECcent   POSerr    Theta     Phi              Peak Cts       SNR   Name
   90.5683   -52.3931   0.0135    14.5184   -26.6512         0.8360454     14.262 TRIG_00350853

Foreground time interval of the image:
-13.576  11.725 (delta_t =  25.301 [sec])
Background time interval of the image:
-60.576 -13.576 (delta_t =  47.000 [sec])
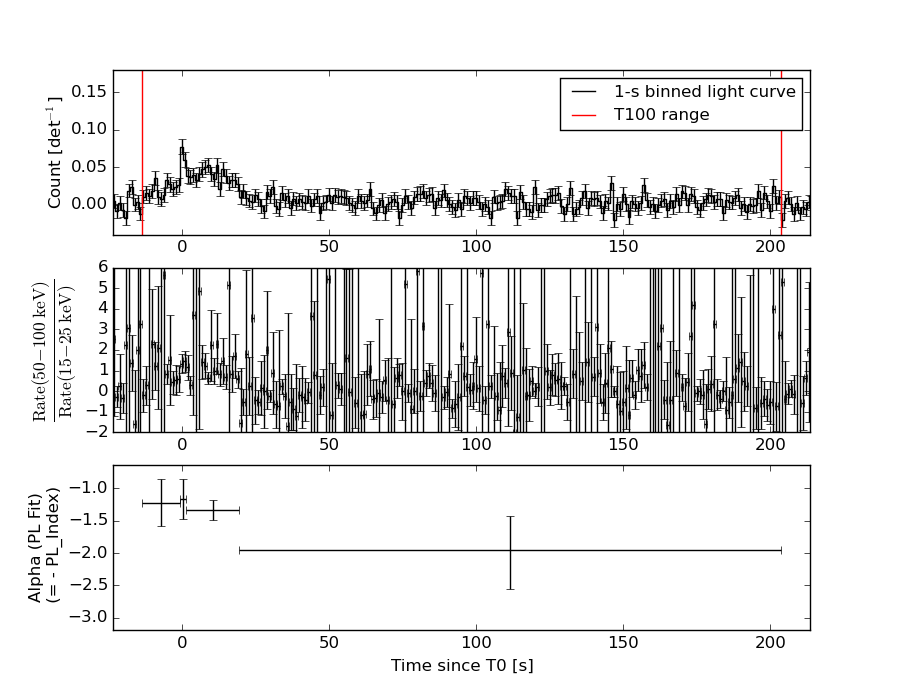
Lightcurves
Notes:
- 1) The mask-weighted light curves are using the flight position.
- 2) Multiple plots of different time binning/intervals are shown to cover all scenarios of short/long GRBs, rate/image triggers, and real/false positives.
- 3) For all the mask-weighted lightcurves, the y-axis units are counts/sec/det where a det is 0.4 x 0.4 = 0.16 sq cm.
- 4) The verticle lines correspond to following: green dotted lines are T50 interval, black dotted lines are T90 interval, blue solid line(s) is a spacecraft slew start time, and orange solid line(s) is a spacecraft slew end time.
- 5) Time of each bin is in the middle of the bin.
1 s binning
From T0-310 s to T0+310 s
From T100_start - 20 s to T100_end + 30 s
Full time interval

64 ms binning
Full time interval
From T100_start to T100_end

From T0-5 sec to T0+5 sec
16 ms binning
From T100_start-5 s to T100_start+5 s

Blue+Cyan dotted lines: Time interval of the scaled map
From 0.000000 to 1.024000
8 ms binning
From T100_start-3 s to T100_start+3 s
Blue+Cyan dotted lines: Time interval of the scaled map
From 0.000000 to 1.024000
2 ms binning
From T100_start-1 s to T100_start+1 s

Blue+Cyan dotted lines: Time interval of the scaled map
From 0.000000 to 1.024000
SN=5 or 10 sec. binning (whichever binning is satisfied first)
SN=5 or 10 sec. binning (T < 200 sec)

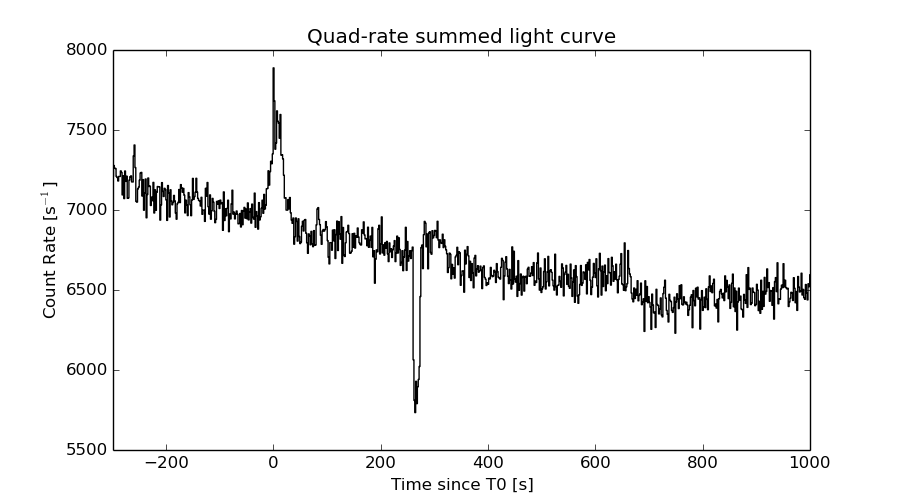
Quad-rate summed light curves (from T0-300s to T0+1000s)
Spectral Evolution
Spectra
Notes:
- 1) The fitting includes the systematic errors.
- 2) When the burst includes telescope slew time periods, the fitting uses an average response file made from multiple 5-s response files through out the slew time plus single time preiod for the non-slew times, and weighted by the total counts in the corresponding time period using addrmf. An average response file is needed becuase a spectral fit using the pre-slew DRM will introduce some errors in both a spectral shape and a normalization if the PHA file contains a lot of the slew/post-slew time interval.
- 3) For fits to more complicated models (e.g. a power-law over a cutoff power-law), the BAT team has decided to require a chi-square improvement of more than 6 for each extra dof.
Time averaged spectrum fit using the average DRM
Power-law model

Time interval is from  -13.576 sec. to  203.424 sec.

Spectral model in power-law:
------------------------------------------------------------
Parameters  : value       lower 90%   higher 90%
Photon index: 1.51854     ( -0.217542   0.22083 )
Norm@50keV  : 5.28784E-04    ( -6.71779e-05   6.61476e-05 )
------------------------------------------------------------
#Fit statistic : Chi-Squared =          51.62 using 59 PHA bins.
# Reduced chi-squared =         0.9056 for     57 degrees of freedom
# Null hypothesis probability =   6.764533e-01

Photon flux (15-150 keV)    in 217 sec: 6.63475E-02 ( -0.00785175  0.00785752 ) ph/cm2/s
Energy fluence (15-150 keV)             : 1.08532e-06 ( -1.52193e-07  1.55149e-07 ) ergs/cm2
Cutoff power-law model

Time interval is from  -13.576 sec. to  203.424 sec.
Spectral model in the cutoff power-law:
------------------------------------------------------------
Parameters  : value       lower 90%   higher 90%
Photon index: 1.51556     ( -0.218104   0.223218 )
Epeak [keV] : 9999.36      ( -9999.36 -9999.36 )
Norm@50keV  : 5.30365E-04    ( -0.000341604   0.000636715 )
------------------------------------------------------------
#Fit statistic : Chi-Squared =          51.62 using 59 PHA bins.
# Reduced chi-squared =         0.9218 for     56 degrees of freedom
# Null hypothesis probability =   6.411003e-01

Photon flux (15-150 keV)    in 217 sec: 6.63313E-02 ( -0.0078329  0.0078414 ) ph/cm2/s
Energy fluence (15-150 keV)             : 1.08369e-06 ( -1.57705e-07  1.54241e-07 ) ergs/cm2
Band function

Time interval is from  -13.576 sec. to  203.424 sec.

Spectral model in the Band function:
------------------------------------------------------------
Parameters  : value       lower 90%   higher 90%
alpha       : -0.991480   ( 0.971257   0.971257 )
beta        : -1.55703    ( 1.55808   0.253626 )
Epeak [keV] : 56.1322      ( -53.0174 -53.0174 )
Norm@50keV   : 1.21584E-03    ( -0.00135714   65068.1 )
------------------------------------------------------------
#Fit statistic : Chi-Squared =          51.53 using 59 PHA bins.
# Reduced chi-squared =         0.9370 for     55 degrees of freedom
# Null hypothesis probability =   6.078958e-01

Photon flux (15-150 keV)    in 217 sec:  (    ) ph/cm2/s
Energy fluence (15-150 keV)             : 0 ( 0  0 ) ergs/cm2
Single BB
Spectral model blackbody:
------------------------------------------------------------
Parameters  : value    Lower 90%  Upper 90%
kT [keV]    : 12.8964  (-2.10025  2.73884)
R^2/D10^2   : 1.22844E-02  (-0.00600207   0.010927)
(R is the radius in km and D10 is the distance to the source in units of 10 kpc)
------------------------------------------------------------
#Fit statistic : Chi-Squared =          74.12 using 59 PHA bins.
# Reduced chi-squared =          1.300 for     57 degrees of freedom
# Null hypothesis probability =   6.331623e-02

Energy  Fluence     90% Error
[keV]   [erg/cm2]   [erg/cm2]
15- 25  9.404e-08   2.233e-08
25- 50  3.211e-07   5.696e-08
50-150  3.360e-07   8.886e-08
15-150  7.511e-07   1.309e-07
Thermal bremsstrahlung (OTTB)
Spectral model: thermal bremsstrahlung
------------------------------------------------------------
Parameters  : value         Lower 90%    Upper 90%
kT [keV]    : 199.363       (-84.3629      -199.363)
Norm        : 0.269676       (-0.0317283     0.031756)
------------------------------------------------------------
#Fit statistic : Chi-Squared =          52.47 using 59 PHA bins.
# Reduced chi-squared =         0.9206 for     57 degrees of freedom
# Null hypothesis probability =   6.454146e-01

Energy  Fluence     90% Error
[keV]   [erg/cm2]   [erg/cm2]
15- 25  1.457e-07   8.146e-08
25- 50  2.803e-07   1.532e-07
50-150  6.148e-07   3.429e-07
15-150  1.041e-06   5.723e-07
Double BB
Spectral model: bbodyrad<1> + bbodyrad<2>
------------------------------------------------------------
Parameters  : value         Lower 90%    Upper 90%
kT1 [keV]   : 7.65082        (-1.92113      2.15091)
R1^2/D10^2  : 6.03563E-02        (-0.0342918      0.100121)
kT2 [keV]   : 39.2226        (-15.8787      -39.2224)
R2^2/D10^2  : 2.36688E-04    (-0.000218191   0.000992782)
------------------------------------------------------------
#Fit statistic : Chi-Squared =          50.35 using 59 PHA bins.
# Reduced chi-squared =         0.9154 for     55 degrees of freedom
# Null hypothesis probability =   6.527740e-01

Energy  Fluence     90% Error
[keV]   [erg/cm2]   [erg/cm2]
15- 25  1.442e-07   5.545e-08
25- 50  2.866e-07   1.204e-07
50-150  7.030e-07   3.824e-07
15-150  1.134e-06   4.959e-07
Peak spectrum fit
Power-law model
Time interval is from   -0.576 sec. to    0.424 sec.

Spectral model in power-law:
------------------------------------------------------------
Parameters  : value       lower 90%   higher 90%
Photon index: 1.16008     ( -0.389992   0.368567 )
Norm@50keV  : 4.82460E-03    ( -0.000984853   0.000984839 )
------------------------------------------------------------
#Fit statistic : Chi-Squared =          65.22 using 59 PHA bins.
# Reduced chi-squared =          1.144 for     57 degrees of freedom
# Null hypothesis probability =   2.125832e-01

Photon flux (15-150 keV)    in 1 sec: 0.563333 ( -0.117536  0.117903 ) ph/cm2/s
Energy fluence (15-150 keV)             : 4.95158e-08 ( -1.13765e-08  1.16147e-08 ) ergs/cm2
Cutoff power-law model
Time interval is from   -0.576 sec. to    0.424 sec.
Spectral model in the cutoff power-law:
------------------------------------------------------------
Parameters  : value       lower 90%   higher 90%
Photon index: 1.16782     ( -0.401855   0.362611 )
Epeak [keV] : 9999.36      ( -9999.36 -9999.36 )
Norm@50keV  : 4.83373E-03    ( -0.000989506   0.0119104 )
------------------------------------------------------------
#Fit statistic : Chi-Squared =          65.23 using 59 PHA bins.
# Reduced chi-squared =          1.165 for     56 degrees of freedom
# Null hypothesis probability =   1.865937e-01

Photon flux (15-150 keV)    in 1 sec: 0.564289 ( -0.118222  0.116773 ) ph/cm2/s
Energy fluence (15-150 keV)             : 4.91995e-08 ( -1.14603e-08  1.17816e-08 ) ergs/cm2
Band function
Time interval is from   -0.576 sec. to    0.424 sec.

Spectral model in the Band function:
------------------------------------------------------------
Parameters  : value       lower 90%   higher 90%
alpha       : 4.95355   ( -4.95355   -4.95355 )
beta        : -1.40425    ( -0.629363   0.491848 )
Epeak [keV] : 31.1237      ( -31.1237 64.0711 )
Norm@50keV   : 106.594    ( -21.5012   1.48615e+06 )
------------------------------------------------------------
#Fit statistic : Chi-Squared =          63.66 using 59 PHA bins.
# Reduced chi-squared =          1.157 for     55 degrees of freedom
# Null hypothesis probability =   1.981121e-01

Photon flux (15-150 keV)    in 1 sec:  (    ) ph/cm2/s
Energy fluence (15-150 keV)             : 0 ( 0  0 ) ergs/cm2
Single BB
Spectral model blackbody:
------------------------------------------------------------
Parameters  : value    Lower 90%  Upper 90%
kT [keV]    : 17.5465  (-5.65342  9.63238)
R^2/D10^2   : 3.82149E-02  (-0.0281488   0.102103)
(R is the radius in km and D10 is the distance to the source in units of 10 kpc)
------------------------------------------------------------
#Fit statistic : Chi-Squared =          73.63 using 59 PHA bins.
# Reduced chi-squared =          1.292 for     57 degrees of freedom
# Null hypothesis probability =   6.833969e-02

Energy  Fluence     90% Error
[keV]   [erg/cm2]   [erg/cm2]
15- 25  2.374e-09   1.180e-09
25- 50  1.077e-08   4.419e-09
50-150  2.390e-08   1.165e-08
15-150  3.705e-08   1.522e-08
Thermal bremsstrahlung (OTTB)

Spectral model: thermal bremsstrahlung
------------------------------------------------------------
Parameters  : value         Lower 90%    Upper 90%
kT [keV]    : 200.000       (      )
Norm        : 2.30485       (-0.482377     0.482356)
------------------------------------------------------------
#Fit statistic : Chi-Squared =          68.33 using 59 PHA bins.
# Reduced chi-squared =          1.199 for     57 degrees of freedom
# Null hypothesis probability =   1.446304e-01

Energy  Fluence     90% Error
[keV]   [erg/cm2]   [erg/cm2]
15- 25  5.739e-09   3.433e-09
25- 50  1.104e-08   6.365e-09
50-150  2.421e-08   1.402e-08
15-150  4.099e-08   2.385e-08
Double BB
Spectral model: bbodyrad<1> + bbodyrad<2>
------------------------------------------------------------
Parameters  : value         Lower 90%    Upper 90%
kT1 [keV]   : 8.71743        (-2.88139      4.07033)
R1^2/D10^2  : 0.314864        (-0.222318      0.839474)
kT2 [keV]   : 72.5341        (-64.9557      -77.6348)
R2^2/D10^2  : 6.13233E-04    (-0.000399113   0.00603924)
------------------------------------------------------------
#Fit statistic : Chi-Squared =          62.47 using 59 PHA bins.
# Reduced chi-squared =          1.136 for     55 degrees of freedom
# Null hypothesis probability =   2.280022e-01

Energy  Fluence     90% Error
[keV]   [erg/cm2]   [erg/cm2]
15- 25  4.838e-09   2.841e-09
25- 50  1.126e-08   6.480e-09
50-150  3.636e-08   1.847e-08
15-150  5.246e-08   2.887e-08
Pre-slew spectrum (Pre-slew PHA with pre-slew DRM)
Power-law model
Spectral model in power-law:
------------------------------------------------------------
Parameters  : value       lower 90%   higher 90%
Photon index: 1.29636     ( -0.157521   0.156912 )
Norm@50keV  : 2.20715E-03    ( -0.000195909   0.000195349 )
------------------------------------------------------------
#Fit statistic : Chi-Squared =          55.21 using 59 PHA bins.
# Reduced chi-squared =         0.9687 for     57 degrees of freedom
# Null hypothesis probability =   5.423936e-01

Photon flux (15-150 keV)    in 25.3 sec: 0.263143 ( -0.0235307  0.023559 ) ph/cm2/s
Energy fluence (15-150 keV)             : 5.52299e-07 ( -5.5474e-08  5.60494e-08 ) ergs/cm2
Cutoff power-law model
Spectral model in the cutoff power-law:
------------------------------------------------------------
Parameters  : value       lower 90%   higher 90%
Photon index: 0.996971     ( -0.674208   0.378388 )
Epeak [keV] : 172.087      ( -172.087 -172.087 )
Norm@50keV  : 3.10236E-03    (     )
------------------------------------------------------------
#Fit statistic : Chi-Squared =          54.49 using 59 PHA bins.
# Reduced chi-squared =         0.9729 for     56 degrees of freedom
# Null hypothesis probability =   5.323877e-01

Photon flux (15-150 keV)    in 25.3 sec: 0.259358 ( -0.024789  0.024679 ) ph/cm2/s
Energy fluence (15-150 keV)             : 5.39004e-07 ( -6.24657e-08  6.20255e-08 ) ergs/cm2
Band function

Spectral model in the Band function:
------------------------------------------------------------
Parameters  : value       lower 90%   higher 90%
alpha       : -0.692652   ( 0.681974   0.681974 )
beta        : -1.43726    ( 1.44093   0.272191 )
Epeak [keV] : 88.9498      ( -86.9773 721.209 )
Norm@50keV   : 4.83590E-03    ( -0.0029604   0 )
------------------------------------------------------------
#Fit statistic : Chi-Squared =          54.29 using 59 PHA bins.
# Reduced chi-squared =         0.9871 for     55 degrees of freedom
# Null hypothesis probability =   5.016297e-01

Photon flux (15-150 keV)    in 25.3 sec:  (    ) ph/cm2/s
Energy fluence (15-150 keV)             : 0 ( 0  0 ) ergs/cm2
S(25-50 keV) vs. S(50-100 keV) plot
S(25-50 keV)  = 2.71e-07
S(50-100 keV) = 3.78e-07
T90 vs. Hardness ratio plot
T90                                   = 184 sec.
Hardness ratio (energy fluence ratio) = 1.39483
Color vs. Color plot
Count Ratio  (25-50 keV) / (15-25 keV) = 1.45024
Count Ratio (50-100 keV) / (15-25 keV) = 0.875482
Mask shadow pattern
IMX = 2.314468653689279E-01, IMY = 1.161585947926813E-01
TIME vs. PHA plot around the trigger time
Blue+Cyan dotted lines: Time interval of the scaled map
From 0.000000 to 1.024000
TIME vs. DetID plot around the trigger time
Blue+Cyan dotted lines: Time interval of the scaled map
From 0.000000 to 1.024000
100 us light curve (15-350 keV)
Blue+Cyan dotted lines: Time interval of the scaled map
From 0.000000 to 1.024000
Spacecraft aspect plot

Bright source in the pre-burst/pre-slew/post-slew images
Pre-burst image of 15-350 keV band
Time interval of the image:
-60.576000 -13.576000

# RAcent  DECcent POSerr Theta    Phi  PeakCts   SNR AngSep     Name
#  [deg]    [deg]    ['] [deg]  [deg]                   [']
135.5029 -40.5086    3.9  37.9   32.3   0.3647   2.9    3.0	Vela X-1
170.3083 -60.7810    5.6  35.1   82.5  -0.3812  -2.1    9.5	Cen X-3
186.5397 -62.6940    3.0  38.7   94.2   1.0347   3.8    5.6	GX 301-2
Pre-slew background subtracted image of 15-350 keV band
Time interval of the image:
-13.576000 11.724590

# RAcent  DECcent POSerr Theta    Phi  PeakCts   SNR AngSep     Name
#  [deg]    [deg]    ['] [deg]  [deg]                   [']
135.6705 -40.4188    0.0  38.1   32.4   0.0345   0.3   10.4	Vela X-1
170.6040 -60.6442    8.3  35.3   82.5  -0.2326  -1.4    8.6	Cen X-3
186.4336 -62.7123    3.4  38.7   94.2  -0.8468  -3.4    7.0	GX 301-2
158.3788 -47.2253    1.9  41.2   59.8   1.5023   6.1 ------	UNKNOWN
133.9169 -23.6856    2.5  52.5   20.3   1.5081   4.7 ------	UNKNOWN
 90.5683 -52.3931    0.8  14.5  -26.7   0.8360  14.3 ------	UNKNOWN
Post-slew image of 15-350 keV band
Time interval of the image:
47.124590 257.324600

# RAcent  DECcent POSerr Theta    Phi  PeakCts   SNR AngSep     Name
#  [deg]    [deg]    ['] [deg]  [deg]                   [']
135.5295 -40.5433    2.8  32.5   49.4   1.1570   4.1    0.7	Vela X-1
  8.6907 -65.7903    2.6  40.7 -179.0   1.0602   4.4 ------	UNKNOWN
  7.7601 -43.8407    2.1  52.9 -153.6   2.8539   5.5 ------	UNKNOWN
 79.2698  -6.1963    4.4  47.1  -52.9   2.0758   2.7 ------	UNKNOWN
Plot creation:
Sun May 31 04:13:26 EDT 2015