Click here for the BAT GCN circular template
Image
Pre-slew 15-350 keV image (Event data; bkg subtracted)

#   RAcent  DECcent POSerr  Theta    Phi     Peak Cts     SNR  Name
  274.6577 -17.0691 0.0303   23.9  -11.5       0.6361     6.3  TRIG_00351323
------------------------------------------

Foreground time interval of the image:
  0.000  64.000 (delta_t =  64.000 [sec])
Background time interval of the image:
Lightcurves
Notes:
- 1) All plots contain as much data as has been downloaded to date.
- 2) Multiple plots of different time binning/intervals are shown to cover all scenarios of short/long GRBs, rate/image triggers, and real/false positives.
- 3) For all the mask-weighted lightcurves, the y-axis units are counts/sec/det where a det is 0.4 x 0.4 = 0.16 sq cm.
- 4) The verticle lines correspond to following: green dotted lines are T50 interval, black dotted lines are T90 interval, blue solid line(s) is a spacecraft slew start time, and orange solid line(s) is a spacecraft slew end time.
- 5) Time of each bin is in the middle of the bin.
1 s binning
From T0-310 s to T0+310 s

From T100_start - 20 s to T100_end + 30 s

Full time interval

64 ms binning
Full time interval

From T100_start to T100_end

From T0-5 sec to T0+5 sec

16 ms binning
From T100_start-5 s to T100_start+5 s

8 ms binning
From T100_start-3 s to T100_start+3 s

2 ms binning
From T100_start-1 s to T100_start+1 s

SN=5 or 10 sec. binning (whichever binning is satisfied first)

SN=5 or 10 sec. binning (T < 200 sec)

Spectra
Notes:
- 1) The fitting includes the systematic errors.
- 2) For long bursts, a spectral fit of the pre-slew DRM will introduce some errors in both a spectral shape and a normalization if the PHA file contains a lot of the slew/post-slew time interval.
- 3) For fits to more complicated models (e.g. a power-law over a cutoff power-law), the BAT team has decided to require a chi-square improvement of more than 6 for each extra dof.
- 4) For short bursts (T90<1sec), the specrtum is also fit with Blackbody, OTTB, and Double Blackbody.
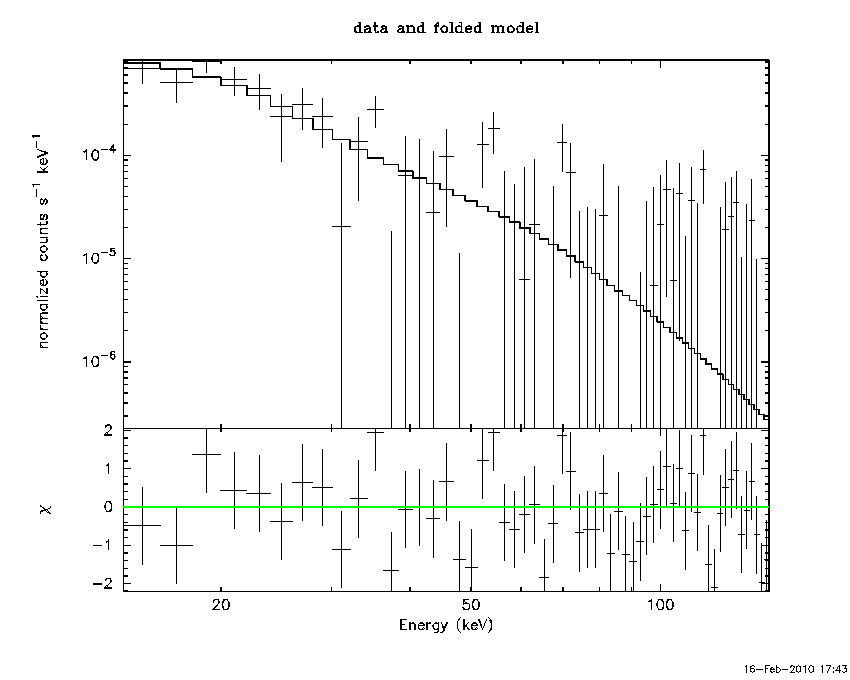
Time averaged spectrum fit using the pre-slew DRM
Power-law model

Time interval is from    0.000 sec. to   64.000 sec.

Spectral model in power-law:
------------------------------------------------------------
Parameters  : value       lower 90%   higher 90%
Photon index: 3.33174     ( -0.616219   0.619129 )
Norm@50keV  : 2.30516E-04    ( -0.000108989   0.000160619 )
------------------------------------------------------------
# Chi-Squared =          59.70 using 59 PHA bins.
# Reduced chi-squared =          1.047 for     57 degrees of freedom
# Null hypothesis probability =   3.776505e-01

Photon flux (15-150 keV)    in 64 sec: 8.21085E-02 ( -0.0174871  0.0175835 ) ph/cm2/s
Energy fluence (15-150 keV)             : 2.15441e-07 ( -5.71837e-08  6.41126e-08 ) ergs/cm2
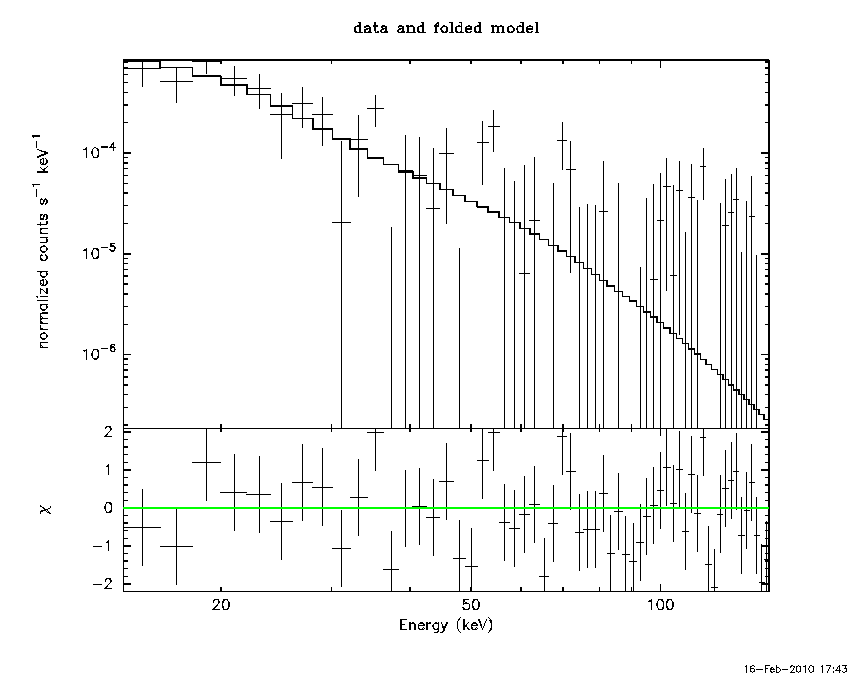
Cutoff power-law model

Time interval is from    0.000 sec. to   64.000 sec.
Spectral model in the cutoff power-law:
------------------------------------------------------------
Parameters  : value       lower 90%   higher 90%
Photon index: 0.763229     ( -0.742007   1.2449 )
Epeak [keV] : 12.9274      (   )
Norm@50keV  : 1.78617E-02    (     )
------------------------------------------------------------
# Chi-Squared =          58.04 using 59 PHA bins.
# Reduced chi-squared =          1.036 for     56 degrees of freedom
# Null hypothesis probability =   3.999955e-01

Photon flux (15-150 keV)    in 64 sec: 8.20744E-02 ( -0.0174816  0.0175775 ) ph/cm2/s
Energy fluence (15-150 keV)             : 1.91297e-07 ( -4.78438e-08  6.44813e-08 ) ergs/cm2
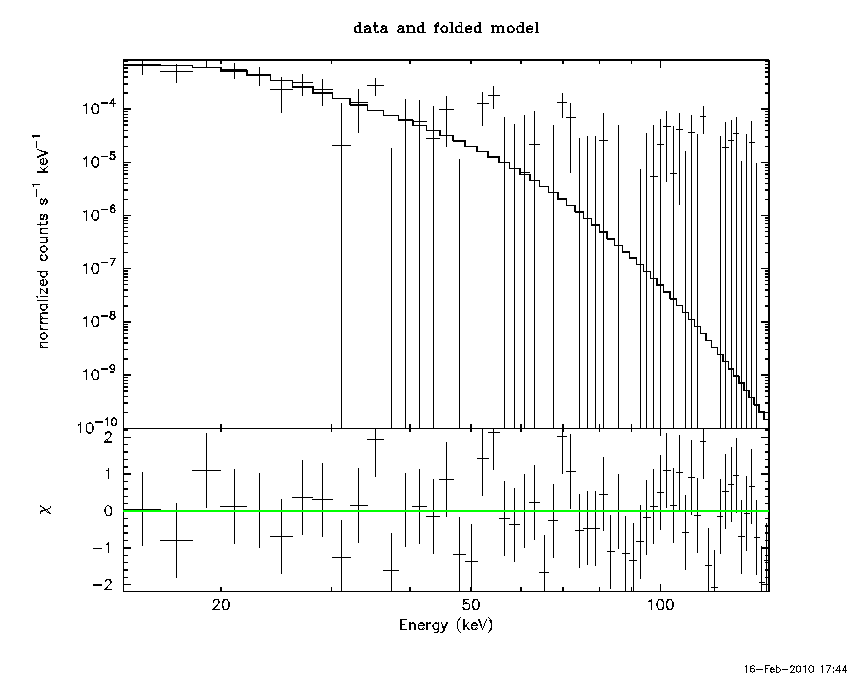
Band function

Time interval is from    0.000 sec. to   64.000 sec.

Spectral model in the Band function:
------------------------------------------------------------
Parameters  : value       lower 90%   higher 90%
alpha       : -1.04667   ( 1.04667   5.89532 )
beta        : -9.29038    ( 7.10881   17.1086 )
Epeak [keV] : 11.2069      ( -11.2556 9.34747 )
Norm@50keV   : 1.10831E-02    ( -0.0110037   3.51954 )
------------------------------------------------------------
# Chi-Squared =          58.06 using 59 PHA bins.
# Reduced chi-squared =          1.056 for     55 degrees of freedom
# Null hypothesis probability =   3.631053e-01

Photon flux (15-150 keV)    in 64 sec: 8.103948E-02 ( -0.0166261  0.0174958 ) ph/cm2/s
Energy fluence (15-150 keV)             : 2.07744e-07 ( -4.35443e-08  4.70342e-08 ) ergs/cm2
Peak spectrum fit
Power-law model
Time interval is from    0.000 sec. to   64.000 sec.

Spectral model in power-law:
------------------------------------------------------------
Parameters  : value       lower 90%   higher 90%
Photon index: 3.21913     ( -0.507397   0.640515 )
Norm@50keV  : 2.53456E-04    ( -0.000121053   0.000144721 )
------------------------------------------------------------
# Chi-Squared =          60.55 using 59 PHA bins.
# Reduced chi-squared =          1.062 for     57 degrees of freedom
# Null hypothesis probability =   3.491591e-01

Photon flux (15-150 keV)    in 64 sec: 8.21055E-02 ( -0.0166423  0.0167857 ) ph/cm2/s
Energy fluence (15-150 keV)             : 2.17262e-07 ( -5.66474e-08  6.39216e-08 ) ergs/cm2
Cutoff power-law model

Time interval is from    0.000 sec. to   64.000 sec.
Spectral model in the cutoff power-law:
------------------------------------------------------------
Parameters  : value       lower 90%   higher 90%
Photon index: 0.706268     (     )
Epeak [keV] : 13.2007      (   )
Norm@50keV  : 1.98846E-02    (     )
------------------------------------------------------------
# Chi-Squared =          58.70 using 59 PHA bins.
# Reduced chi-squared =          1.048 for     56 degrees of freedom
# Null hypothesis probability =   3.767005e-01

Photon flux (15-150 keV)    in 64 sec: 8.20734E-02 ( -0.016638  0.0167805 ) ph/cm2/s
Energy fluence (15-150 keV)             : 1.9225e-07 ( -4.64544e-08  6.24026e-08 ) ergs/cm2
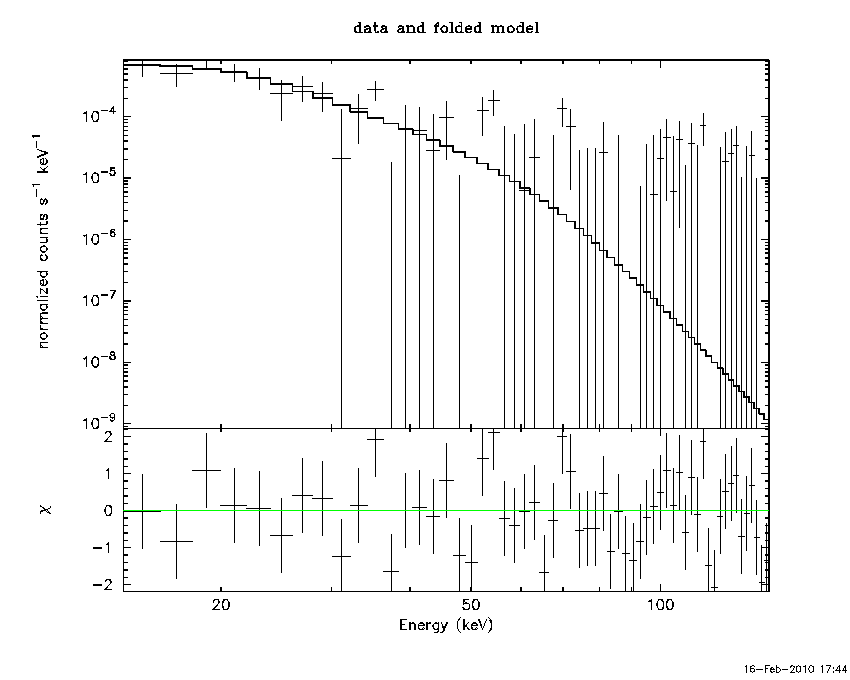
Band function

Time interval is from    0.000 sec. to   64.000 sec.

Spectral model in the Band function:
------------------------------------------------------------
Parameters  : value       lower 90%   higher 90%
alpha       : 4.11308   ( 1.04757   1.04757 )
beta        : -3.99343    ( 7.31883   17.314 )
Epeak [keV] : 18.1651      ( -4.27672 8.7615 )
Norm@50keV   : 213.374    ( -213.789   223.837 )
------------------------------------------------------------
# Chi-Squared =          58.62 using 59 PHA bins.
# Reduced chi-squared =          1.066 for     55 degrees of freedom
# Null hypothesis probability =   3.440325e-01

Photon flux (15-150 keV)    in 64 sec: 8.103948E-02 ( -0.0166261  0.0174958 ) ph/cm2/s
Energy fluence (15-150 keV)             : 2.07744e-07 ( -4.35443e-08  4.70342e-08 ) ergs/cm2
Pre-slew spectrum (Pre-slew PHA with pre-slew DRM)
Power-law model
Spectral model in power-law:
------------------------------------------------------------
Parameters  : value       lower 90%   higher 90%
Photon index: 3.33174     ( -0.616219   0.619129 )
Norm@50keV  : 2.30516E-04    ( -0.000108989   0.000160619 )
------------------------------------------------------------
# Chi-Squared =          59.70 using 59 PHA bins.
# Reduced chi-squared =          1.047 for     57 degrees of freedom
# Null hypothesis probability =   3.776505e-01

Photon flux (15-150 keV)    in 64 sec: 8.21085E-02 ( -0.0174871  0.0175835 ) ph/cm2/s
Energy fluence (15-150 keV)             : 2.15441e-07 ( -5.71837e-08  6.41126e-08 ) ergs/cm2
Cutoff power-law model
Spectral model in the cutoff power-law:
------------------------------------------------------------
Parameters  : value       lower 90%   higher 90%
Photon index: 0.763229     ( -0.742007   1.22204 )
Epeak [keV] : 12.9274      (   )
Norm@50keV  : 1.78617E-02    (     )
------------------------------------------------------------
# Chi-Squared =          58.04 using 59 PHA bins.
# Reduced chi-squared =          1.036 for     56 degrees of freedom
# Null hypothesis probability =   3.999955e-01

Photon flux (15-150 keV)    in 64 sec: 8.20744E-02 ( -0.0174816  0.0175775 ) ph/cm2/s
Energy fluence (15-150 keV)             : 1.91297e-07 ( -4.78438e-08  6.44813e-08 ) ergs/cm2
Band function
Spectral model in the Band function:
------------------------------------------------------------
Parameters  : value       lower 90%   higher 90%
alpha       : -1.04667   ( 1.04667   5.89532 )
beta        : -9.29038    ( 7.10881   17.1086 )
Epeak [keV] : 11.2069      ( -11.2556 9.34747 )
Norm@50keV   : 1.10831E-02    ( -0.0110037   3.51954 )
------------------------------------------------------------
# Chi-Squared =          58.06 using 59 PHA bins.
# Reduced chi-squared =          1.056 for     55 degrees of freedom
# Null hypothesis probability =   3.631053e-01

Photon flux (15-150 keV)    in 64 sec: 8.103948E-02 ( -0.0166261  0.0174958 ) ph/cm2/s
Energy fluence (15-150 keV)             : 2.07744e-07 ( -4.35443e-08  4.70342e-08 ) ergs/cm2
S(25-50 keV) vs. S(50-100 keV) plot

S(25-50 keV)  = 6.98054e-08
S(50-100 keV) = 2.92332e-08
T90 vs. Hardness ratio plot

T90                                   = 64 sec.
Hardness ratio (energy fluence ratio) = 0.418781
Color vs. Color plot

Count Ratio  (25-50 keV) / (15-25 keV) = 0.420608
Count Ratio (50-100 keV) / (15-25 keV) = 0.0190352
Mask shadow pattern

IMX = 0, IMY = 0
TIME vs. PHA plot around the trigger time

TIME vs. DetID plot around the trigger time

100 us light curve (15-350 keV)

Spacecraft aspect plot

Bright source in the pre-burst/pre-slew/post-slew images
Pre-burst image of 15-350 keV band
Time interval of the image:
Pre-slew background subtracted image of 15-350 keV band
Time interval of the image:
0.000000 64.000000

# RAcent  DECcent POSerr Theta    Phi  PeakCts   SNR AngSep     Name
#  [deg]    [deg]    ['] [deg]  [deg]                   [']
244.9609 -15.6370    0.9  26.0   59.8   1.8471  13.1    1.1	Sco X-1
254.5053  35.1971    7.5  32.4 -174.2  -0.1726  -1.5    9.0	Her X-1
256.1719 -37.8810    4.5  41.9   25.7   0.5297   2.6    9.1	4U 1700-377
256.4800 -36.4962    2.3  40.5   25.7   0.9180   5.0    4.9	GX 349+2
262.9301 -24.6118    3.7  28.2   17.4   0.3417   3.2    9.1	GX 1+4
264.9238 -44.4752   14.4  48.1   15.9   0.2371   0.8    7.9	4U 1735-44
268.2790  -1.5335    2.9   7.7  -29.9   0.3764   4.1    7.2	SW J1753.5-0127
270.3146 -25.2266    4.7  29.8    3.9  -0.2513  -2.4    9.0	GX 5-1
270.1411 -25.7238    4.2  30.3    4.5   0.2995   2.9    8.8	GRS 1758-258
273.9955 -13.9629    3.1  20.9  -14.4   0.3703   3.8    4.5	GX 17+2
275.8007 -30.4249    4.2  36.3   -1.3   0.3643   2.8    7.3	H1820-303
285.1762 -24.9080    4.4  36.0  -18.2   0.3090   2.6    7.7	HT1900.1-2455
288.7567  11.0224    1.9  27.0  -89.2   0.8123   6.1    5.2	GRS 1915+105
267.0766 -32.9524    3.0  36.8   11.8   0.4880   3.8 ------	UNKNOWN
274.6577 -17.0691    1.8  23.9  -11.5   0.6362   6.3 ------	UNKNOWN
Post-slew image of 15-350 keV band
Time interval of the image:
120.400600 349.170000
350.000000 963.076600

# RAcent  DECcent POSerr Theta    Phi  PeakCts   SNR AngSep     Name
#  [deg]    [deg]    ['] [deg]  [deg]                   [']
244.9909 -15.6500    0.5  28.5   96.2  23.2359  23.7    0.9	Sco X-1
255.9403 -37.8693    2.7  26.5   42.2   3.1324   4.3    2.7	4U 1700-377
256.5062 -36.5167    2.6  25.2   43.6   2.9547   4.5    6.6	GX 349+2
263.0307 -24.7831    3.6  13.3   60.3   1.7257   3.2    2.5	GX 1+4
264.5354 -44.3021    0.0  28.5   22.9  -0.8364  -1.3   12.6	4U 1735-44
268.3978  -1.4389    1.8  16.8  165.5   3.5229   6.5    2.0	SW J1753.5-0127
270.2375 -25.0765    2.5   9.0   34.1   2.9081   4.7    2.5	GX 5-1
270.3427 -25.6371    4.2   9.5   32.0   1.9051   3.2    6.7	GRS 1758-258
274.0247 -13.9589    3.4   3.2  176.5   2.0094   3.4    4.8	GX 17+2
275.9470 -30.2838    2.6  13.3    2.8   2.7253   4.4    5.1	H1820-303
285.2046 -24.9324    9.5  12.6  -42.0   0.6418   1.2    9.2	HT1900.1-2455
288.8004  10.9273    0.9  31.3 -144.9   8.2548  12.3    1.1	GRS 1915+105
274.6678 -17.0506    1.2   0.0 -150.4   5.2389   9.3 ------	UNKNOWN
274.9404   5.0838    3.4  22.2 -171.6   1.9066   3.4 ------	UNKNOWN
320.7992 -24.7223    5.7  43.6  -64.2   7.1400   2.1 ------	UNKNOWN
324.1140 -32.9052    4.1  47.1  -53.0   9.9281   2.8 ------	UNKNOWN
312.1707   2.9637    3.4  42.1 -107.2  10.3633   3.4 ------	UNKNOWN
Plot creation:
Tue Feb 16 17:46:36 EST 2010