Special notes of this burst
Image
Pre-slew 15.0-350.0 keV image (Event data)
#   RAcent    DECcent   POSerr    Theta     Phi              Peak Cts       SNR   Name
  241.4209   -28.3841   0.0186    32.5726    60.5478         7.0557285     10.305 TRIG_00351525

Foreground time interval of the image:
-62.396 293.581 (delta_t = 355.977 [sec])
Background time interval of the image:
-239.320 -62.396 (delta_t = 176.924 [sec])
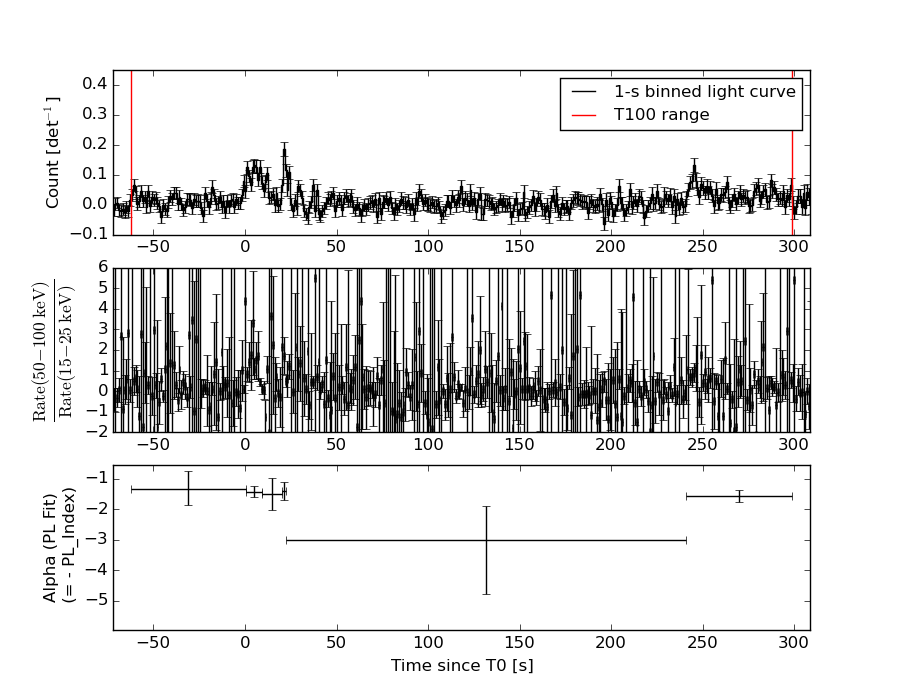
Lightcurves
Notes:
- 1) The mask-weighted light curves are using the flight position.
- 2) Multiple plots of different time binning/intervals are shown to cover all scenarios of short/long GRBs, rate/image triggers, and real/false positives.
- 3) For all the mask-weighted lightcurves, the y-axis units are counts/sec/det where a det is 0.4 x 0.4 = 0.16 sq cm.
- 4) The verticle lines correspond to following: green dotted lines are T50 interval, black dotted lines are T90 interval, blue solid line(s) is a spacecraft slew start time, and orange solid line(s) is a spacecraft slew end time.
- 5) Time of each bin is in the middle of the bin.
1 s binning
From T0-310 s to T0+310 s
From T100_start - 20 s to T100_end + 30 s
Full time interval

64 ms binning
Full time interval
From T100_start to T100_end
From T0-5 sec to T0+5 sec
16 ms binning
From T100_start-5 s to T100_start+5 s
Blue+Cyan dotted lines: Time interval of the scaled map
From 0.000000 to 8.192000
8 ms binning
From T100_start-3 s to T100_start+3 s
Blue+Cyan dotted lines: Time interval of the scaled map
From 0.000000 to 8.192000
2 ms binning
From T100_start-1 s to T100_start+1 s
Blue+Cyan dotted lines: Time interval of the scaled map
From 0.000000 to 8.192000
SN=5 or 10 sec. binning (whichever binning is satisfied first)
SN=5 or 10 sec. binning (T < 200 sec)

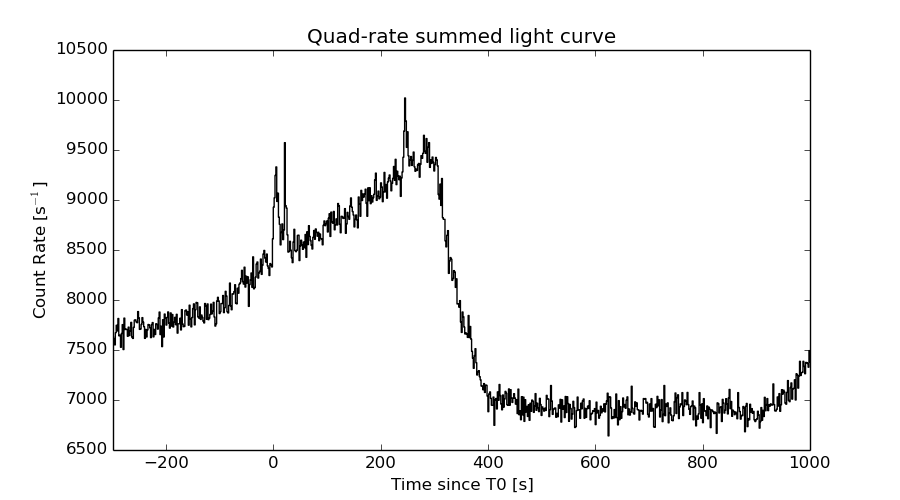
Quad-rate summed light curves (from T0-300s to T0+1000s)
Spectral Evolution
Spectra
Notes:
- 1) The fitting includes the systematic errors.
- 2) When the burst includes telescope slew time periods, the fitting uses an average response file made from multiple 5-s response files through out the slew time plus single time preiod for the non-slew times, and weighted by the total counts in the corresponding time period using addrmf. An average response file is needed becuase a spectral fit using the pre-slew DRM will introduce some errors in both a spectral shape and a normalization if the PHA file contains a lot of the slew/post-slew time interval.
- 3) For fits to more complicated models (e.g. a power-law over a cutoff power-law), the BAT team has decided to require a chi-square improvement of more than 6 for each extra dof.
Time averaged spectrum fit using the average DRM
Power-law model
Time interval is from  -62.396 sec. to  298.696 sec.

Spectral model in power-law:
------------------------------------------------------------
Parameters  : value       lower 90%   higher 90%
Photon index: 1.69519     ( -0.206287   0.207688 )
Norm@50keV  : 9.89493E-04    ( -0.0001167   0.000115851 )
------------------------------------------------------------
#Fit statistic : Chi-Squared =          61.57 using 59 PHA bins.
# Reduced chi-squared =          1.080 for     57 degrees of freedom
# Null hypothesis probability =   3.159904e-01

Photon flux (15-150 keV)    in 361.1 sec: 0.131196 ( -0.0157055  0.0157934 ) ph/cm2/s
Energy fluence (15-150 keV)             : 3.3095e-06 ( -4.04714e-07  4.08679e-07 ) ergs/cm2
Cutoff power-law model
Time interval is from  -62.396 sec. to  298.696 sec.
Spectral model in the cutoff power-law:
------------------------------------------------------------
Parameters  : value       lower 90%   higher 90%
Photon index: 1.33162     ( -0.886318   0.796053 )
Epeak [keV] : 88.5089      ( -75.1204 -88.5089 )
Norm@50keV  : 1.52564E-03    ( -0.000631874   0.00277494 )
------------------------------------------------------------
#Fit statistic : Chi-Squared =          60.89 using 59 PHA bins.
# Reduced chi-squared =          1.087 for     56 degrees of freedom
# Null hypothesis probability =   3.043496e-01

Photon flux (15-150 keV)    in 361.1 sec: 0.128535 ( -0.016629  0.016664 ) ph/cm2/s
Energy fluence (15-150 keV)             : 3.20581e-06 ( -4.59948e-07  4.59319e-07 ) ergs/cm2
Band function

Time interval is from  -62.396 sec. to  298.696 sec.

Spectral model in the Band function:
------------------------------------------------------------
Parameters  : value       lower 90%   higher 90%
alpha       : -1.35193   ( -0.430426   0.731147 )
beta        : -9.36869    ( 9.37165   19.3716 )
Epeak [keV] : 93.1660      ( -37.7544 306.13 )
Norm@50keV   : 1.47664E-03    ( -0.000587413   0.00126569 )
------------------------------------------------------------
#Fit statistic : Chi-Squared =          60.90 using 59 PHA bins.
# Reduced chi-squared =          1.107 for     55 degrees of freedom
# Null hypothesis probability =   2.721003e-01

Photon flux (15-150 keV)    in 361.1 sec: 0.128773 (    ) ph/cm2/s
Energy fluence (15-150 keV)             : 3.22351e-06 ( -3.22098e-06  -4.11011e-07 ) ergs/cm2
Single BB

Spectral model blackbody:
------------------------------------------------------------
Parameters  : value    Lower 90%  Upper 90%
kT [keV]    : 13.1743  (-1.90316  2.3363)
R^2/D10^2   : 2.19362E-02  (-0.00986941   0.0174123)
(R is the radius in km and D10 is the distance to the source in units of 10 kpc)
------------------------------------------------------------
#Fit statistic : Chi-Squared =          78.76 using 59 PHA bins.
# Reduced chi-squared =          1.382 for     57 degrees of freedom
# Null hypothesis probability =   2.970828e-02

Energy  Fluence     90% Error
[keV]   [erg/cm2]   [erg/cm2]
15- 25  2.915e-07   6.476e-08
25- 50  1.018e-06   1.852e-07
50-150  1.126e-06   2.701e-07
15-150  2.436e-06   3.880e-07
Thermal bremsstrahlung (OTTB)
Spectral model: thermal bremsstrahlung
------------------------------------------------------------
Parameters  : value         Lower 90%    Upper 90%
kT [keV]    : 144.132       (-57.2463      -140.359)
Norm        : 0.534165       (-0.0717675     0.103379)
------------------------------------------------------------
#Fit statistic : Chi-Squared =          60.94 using 59 PHA bins.
# Reduced chi-squared =          1.069 for     57 degrees of freedom
# Null hypothesis probability =   3.363113e-01

Energy  Fluence     90% Error
[keV]   [erg/cm2]   [erg/cm2]
15- 25  4.970e-07   9.569e-08
25- 50  9.158e-07   3.163e-07
50-150  1.778e-06   1.011e-06
15-150  3.191e-06   1.630e-06
Double BB
Spectral model: bbodyrad<1> + bbodyrad<2>
------------------------------------------------------------
Parameters  : value         Lower 90%    Upper 90%
kT1 [keV]   : 7.16751        (-1.92732      2.24239)
R1^2/D10^2  : 0.146142        (-0.0891188      0.220898)
kT2 [keV]   : 26.7213        (-7.99955      22.1993)
R2^2/D10^2  : 1.26899E-03    (-0.00108543   0.0036242)
------------------------------------------------------------
#Fit statistic : Chi-Squared =          59.16 using 59 PHA bins.
# Reduced chi-squared =          1.076 for     55 degrees of freedom
# Null hypothesis probability =   3.262240e-01

Energy  Fluence     90% Error
[keV]   [erg/cm2]   [erg/cm2]
15- 25  5.008e-07   2.597e-07
25- 50  9.605e-07   5.048e-07
50-150  1.795e-06   9.999e-07
15-150  3.256e-06   1.530e-06
Peak spectrum fit
Power-law model

Time interval is from   20.732 sec. to   21.732 sec.

Spectral model in power-law:
------------------------------------------------------------
Parameters  : value       lower 90%   higher 90%
Photon index: 1.36923     ( -0.339944   0.33288 )
Norm@50keV  : 1.24738E-02    ( -0.00241724   0.00241724 )
------------------------------------------------------------
#Fit statistic : Chi-Squared =          48.43 using 59 PHA bins.
# Reduced chi-squared =         0.8496 for     57 degrees of freedom
# Null hypothesis probability =   7.833617e-01

Photon flux (15-150 keV)    in 1 sec: 1.50881 ( -0.309888  0.312504 ) ph/cm2/s
Energy fluence (15-150 keV)             : 1.21314e-07 ( -2.49189e-08  2.51308e-08 ) ergs/cm2
Cutoff power-law model
Time interval is from   20.732 sec. to   21.732 sec.
Spectral model in the cutoff power-law:
------------------------------------------------------------
Parameters  : value       lower 90%   higher 90%
Photon index: 0.976176     ( -1.62255   1.53443 )
Epeak [keV] : 138.597      ( -138.61 -138.61 )
Norm@50keV  : 1.92823E-02    ( -0.00901617   0.0950405 )
------------------------------------------------------------
#Fit statistic : Chi-Squared =          48.14 using 59 PHA bins.
# Reduced chi-squared =         0.8596 for     56 degrees of freedom
# Null hypothesis probability =   7.632934e-01

Photon flux (15-150 keV)    in 1 sec: 1.48384 ( -0.31911  0.32154 ) ph/cm2/s
Energy fluence (15-150 keV)             : 1.18715e-07 ( -2.73564e-08  2.6477e-08 ) ergs/cm2
Band function

Time interval is from   20.732 sec. to   21.732 sec.

Spectral model in the Band function:
------------------------------------------------------------
Parameters  : value       lower 90%   higher 90%
alpha       : 0.708266   ( -0.275422   -0.275422 )
beta        : -1.59467    ( 1.57564   0.482594 )
Epeak [keV] : 47.2148      ( -46.8301 169.048 )
Norm@50keV   : 0.224126    ( -0.237241   152.666 )
------------------------------------------------------------
#Fit statistic : Chi-Squared =          47.45 using 59 PHA bins.
# Reduced chi-squared =         0.8628 for     55 degrees of freedom
# Null hypothesis probability =   7.552325e-01

Photon flux (15-150 keV)    in 1 sec:  (    ) ph/cm2/s
Energy fluence (15-150 keV)             : 0 ( 0  0 ) ergs/cm2
Single BB
Spectral model blackbody:
------------------------------------------------------------
Parameters  : value    Lower 90%  Upper 90%
kT [keV]    : 16.4556  (-3.79589  5.51232)
R^2/D10^2   : 0.127469  (-0.0802868   0.192505)
(R is the radius in km and D10 is the distance to the source in units of 10 kpc)
------------------------------------------------------------
#Fit statistic : Chi-Squared =          53.32 using 59 PHA bins.
# Reduced chi-squared =         0.9355 for     57 degrees of freedom
# Null hypothesis probability =   6.137408e-01

Energy  Fluence     90% Error
[keV]   [erg/cm2]   [erg/cm2]
15- 25  7.090e-09   2.843e-09
25- 50  3.055e-08   1.282e-08
50-150  5.842e-08   2.704e-08
15-150  9.606e-08   3.312e-08
Thermal bremsstrahlung (OTTB)

Spectral model: thermal bremsstrahlung
------------------------------------------------------------
Parameters  : value         Lower 90%    Upper 90%
kT [keV]    : 199.363       (-86.0532      -199.363)
Norm        : 6.33703       (-1.23404     1.23409)
------------------------------------------------------------
#Fit statistic : Chi-Squared =          49.09 using 59 PHA bins.
# Reduced chi-squared =         0.8612 for     57 degrees of freedom
# Null hypothesis probability =   7.627407e-01

Energy  Fluence     90% Error
[keV]   [erg/cm2]   [erg/cm2]
15- 25  1.578e-08   9.235e-09
25- 50  3.036e-08   1.746e-08
50-150  6.657e-08   3.814e-08
15-150  1.127e-07   6.400e-08
Double BB
Spectral model: bbodyrad<1> + bbodyrad<2>
------------------------------------------------------------
Parameters  : value         Lower 90%    Upper 90%
kT1 [keV]   : 9.16689        (-4.81557      5.78978)
R1^2/D10^2  : 0.639215        (-0.404877      3.31102)
kT2 [keV]   : 34.6249        (-22.7018      -42.1646)
R2^2/D10^2  : 7.08853E-03    (-0.00399777   0.0301621)
------------------------------------------------------------
#Fit statistic : Chi-Squared =          47.42 using 59 PHA bins.
# Reduced chi-squared =         0.8622 for     55 degrees of freedom
# Null hypothesis probability =   7.563021e-01

Energy  Fluence     90% Error
[keV]   [erg/cm2]   [erg/cm2]
15- 25  1.177e-08   7.510e-09
25- 50  3.098e-08   1.791e-08
50-150  7.166e-08   4.059e-08
15-150  1.144e-07   6.010e-08
Pre-slew spectrum (Pre-slew PHA with pre-slew DRM)
Power-law model

Spectral model in power-law:
------------------------------------------------------------
Parameters  : value       lower 90%   higher 90%
Photon index: 1.70207     ( -0.20937   0.21097 )
Norm@50keV  : 9.74169E-04    ( -0.000117529   0.000116644 )
------------------------------------------------------------
#Fit statistic : Chi-Squared =          62.03 using 59 PHA bins.
# Reduced chi-squared =          1.088 for     57 degrees of freedom
# Null hypothesis probability =   3.016489e-01

Photon flux (15-150 keV)    in 356 sec: 0.129474 ( -0.0157983  0.0158868 ) ph/cm2/s
Energy fluence (15-150 keV)             : 3.21048e-06 ( -4.00863e-07  4.04904e-07 ) ergs/cm2
Cutoff power-law model

Spectral model in the cutoff power-law:
------------------------------------------------------------
Parameters  : value       lower 90%   higher 90%
Photon index: 1.26276     (     )
Epeak [keV] : 80.3094      (   )
Norm@50keV  : 1.64729E-03    (     )
------------------------------------------------------------
#Fit statistic : Chi-Squared =          61.10 using 59 PHA bins.
# Reduced chi-squared =          1.091 for     56 degrees of freedom
# Null hypothesis probability =   2.978381e-01

Photon flux (15-150 keV)    in 356 sec: 0.126352 ( -0.016725  0.016766 ) ph/cm2/s
Energy fluence (15-150 keV)             : 3.08867e-06 ( -4.56011e-07  2.29025e-07 ) ergs/cm2
Band function
Spectral model in the Band function:
------------------------------------------------------------
Parameters  : value       lower 90%   higher 90%
alpha       : -1.26932   ( -0.493137   0.698454 )
beta        : -9.37167    ( 9.37167   19.3717 )
Epeak [keV] : 82.4473      ( -31.1866 362.181 )
Norm@50keV   : 1.62137E-03    ( -0.00073663   0.000777272 )
------------------------------------------------------------
#Fit statistic : Chi-Squared =          61.10 using 59 PHA bins.
# Reduced chi-squared =          1.111 for     55 degrees of freedom
# Null hypothesis probability =   2.660197e-01

Photon flux (15-150 keV)    in 356 sec: 0.127011 (    ) ph/cm2/s
Energy fluence (15-150 keV)             : 3.12344e-06 ( -3.12095e-06  -4.11785e-07 ) ergs/cm2
S(25-50 keV) vs. S(50-100 keV) plot
S(25-50 keV)  = 8.94e-07
S(50-100 keV) = 1.10e-06
T90 vs. Hardness ratio plot
T90                                   = 336.375999987125 sec.
Hardness ratio (energy fluence ratio) = 1.23043
Color vs. Color plot
Count Ratio  (25-50 keV) / (15-25 keV) = 1.29228
Count Ratio (50-100 keV) / (15-25 keV) = 0.837283
Mask shadow pattern

IMX = 3.141223061373798E-01, IMY = -5.562907242225242E-01
TIME vs. PHA plot around the trigger time

Blue+Cyan dotted lines: Time interval of the scaled map
From 0.000000 to 8.192000
TIME vs. DetID plot around the trigger time

Blue+Cyan dotted lines: Time interval of the scaled map
From 0.000000 to 8.192000
100 us light curve (15-350 keV)

Blue+Cyan dotted lines: Time interval of the scaled map
From 0.000000 to 8.192000
Spacecraft aspect plot

Bright source in the pre-burst/pre-slew/post-slew images
Pre-burst image of 15-350 keV band
Time interval of the image:
-239.320000 -62.396000

# RAcent  DECcent POSerr Theta    Phi  PeakCts   SNR AngSep     Name
#  [deg]    [deg]    ['] [deg]  [deg]                   [']
244.9891 -15.6550    0.4  28.5   85.4   9.1928  29.2    1.0	Sco X-1
255.9882 -37.8068    1.5  26.5   31.5   1.6973   7.7    2.2	4U 1700-377
256.4146 -36.3501    4.1  25.2   33.3   0.6176   2.8    4.5	GX 349+2
263.1684 -24.7850    4.9  13.2   49.2   0.4199   2.4    9.0	GX 1+4
264.9125 -44.5043   13.9  28.7   11.5  -0.1802  -0.8    8.0	4U 1735-44
268.3451  -1.4567    3.7  16.8  154.4   0.5345   3.1    1.4	SW J1753.5-0127
270.3036 -25.0703    2.4   9.0   23.1   0.8850   4.9    1.2	GX 5-1
270.4154 -25.6749    4.5   9.5   20.9   0.5094   2.8    7.3	GRS 1758-258
274.0798 -14.0560    4.6   3.1  165.8   0.4562   2.5    4.5	GX 17+2
275.9456 -30.4356    2.2  13.4   -7.8   0.8817   5.3    4.2	H1820-303
285.2000 -24.9348   20.0  12.6  -52.6  -0.1031  -0.6    9.0	HT1900.1-2455
288.7959  10.9289    1.7  31.3 -155.7   1.3513   6.9    1.0	GRS 1915+105
299.5981  35.1986    2.5  57.4 -159.0   4.7075   4.6    0.4	Cyg X-1
262.8073 -33.8931    9.8  19.9   27.0   0.2057   1.2    9.7	GX 354-0
242.6342   7.8674    3.2  40.3  122.5   1.9993   3.6 ------	UNKNOWN
277.3703 -23.8191    2.1   7.2  -23.1   0.9049   5.5 ------	UNKNOWN
293.2415  -5.9118    2.6  21.3 -122.5   0.8124   4.5 ------	UNKNOWN
320.0869 -32.2195    3.5  43.6  -64.0   3.2218   3.3 ------	UNKNOWN
324.2266 -47.0252    3.2  50.4  -45.5   4.0068   3.6 ------	UNKNOWN
314.0932   4.6468    3.7  44.6 -118.8   2.5989   3.1 ------	UNKNOWN
Pre-slew background subtracted image of 15-350 keV band
Time interval of the image:
-62.396000 293.580600

# RAcent  DECcent POSerr Theta    Phi  PeakCts   SNR AngSep     Name
#  [deg]    [deg]    ['] [deg]  [deg]                   [']
244.9696 -15.7732    4.0  28.5   85.1  -1.7772  -2.9    8.0	Sco X-1
256.0092 -37.8787    1.4  26.5   31.4   3.5458   8.3    2.3	4U 1700-377
256.2377 -36.5333    0.0  25.4   33.2  -0.0540  -0.1   11.6	GX 349+2
263.1892 -24.6196    0.0  13.1   49.8  -0.7462  -2.2   12.4	GX 1+4
264.8219 -44.4040   18.1  28.6   11.7  -0.2639  -0.6    4.4	4U 1735-44
268.4514  -1.4583    8.1  16.8  154.8   0.5012   1.4    5.0	SW J1753.5-0127
270.3549 -25.1561   11.3   9.0   22.6  -0.3489  -1.1    6.0	GX 5-1
270.1517 -25.5808    0.0   9.5   22.4   0.3251   1.0   12.7	GRS 1758-258
274.0605 -14.0687    3.9   3.0  165.4  -0.9915  -3.0    3.7	GX 17+2
276.0520 -30.2216   45.7  13.2   -8.3  -0.0831  -0.3   10.9	H1820-303
284.8721 -24.9101    4.9  12.3  -51.9  -0.8422  -2.3    8.9	HT1900.1-2455
288.6624  11.0084    6.5  31.3 -156.0   0.6472   1.8    8.8	GRS 1915+105
299.5361  35.2125   10.6  57.3 -159.1   1.8018   1.1    2.7	Cyg X-1
263.1555 -33.8831    4.3  19.7   26.3   0.9515   2.7    8.8	GX 354-0
241.4209 -28.3842    1.1  32.6   60.5   7.0591  10.3 ------	UNKNOWN
275.6430  16.7981    2.9  33.9  178.5   1.6714   4.0 ------	UNKNOWN
Post-slew image of 15-350 keV band
Time interval of the image:
415.180600 832.280590

# RAcent  DECcent POSerr Theta    Phi  PeakCts   SNR AngSep     Name
#  [deg]    [deg]    ['] [deg]  [deg]                   [']
299.5743  35.1841    1.1  47.6  139.5  13.6099  10.8    1.3	Cyg X-1
308.0821  40.9438    3.4  42.4  149.6   2.3063   3.3    1.4	Cyg X-3
326.3053  38.3291    4.7  28.8  157.0   0.8313   2.4    6.3	Cyg X-2
314.8421  57.9226    2.6  47.2  173.6   2.4959   4.4 ------	UNKNOWN
  1.6016 -26.9725    2.5  46.8    4.4   2.6509   4.7 ------	UNKNOWN
345.3486  40.2258    3.1  22.1 -171.6   0.9888   3.8 ------	UNKNOWN
Plot creation:
Sun May 31 04:09:28 EDT 2015