Special notes of this burst
Image
Pre-slew 15.0-350.0 keV image (Event data)
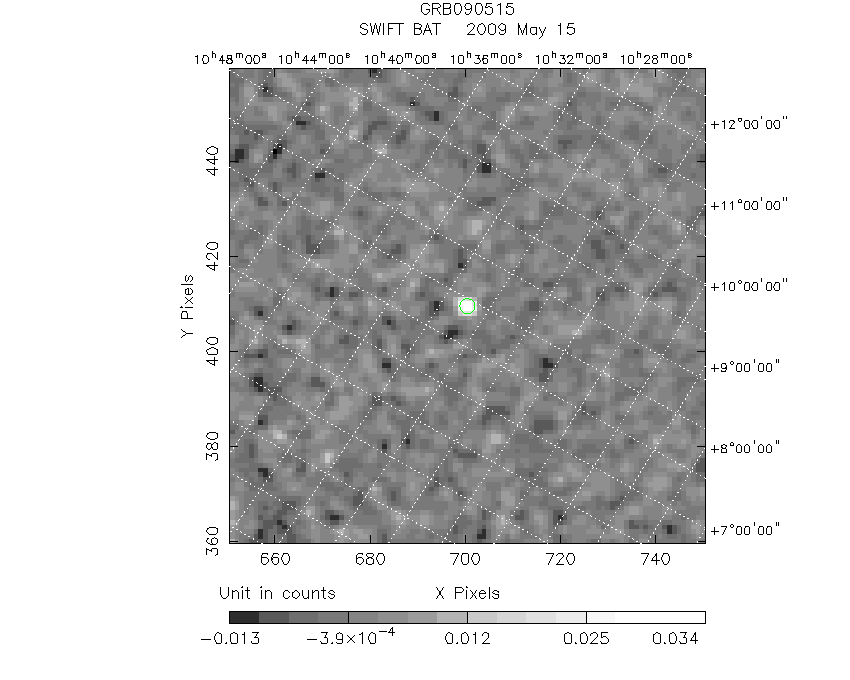
#   RAcent    DECcent   POSerr    Theta     Phi              Peak Cts       SNR   Name
  164.1644    14.4658   0.0175    21.9041    20.5417         0.0421650     11.002 TRIG_00352108

Foreground time interval of the image:
  0.008   0.056 (delta_t =   0.048 [sec])
Background time interval of the image:
-100.167   0.008 (delta_t = 100.175 [sec])
Lightcurves
Notes:
- 1) The mask-weighted light curves are using the flight position.
- 2) Multiple plots of different time binning/intervals are shown to cover all scenarios of short/long GRBs, rate/image triggers, and real/false positives.
- 3) For all the mask-weighted lightcurves, the y-axis units are counts/sec/det where a det is 0.4 x 0.4 = 0.16 sq cm.
- 4) The verticle lines correspond to following: green dotted lines are T50 interval, black dotted lines are T90 interval, blue solid line(s) is a spacecraft slew start time, and orange solid line(s) is a spacecraft slew end time.
- 5) Time of each bin is in the middle of the bin.
1 s binning
From T0-310 s to T0+310 s

From T100_start - 20 s to T100_end + 30 s

Full time interval

64 ms binning
Full time interval

From T100_start to T100_end

From T0-5 sec to T0+5 sec

16 ms binning
From T100_start-5 s to T100_start+5 s

Blue+Cyan dotted lines: Time interval of the scaled map
From 0.000000 to 0.032000
8 ms binning
From T100_start-3 s to T100_start+3 s

Blue+Cyan dotted lines: Time interval of the scaled map
From 0.000000 to 0.032000
2 ms binning
From T100_start-1 s to T100_start+1 s

Blue+Cyan dotted lines: Time interval of the scaled map
From 0.000000 to 0.032000
SN=5 or 10 sec. binning (whichever binning is satisfied first)

SN=5 or 10 sec. binning (T < 200 sec)

Quad-rate summed light curves (from T0-300s to T0+1000s)

Spectral Evolution

Spectra
Notes:
- 1) The fitting includes the systematic errors.
- 2) When the burst includes telescope slew time periods, the fitting uses an average response file made from multiple 5-s response files through out the slew time plus single time preiod for the non-slew times, and weighted by the total counts in the corresponding time period using addrmf. An average response file is needed becuase a spectral fit using the pre-slew DRM will introduce some errors in both a spectral shape and a normalization if the PHA file contains a lot of the slew/post-slew time interval.
- 3) For fits to more complicated models (e.g. a power-law over a cutoff power-law), the BAT team has decided to require a chi-square improvement of more than 6 for each extra dof.
Time averaged spectrum fit using the average DRM
Power-law model

Time interval is from    0.008 sec. to    0.056 sec.

Spectral model in power-law:
------------------------------------------------------------
Parameters  : value       lower 90%   higher 90%
Photon index: 1.40896     ( -0.233253   0.237794 )
Norm@50keV  : 4.81823E-02    ( -0.00788995   0.00787016 )
------------------------------------------------------------
#Fit statistic : Chi-Squared =          44.74 using 59 PHA bins.
# Reduced chi-squared =         0.7850 for     57 degrees of freedom
# Null hypothesis probability =   8.807372e-01

Photon flux (15-150 keV)    in 0.048 sec: 5.87977 ( -0.969472  0.97051 ) ph/cm2/s
Energy fluence (15-150 keV)             : 2.23058e-08 ( -3.9144e-09  3.93439e-09 ) ergs/cm2
Cutoff power-law model

Time interval is from    0.008 sec. to    0.056 sec.
Spectral model in the cutoff power-law:
------------------------------------------------------------
Parameters  : value       lower 90%   higher 90%
Photon index: 0.151045     ( -1.27295   1.00202 )
Epeak [keV] : 79.7569      ( -19.3128 93.9538 )
Norm@50keV  : 0.195515    ( -0.195515   0.561146 )
------------------------------------------------------------
#Fit statistic : Chi-Squared =          39.99 using 59 PHA bins.
# Reduced chi-squared =         0.7141 for     56 degrees of freedom
# Null hypothesis probability =   9.476776e-01

Photon flux (15-150 keV)    in 0.048 sec: 5.83826 ( -0.97627  0.97619 ) ph/cm2/s
Energy fluence (15-150 keV)             : 2.21476e-08 ( -4.04899e-09  4.04741e-09 ) ergs/cm2
Band function

Time interval is from    0.008 sec. to    0.056 sec.

Spectral model in the Band function:
------------------------------------------------------------
Parameters  : value       lower 90%   higher 90%
alpha       : -0.150804   ( -0.698138   1.75928 )
beta        : -10.0000    ( 10   20 )
Epeak [keV] : 79.7378      ( -17.5441 93.7608 )
Norm@50keV   : 0.195585    ( -0.195584   0.559857 )
------------------------------------------------------------
#Fit statistic : Chi-Squared =          39.99 using 59 PHA bins.
# Reduced chi-squared =         0.7270 for     55 degrees of freedom
# Null hypothesis probability =   9.360115e-01

Photon flux (15-150 keV)    in 0.048 sec: 5.89963 (    ) ph/cm2/s
Energy fluence (15-150 keV)             : 0 ( 0  0 ) ergs/cm2
Single BB

Spectral model blackbody:
------------------------------------------------------------
Parameters  : value    Lower 90%  Upper 90%
kT [keV]    : 17.0867  (-2.91807  3.42002)
R^2/D10^2   : 0.486471  (-0.229061   0.432742)
(R is the radius in km and D10 is the distance to the source in units of 10 kpc)
------------------------------------------------------------
#Fit statistic : Chi-Squared =          44.06 using 59 PHA bins.
# Reduced chi-squared =         0.7729 for     57 degrees of freedom
# Null hypothesis probability =   8.952295e-01

Energy  Fluence     90% Error
[keV]   [erg/cm2]   [erg/cm2]
15- 25  1.386e-09   4.224e-10
25- 50  6.159e-09   1.534e-09
50-150  1.286e-08   3.672e-09
15-150  2.041e-08   4.610e-09
Thermal bremsstrahlung (OTTB)

Spectral model: thermal bremsstrahlung
------------------------------------------------------------
Parameters  : value         Lower 90%    Upper 90%
kT [keV]    : 200.000       (      )
Norm        : 24.6940       (-3.98479     3.98463)
------------------------------------------------------------
#Fit statistic : Chi-Squared =          43.91 using 59 PHA bins.
# Reduced chi-squared =         0.7704 for     57 degrees of freedom
# Null hypothesis probability =   8.981224e-01

Energy  Fluence     90% Error
[keV]   [erg/cm2]   [erg/cm2]
15- 25  2.952e-09   1.711e-09
25- 50  5.679e-09   3.247e-09
50-150  1.246e-08   7.082e-09
15-150  2.109e-08   1.192e-08
Double BB

Spectral model: bbodyrad<1> + bbodyrad<2>
------------------------------------------------------------
Parameters  : value         Lower 90%    Upper 90%
kT1 [keV]   : 7.45051        (-5.59797      59.9258)
R1^2/D10^2  : 3.30727        (-2.81397      2106.36)
kT2 [keV]   : 22.3160        (-5.81108      45.4137)
R2^2/D10^2  : 0.156672    (-0.154113   0.366037)
------------------------------------------------------------
#Fit statistic : Chi-Squared =          39.64 using 59 PHA bins.
# Reduced chi-squared =         0.7208 for     55 degrees of freedom
# Null hypothesis probability =   9.409545e-01

Energy  Fluence     90% Error
[keV]   [erg/cm2]   [erg/cm2]
15- 25  2.192e-09   1.317e-09
25- 50  5.988e-09   3.156e-09
50-150  1.414e-08   8.443e-09
15-150  2.232e-08   1.171e-08
Peak spectrum fit
Power-law model

Time interval is from   -0.466 sec. to    0.534 sec.

Spectral model in power-law:
------------------------------------------------------------
Parameters  : value       lower 90%   higher 90%
Photon index: 1.01852     ( -0.838218   0.738818 )
Norm@50keV  : 2.56406E-03    ( -0.00112072   0.00109195 )
------------------------------------------------------------
#Fit statistic : Chi-Squared =          56.44 using 59 PHA bins.
# Reduced chi-squared =         0.9903 for     57 degrees of freedom
# Null hypothesis probability =   4.958786e-01

Photon flux (15-150 keV)    in 1 sec: 0.295544 ( -0.128098  0.129953 ) ph/cm2/s
Energy fluence (15-150 keV)             : 2.75474e-08 ( -1.23019e-08  1.26191e-08 ) ergs/cm2
Cutoff power-law model

Time interval is from   -0.466 sec. to    0.534 sec.
Spectral model in the cutoff power-law:
------------------------------------------------------------
Parameters  : value       lower 90%   higher 90%
Photon index: 0.332636     ( -5.08082   -0.33261 )
Epeak [keV] : 137.761      ( -137.781 -137.781 )
Norm@50keV  : 5.21789E-03    ( -0.00521746   1.53583 )
------------------------------------------------------------
#Fit statistic : Chi-Squared =          56.27 using 59 PHA bins.
# Reduced chi-squared =          1.005 for     56 degrees of freedom
# Null hypothesis probability =   4.649157e-01

Photon flux (15-150 keV)    in 1 sec: 0.287484 ( -0.130915  0.133463 ) ph/cm2/s
Energy fluence (15-150 keV)             : 2.66062e-08 ( -2.66062e-08  1.3164e-08 ) ergs/cm2
Band function

Time interval is from   -0.466 sec. to    0.534 sec.

Spectral model in the Band function:
------------------------------------------------------------
Parameters  : value       lower 90%   higher 90%
alpha       : 3.12782   ( -8.45412   3.68717 )
beta        : -1.47061    ( 9.37142   9.37142 )
Epeak [keV] : 50.3099      ( -89.9021 -142.403 )
Norm@50keV   : 0.495649    ( -0.506784   3.68231 )
------------------------------------------------------------
#Fit statistic : Chi-Squared =          56.01 using 59 PHA bins.
# Reduced chi-squared =          1.018 for     55 degrees of freedom
# Null hypothesis probability =   4.365569e-01

Photon flux (15-150 keV)    in 1 sec: 0.287884 (    ) ph/cm2/s
Energy fluence (15-150 keV)             : 0 ( 0  0 ) ergs/cm2
Single BB

Spectral model blackbody:
------------------------------------------------------------
Parameters  : value    Lower 90%  Upper 90%
kT [keV]    : 21.4705  (-9.78173  23.99)
R^2/D10^2   : 1.14306E-02  (-0.011407   0.0703978)
(R is the radius in km and D10 is the distance to the source in units of 10 kpc)
------------------------------------------------------------
#Fit statistic : Chi-Squared =          56.90 using 59 PHA bins.
# Reduced chi-squared =         0.9982 for     57 degrees of freedom
# Null hypothesis probability =   4.788577e-01

Energy  Fluence     90% Error
[keV]   [erg/cm2]   [erg/cm2]
15- 25  9.859e-10   6.495e-10
25- 50  5.138e-09   3.291e-09
50-150  1.768e-08   1.240e-08
15-150  2.380e-08   1.576e-08
Thermal bremsstrahlung (OTTB)

Spectral model: thermal bremsstrahlung
------------------------------------------------------------
Parameters  : value         Lower 90%    Upper 90%
kT [keV]    : 199.363       (-199.363      -199.363)
Norm        : 1.21592       (-0.53597     0.535987)
------------------------------------------------------------
#Fit statistic : Chi-Squared =          57.82 using 59 PHA bins.
# Reduced chi-squared =          1.014 for     57 degrees of freedom
# Null hypothesis probability =   4.446698e-01

Energy  Fluence     90% Error
[keV]   [erg/cm2]   [erg/cm2]
15- 25  3.028e-09   1.994e-09
25- 50  5.824e-09   3.856e-09
50-150  1.277e-08   8.615e-09
15-150  2.163e-08   1.404e-08
Double BB

------------------------------------------------------------
Parameters  : value         Lower 90%    Upper 90%
kT1 [keV]   : 10.6158        (-9.62107      -9.62107)
R1^2/D10^2  : 6.20469E-02        (      )
kT2 [keV]   : 38.6153        (-38.3993      -38.3993)
R2^2/D10^2  : 1.40557E-03    (-0.00147317   0.0565995)
------------------------------------------------------------
#Fit statistic : Chi-Squared =          56.11 using 59 PHA bins.
#Fit statistic : Chi-Squared =          56.07 using 59 PHA bins.
# Reduced chi-squared =          1.020 for     55 degrees of freedom
# Reduced chi-squared =          1.019 for     55 degrees of freedom
# Null hypothesis probability =   4.328743e-01
# Null hypothesis probability =   4.344790e-01

Energy  Fluence     90% Error
[keV]   [erg/cm2]   [erg/cm2]
15- 25  1.745e-09   1.183e-09
25- 50  5.706e-09   3.843e-09
50-150  1.919e-08   1.115e-08
15-150  2.664e-08   1.585e-08
Pre-slew spectrum (Pre-slew PHA with pre-slew DRM)
Power-law model

Spectral model in power-law:
------------------------------------------------------------
Parameters  : value       lower 90%   higher 90%
Photon index: 1.40896     ( -0.233253   0.237794 )
Norm@50keV  : 4.81823E-02    ( -0.00788995   0.00787016 )
------------------------------------------------------------
#Fit statistic : Chi-Squared =          44.74 using 59 PHA bins.
# Reduced chi-squared =         0.7850 for     57 degrees of freedom
# Null hypothesis probability =   8.807372e-01

Photon flux (15-150 keV)    in 0.048 sec: 5.87977 ( -0.969472  0.97051 ) ph/cm2/s
Energy fluence (15-150 keV)             : 2.23058e-08 ( -3.9144e-09  3.93439e-09 ) ergs/cm2
Cutoff power-law model

Spectral model in the cutoff power-law:
------------------------------------------------------------
Parameters  : value       lower 90%   higher 90%
Photon index: 0.151045     ( -1.27295   1.00202 )
Epeak [keV] : 79.7569      ( -19.3128 93.9538 )
Norm@50keV  : 0.195515    ( -0.195515   0.561146 )
------------------------------------------------------------
#Fit statistic : Chi-Squared =          39.99 using 59 PHA bins.
# Reduced chi-squared =         0.7141 for     56 degrees of freedom
# Null hypothesis probability =   9.476776e-01

Photon flux (15-150 keV)    in 0.048 sec: 5.83826 ( -0.97627  0.97619 ) ph/cm2/s
Energy fluence (15-150 keV)             : 2.21476e-08 ( -4.04899e-09  4.04741e-09 ) ergs/cm2
Band function

Spectral model in the Band function:
------------------------------------------------------------
Parameters  : value       lower 90%   higher 90%
alpha       : -0.150804   ( -0.698138   1.75928 )
beta        : -10.0000    ( 10   0 )
Epeak [keV] : 79.7378      ( -17.5441 93.7608 )
Norm@50keV   : 0.195585    ( -0.195584   0.559857 )
------------------------------------------------------------
#Fit statistic : Chi-Squared =          39.99 using 59 PHA bins.
# Reduced chi-squared =         0.7270 for     55 degrees of freedom
# Null hypothesis probability =   9.360115e-01

Photon flux (15-150 keV)    in 0.048 sec: 5.89963 (    ) ph/cm2/s
Energy fluence (15-150 keV)             : 0 ( 0  0 ) ergs/cm2
S(25-50 keV) vs. S(50-100 keV) plot

S(25-50 keV)  = 5.27e-09
S(50-100 keV) = 7.93e-09
T90 vs. Hardness ratio plot

T90                                   = 0.0360000133514404 sec.
Hardness ratio (energy fluence ratio) = 1.50474
Color vs. Color plot

Count Ratio  (25-50 keV) / (15-25 keV) = 1.67842
Count Ratio (50-100 keV) / (15-25 keV) = 1.32634
Mask shadow pattern

IMX = 3.765145791083049E-01, IMY = -1.410852250382248E-01
TIME vs. PHA plot around the trigger time

Blue+Cyan dotted lines: Time interval of the scaled map
From 0.000000 to 0.032000
TIME vs. DetID plot around the trigger time

Blue+Cyan dotted lines: Time interval of the scaled map
From 0.000000 to 0.032000
100 us light curve (15-350 keV)

Blue+Cyan dotted lines: Time interval of the scaled map
From 0.000000 to 0.032000
Spacecraft aspect plot

Bright source in the pre-burst/pre-slew/post-slew images
Pre-burst image of 15-350 keV band
Time interval of the image:
-100.167400 0.008000

# RAcent  DECcent POSerr Theta    Phi  PeakCts   SNR AngSep     Name
#  [deg]    [deg]    ['] [deg]  [deg]                   [']
135.5520 -40.5878    1.5  42.3  164.5   1.3653   7.6    2.3	Vela X-1
117.9707 -50.2739    2.7  56.5  173.3   2.6944   4.2 ------	UNKNOWN
123.7540 -29.7594    2.5  37.5 -174.1   0.6076   4.7 ------	UNKNOWN
Pre-slew background subtracted image of 15-350 keV band
Time interval of the image:
0.008000 0.056000

# RAcent  DECcent POSerr Theta    Phi  PeakCts   SNR AngSep     Name
#  [deg]    [deg]    ['] [deg]  [deg]                   [']
135.5135 -40.6185    5.7  42.4  164.5  -0.0122  -2.0    3.9	Vela X-1
155.7681 -22.0505    2.7  23.9  131.4   0.0181   4.3 ------	UNKNOWN
164.1644  14.4658    1.1  21.9   20.5   0.0422  11.0 ------	UNKNOWN
116.2102 -34.5550    2.5  45.4 -172.1   0.0255   4.6 ------	UNKNOWN
Post-slew image of 15-350 keV band
Time interval of the image:
52.832600 962.783500

# RAcent  DECcent POSerr Theta    Phi  PeakCts   SNR AngSep     Name
#  [deg]    [deg]    ['] [deg]  [deg]                   [']
210.7524  43.3167    2.3  49.0   20.0   8.3299   5.0 ------	UNKNOWN
164.4606 -26.5279    2.6  41.0  155.1   4.2118   4.5 ------	UNKNOWN
190.7676  46.6979    2.9  39.1    4.7   2.6279   4.0 ------	UNKNOWN
171.9713  51.2562    2.8  37.3  -16.4   2.3165   4.2 ------	UNKNOWN
131.2189  -1.1523    4.4  36.2 -137.3   1.7203   2.7 ------	UNKNOWN
129.0817  52.3974    3.2  47.0  -53.1   7.9407   3.6 ------	UNKNOWN
Plot creation:
Sun May 31 04:05:00 EDT 2015