Special notes of this burst
Image
Pre-slew 15.0-350.0 keV image (Event data)
#   RAcent    DECcent   POSerr    Theta     Phi              Peak Cts       SNR   Name
  138.2544   -11.8551   0.0128    58.1917  -164.2665         9.1456107     14.800 TRIG_00352190

Foreground time interval of the image:
 -8.544  42.480 (delta_t =  51.024 [sec])
 43.480  80.781 (delta_t =  37.301 [sec])
Background time interval of the image:
-239.520  -8.544 (delta_t = 230.976 [sec])
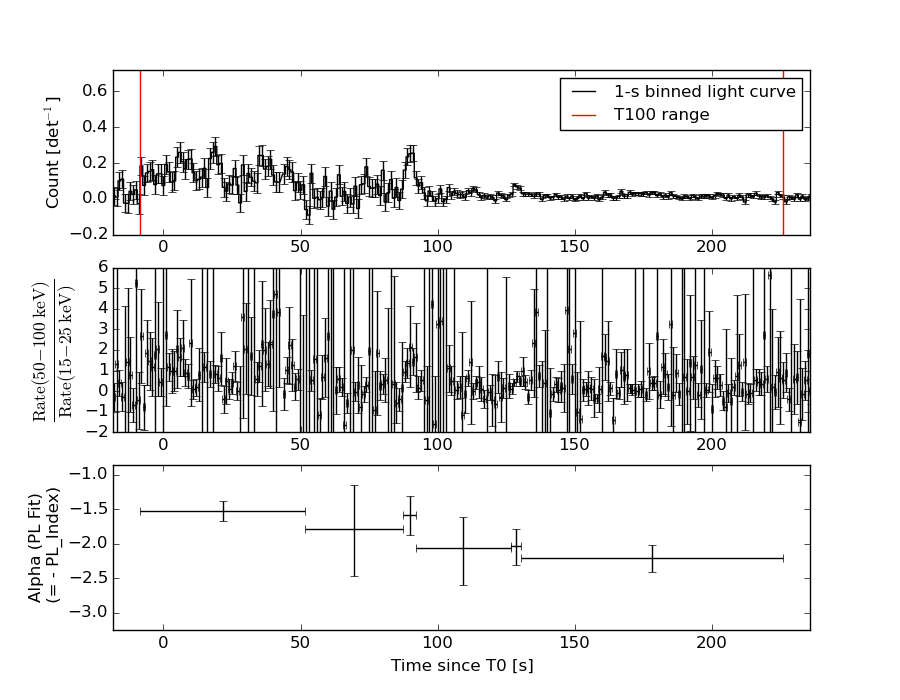
Lightcurves
Notes:
- 1) The mask-weighted light curves are using the flight position.
- 2) Multiple plots of different time binning/intervals are shown to cover all scenarios of short/long GRBs, rate/image triggers, and real/false positives.
- 3) For all the mask-weighted lightcurves, the y-axis units are counts/sec/det where a det is 0.4 x 0.4 = 0.16 sq cm.
- 4) The verticle lines correspond to following: green dotted lines are T50 interval, black dotted lines are T90 interval, blue solid line(s) is a spacecraft slew start time, and orange solid line(s) is a spacecraft slew end time.
- 5) Time of each bin is in the middle of the bin.
1 s binning
From T0-310 s to T0+310 s
From T100_start - 20 s to T100_end + 30 s

Full time interval

64 ms binning
Full time interval

From T100_start to T100_end

From T0-5 sec to T0+5 sec
16 ms binning
From T100_start-5 s to T100_start+5 s
Blue+Cyan dotted lines: Time interval of the scaled map
From 0.000000 to 26.880000
8 ms binning
From T100_start-3 s to T100_start+3 s

Blue+Cyan dotted lines: Time interval of the scaled map
From 0.000000 to 26.880000
2 ms binning
From T100_start-1 s to T100_start+1 s

Blue+Cyan dotted lines: Time interval of the scaled map
From 0.000000 to 26.880000
SN=5 or 10 sec. binning (whichever binning is satisfied first)
SN=5 or 10 sec. binning (T < 200 sec)

Quad-rate summed light curves (from T0-300s to T0+1000s)

Spectral Evolution
Spectra
Notes:
- 1) The fitting includes the systematic errors.
- 2) When the burst includes telescope slew time periods, the fitting uses an average response file made from multiple 5-s response files through out the slew time plus single time preiod for the non-slew times, and weighted by the total counts in the corresponding time period using addrmf. An average response file is needed becuase a spectral fit using the pre-slew DRM will introduce some errors in both a spectral shape and a normalization if the PHA file contains a lot of the slew/post-slew time interval.
- 3) For fits to more complicated models (e.g. a power-law over a cutoff power-law), the BAT team has decided to require a chi-square improvement of more than 6 for each extra dof.
Time averaged spectrum fit using the average DRM
Power-law model

Multiple GTIs in the spectrum
tstart tstop
-8.544000 42.480000
43.480000 225.744000

Spectral model in power-law:
------------------------------------------------------------
Parameters  : value       lower 90%   higher 90%
Photon index: 1.67279     ( -0.123676   0.125025 )
Norm@50keV  : 4.25551E-03    ( -0.000296576   0.00029525 )
------------------------------------------------------------
#Fit statistic : Chi-Squared =          45.65 using 59 PHA bins.
# Reduced chi-squared =         0.8009 for     57 degrees of freedom
# Null hypothesis probability =   8.597364e-01

Photon flux (15-150 keV)    in 233.3 sec: 0.559913 ( -0.0401708  0.0403458 ) ph/cm2/s
Energy fluence (15-150 keV)             : 9.21346e-06 ( -6.72004e-07  6.757e-07 ) ergs/cm2
Cutoff power-law model
Multiple GTIs in the spectrum
tstart tstop
-8.544000 42.480000
43.480000 225.744000
Spectral model in the cutoff power-law:
------------------------------------------------------------
Parameters  : value       lower 90%   higher 90%
Photon index: 1.67591     ( -0.127735   0.122502 )
Epeak [keV] : 9999.36      ( -9999.35 -9999.36 )
Norm@50keV  : 4.25488E-03    ( -0.0021028   0.00188789 )
------------------------------------------------------------
#Fit statistic : Chi-Squared =          45.67 using 59 PHA bins.
# Reduced chi-squared =         0.8155 for     56 degrees of freedom
# Null hypothesis probability =   8.364170e-01

Photon flux (15-150 keV)    in 233.3 sec: 0.560421 ( -0.040884  0.039643 ) ph/cm2/s
Energy fluence (15-150 keV)             : 9.20464e-06 ( -6.62735e-07  6.75543e-07 ) ergs/cm2
Band function

Multiple GTIs in the spectrum
tstart tstop
-8.544000 42.480000
43.480000 225.744000

Spectral model in the Band function:
------------------------------------------------------------
Parameters  : value       lower 90%   higher 90%
alpha       : -1.16211   ( 1.18171   1.18171 )
beta        : -1.72394    ( 1.72464   0.168497 )
Epeak [keV] : 56.6253      ( -57.7018 -57.7018 )
Norm@50keV   : 8.84416E-03    ( -0.00447339   0 )
------------------------------------------------------------
#Fit statistic : Chi-Squared =          45.36 using 59 PHA bins.
# Reduced chi-squared =         0.8248 for     55 degrees of freedom
# Null hypothesis probability =   8.197067e-01

Photon flux (15-150 keV)    in 233.3 sec:  (    ) ph/cm2/s
Energy fluence (15-150 keV)             : 0 ( 0  0 ) ergs/cm2
Single BB
Spectral model blackbody:
------------------------------------------------------------
Parameters  : value    Lower 90%  Upper 90%
kT [keV]    : 13.4891  (  )
R^2/D10^2   : 8.63315E-02  (   )
(R is the radius in km and D10 is the distance to the source in units of 10 kpc)
------------------------------------------------------------
#Fit statistic : Chi-Squared =         115.16 using 59 PHA bins.
# Reduced chi-squared =         2.0203 for     57 degrees of freedom
# Null hypothesis probability =   8.180656e-06

Energy  Fluence     90% Error
[keV]   [erg/cm2]   [erg/cm2]
15- 25  7.763e-07   1.071e-07
25- 50  2.780e-06   2.461e-07
50-150  3.266e-06   4.643e-07
15-150  6.822e-06   5.798e-07
Thermal bremsstrahlung (OTTB)
Spectral model: thermal bremsstrahlung
------------------------------------------------------------
Parameters  : value         Lower 90%    Upper 90%
kT [keV]    : 159.594       (-45.0616      -160.155)
Norm        : 2.26092       (-0.181593     0.210887)
------------------------------------------------------------
#Fit statistic : Chi-Squared =          49.10 using 59 PHA bins.
# Reduced chi-squared =         0.8614 for     57 degrees of freedom
# Null hypothesis probability =   7.623803e-01

Energy  Fluence     90% Error
[keV]   [erg/cm2]   [erg/cm2]
15- 25  1.347e-06   1.290e-07
25- 50  2.519e-06   3.957e-07
50-150  5.099e-06   2.155e-06
15-150  8.965e-06   2.391e-06
Double BB

Spectral model: bbodyrad<1> + bbodyrad<2>
------------------------------------------------------------
Parameters  : value         Lower 90%    Upper 90%
kT1 [keV]   : 8.37447        (-1.2372      1.29728)
R1^2/D10^2  : 0.393638        (-0.153644      0.291405)
kT2 [keV]   : 43.2608        (-13.1287      39.729)
R2^2/D10^2  : 1.19118E-03    (-0.000940045   0.00248704)
------------------------------------------------------------
#Fit statistic : Chi-Squared =          43.78 using 59 PHA bins.
# Reduced chi-squared =         0.7959 for     55 degrees of freedom
# Null hypothesis probability =   8.617681e-01

Energy  Fluence     90% Error
[keV]   [erg/cm2]   [erg/cm2]
15- 25  1.266e-06   2.713e-07
25- 50  2.717e-06   4.799e-07
50-150  5.328e-06   2.375e-06
15-150  9.311e-06   2.586e-06
Peak spectrum fit
Power-law model
Time interval is from    5.156 sec. to    6.156 sec.

Spectral model in power-law:
------------------------------------------------------------
Parameters  : value       lower 90%   higher 90%
Photon index: 2.45739     ( -0.48097   0.648597 )
Norm@50keV  : 1.20634E-02    ( -0.00552423   0.00533364 )
------------------------------------------------------------
#Fit statistic : Chi-Squared =          76.60 using 59 PHA bins.
# Reduced chi-squared =          1.344 for     57 degrees of freedom
# Null hypothesis probability =   4.266422e-02

Photon flux (15-150 keV)    in 1 sec: 2.30663 ( -0.925624  0.938177 ) ph/cm2/s
Energy fluence (15-150 keV)             : 1.19415e-07 ( -4.76232e-08  4.80375e-08 ) ergs/cm2
Cutoff power-law model
Time interval is from    5.156 sec. to    6.156 sec.
Spectral model in the cutoff power-law:
------------------------------------------------------------
Parameters  : value       lower 90%   higher 90%
Photon index: -2.83210     ( -6.73891   3.35533 )
Epeak [keV] : 52.3622      ( -14.3676 11.8647 )
Norm@50keV  : 3.08051    ( -3.26549   1010.41 )
------------------------------------------------------------
#Fit statistic : Chi-Squared =          68.22 using 59 PHA bins.
# Reduced chi-squared =          1.218 for     56 degrees of freedom
# Null hypothesis probability =   1.266829e-01

Photon flux (15-150 keV)    in 1 sec: 2.02219 ( -0.79373  0.93919 ) ph/cm2/s
Energy fluence (15-150 keV)             : 1.42205e-07 ( -4.84246e-08  4.9873e-08 ) ergs/cm2
Band function
Time interval is from    5.156 sec. to    6.156 sec.

Spectral model in the Band function:
------------------------------------------------------------
Parameters  : value       lower 90%   higher 90%
alpha       : 2.36420   ( -2.82127   -2.36373 )
beta        : -10.0000    ( 10   3.55271e-15 )
Epeak [keV] : 52.2319      ( -14.923 10.1849 )
Norm@50keV   : 1.96308    ( -1.96424   43.0273 )
------------------------------------------------------------
#Fit statistic : Chi-Squared =          68.27 using 59 PHA bins.
# Reduced chi-squared =          1.241 for     55 degrees of freedom
# Null hypothesis probability =   1.078908e-01

Photon flux (15-150 keV)    in 1 sec:  (    ) ph/cm2/s
Energy fluence (15-150 keV)             : 1.45109e-07 ( -1.45102e-07  -5.08385e-08 ) ergs/cm2
Single BB

Spectral model blackbody:
------------------------------------------------------------
Parameters  : value    Lower 90%  Upper 90%
kT [keV]    : 13.0278  (-2.9623  2.82531)
R^2/D10^2   : 0.496840  (-0.288995   0.797859)
(R is the radius in km and D10 is the distance to the source in units of 10 kpc)
------------------------------------------------------------
#Fit statistic : Chi-Squared =          68.34 using 59 PHA bins.
# Reduced chi-squared =          1.199 for     57 degrees of freedom
# Null hypothesis probability =   1.445564e-01

Energy  Fluence     90% Error
[keV]   [erg/cm2]   [erg/cm2]
15- 25  1.788e-08   1.106e-08
25- 50  6.174e-08   3.861e-08
50-150  6.633e-08   4.514e-08
15-150  1.460e-07   9.060e-08
Thermal bremsstrahlung (OTTB)
Spectral model: thermal bremsstrahlung
------------------------------------------------------------
Parameters  : value         Lower 90%    Upper 90%
kT [keV]    : 46.5816       (-20.3848      34.6755)
Norm        : 15.0730       (-6.57186     9.32183)
------------------------------------------------------------
#Fit statistic : Chi-Squared =          72.88 using 59 PHA bins.
# Reduced chi-squared =          1.279 for     57 degrees of freedom
# Null hypothesis probability =   7.651842e-02

Energy  Fluence     90% Error
[keV]   [erg/cm2]   [erg/cm2]
15- 25  3.622e-08   1.647e-08
25- 50  5.069e-08   2.337e-08
50-150  4.595e-08   3.381e-08
15-150  1.329e-07   7.201e-08
Double BB
Spectral model: bbodyrad<1> + bbodyrad<2>
------------------------------------------------------------
Parameters  : value         Lower 90%    Upper 90%
kT1 [keV]   : 2.25004        (-2.2413      17.9041)
R1^2/D10^2  : 365.300        (-433.226      -433.226)
kT2 [keV]   : 13.3071        (-3.02565      2.9955)
R2^2/D10^2  : 0.442679    (-0.27628   0.735061)
------------------------------------------------------------
#Fit statistic : Chi-Squared =          67.89 using 59 PHA bins.
# Reduced chi-squared =          1.234 for     55 degrees of freedom
# Null hypothesis probability =   1.137029e-01

Energy  Fluence     90% Error
[keV]   [erg/cm2]   [erg/cm2]
15- 25  2.561e-08   1.237e-08
25- 50  5.909e-08   3.613e-08
50-150  6.657e-08   4.615e-08
15-150  1.513e-07   8.880e-08
Pre-slew spectrum (Pre-slew PHA with pre-slew DRM)
Power-law model

Spectral model in power-law:
------------------------------------------------------------
Parameters  : value       lower 90%   higher 90%
Photon index: 1.55663     ( -0.151817   0.152394 )
Norm@50keV  : 8.53048E-03    ( -0.000720796   0.000720021 )
------------------------------------------------------------
#Fit statistic : Chi-Squared =          46.75 using 59 PHA bins.
# Reduced chi-squared =         0.8202 for     57 degrees of freedom
# Null hypothesis probability =   8.316122e-01

Photon flux (15-150 keV)    in 88.32 sec: 1.08199 ( -0.0996089  0.100122 ) ph/cm2/s
Energy fluence (15-150 keV)             : 7.08608e-06 ( -6.26934e-07  6.29034e-07 ) ergs/cm2
Cutoff power-law model
Spectral model in the cutoff power-law:
------------------------------------------------------------
Parameters  : value       lower 90%   higher 90%
Photon index: 1.55925     ( -0.430332   0.149697 )
Epeak [keV] : 9999.36      ( -9999.36 -9999.36 )
Norm@50keV  : 8.53886E-03    ( -0.00855177   0.00486924 )
------------------------------------------------------------
#Fit statistic : Chi-Squared =          46.77 using 59 PHA bins.
# Reduced chi-squared =         0.8351 for     56 degrees of freedom
# Null hypothesis probability =   8.055825e-01

Photon flux (15-150 keV)    in 88.32 sec: 1.08173 ( -0.099742  0.09861 ) ph/cm2/s
Energy fluence (15-150 keV)             : 7.08099e-06 ( -6.21022e-07  6.26436e-07 ) ergs/cm2
Band function

Spectral model in the Band function:
------------------------------------------------------------
Parameters  : value       lower 90%   higher 90%
alpha       : 4.85143   ( -4.85143   -4.85143 )
beta        : -1.57475    ( -0.161798   0.157049 )
Epeak [keV] : 21.1070      ( -21.107 6.36818 )
Norm@50keV   : 2039.42    ( -171.637   4.89073e+06 )
------------------------------------------------------------
#Fit statistic : Chi-Squared =          46.54 using 59 PHA bins.
# Reduced chi-squared =         0.8461 for     55 degrees of freedom
# Null hypothesis probability =   7.846250e-01

Photon flux (15-150 keV)    in 88.32 sec:  (    ) ph/cm2/s
Energy fluence (15-150 keV)             : 0 ( 0  0 ) ergs/cm2
S(25-50 keV) vs. S(50-100 keV) plot
S(25-50 keV)  = 2.47e-06
S(50-100 keV) = 3.09e-06
T90 vs. Hardness ratio plot

T90                                   = 181.00799998641 sec.
Hardness ratio (energy fluence ratio) = 1.25101
Color vs. Color plot
Count Ratio  (25-50 keV) / (15-25 keV) = 1.47292
Count Ratio (50-100 keV) / (15-25 keV) = 1.03153
Mask shadow pattern

IMX = -1.551903772399309E+00, IMY = 4.372005025302858E-01
TIME vs. PHA plot around the trigger time

Blue+Cyan dotted lines: Time interval of the scaled map
From 0.000000 to 26.880000
TIME vs. DetID plot around the trigger time

Blue+Cyan dotted lines: Time interval of the scaled map
From 0.000000 to 26.880000
100 us light curve (15-350 keV)

Blue+Cyan dotted lines: Time interval of the scaled map
From 0.000000 to 26.880000
Spacecraft aspect plot
Bright source in the pre-burst/pre-slew/post-slew images
Pre-burst image of 15-350 keV band
Time interval of the image:
-239.520000 -8.544000

# RAcent  DECcent POSerr Theta    Phi  PeakCts   SNR AngSep     Name
#  [deg]    [deg]    ['] [deg]  [deg]                   [']
145.3927  -2.7243    2.9  47.7 -158.2   1.4577   4.0 ------	UNKNOWN
151.9503  14.0858    3.3  36.2 -137.2   0.9551   3.5 ------	UNKNOWN
197.0440  67.3351    2.6  50.7  -44.4   4.3175   4.4 ------	UNKNOWN
Pre-slew background subtracted image of 15-350 keV band
Time interval of the image:
-8.544000 42.480000
43.480000 80.780600

# RAcent  DECcent POSerr Theta    Phi  PeakCts   SNR AngSep     Name
#  [deg]    [deg]    ['] [deg]  [deg]                   [']
150.4887 -20.3213    2.4  53.3  179.2   1.7308   4.9 ------	UNKNOWN
138.2545 -11.8551    0.8  58.2 -164.3   9.1318  13.8 ------	UNKNOWN
Post-slew image of 15-350 keV band
Time interval of the image:
155.380600 606.380600

# RAcent  DECcent POSerr Theta    Phi  PeakCts   SNR AngSep     Name
#  [deg]    [deg]    ['] [deg]  [deg]                   [']
135.5402 -40.5580    0.4  28.8  164.8  10.6120  32.3    0.6	Vela X-1
138.2680 -11.8874    1.7   0.0  175.9   1.8768   6.7 ------	UNKNOWN
124.2645  39.0957    3.9  52.6  -33.3   3.1587   2.9 ------	UNKNOWN
Plot creation:
Sun May 31 04:02:43 EDT 2015