Special notes of this burst
Image
Pre-slew 15.0-350.0 keV image (Event data)
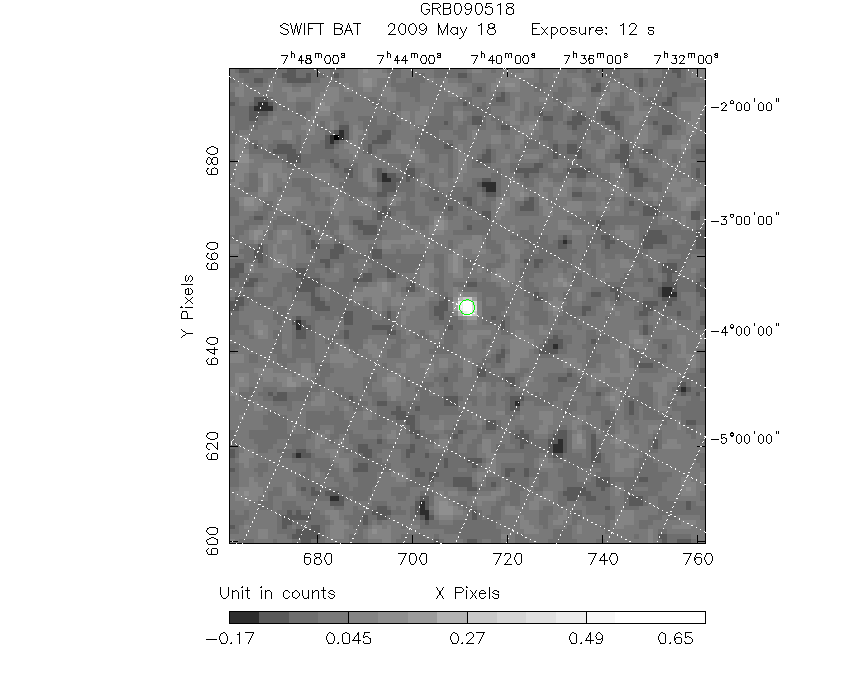
#   RAcent    DECcent   POSerr    Theta     Phi              Peak Cts       SNR   Name
  119.9477     0.7798   0.0103    26.8576   -45.7307         0.7893076     18.761 TRIG_00352420

Foreground time interval of the image:
 -2.480   9.677 (delta_t =  12.157 [sec])
Background time interval of the image:
-119.024  -2.480 (delta_t = 116.544 [sec])
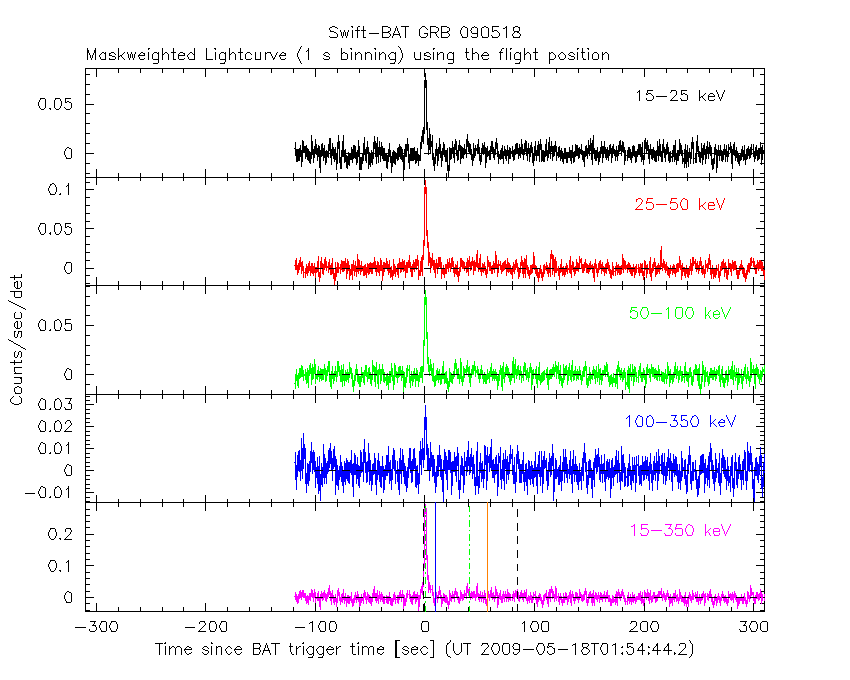
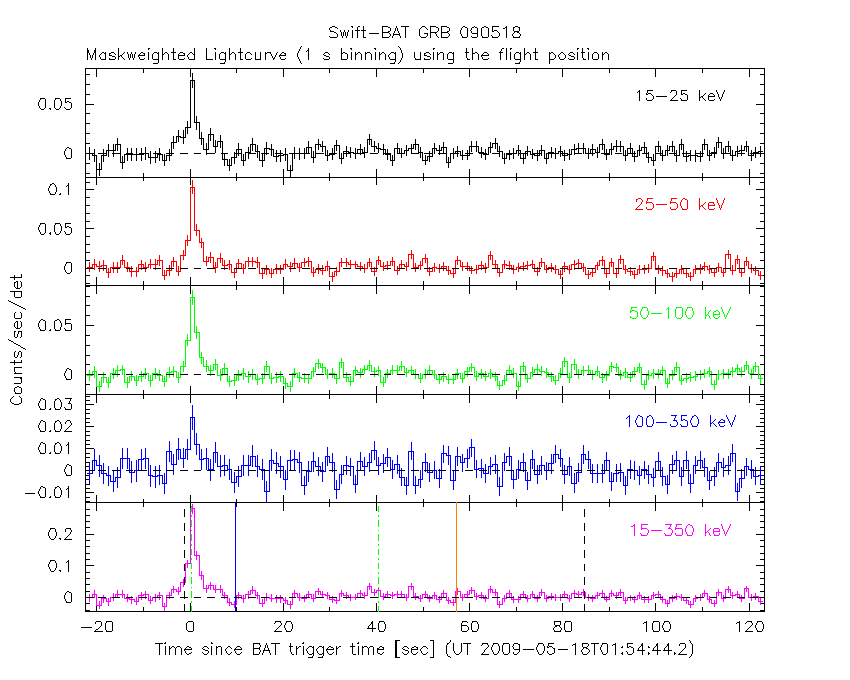
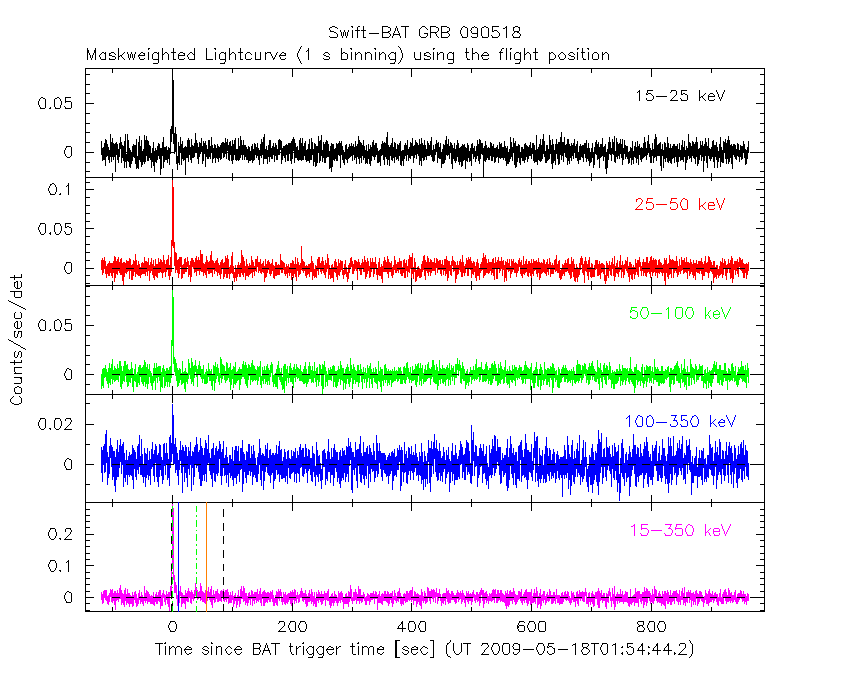
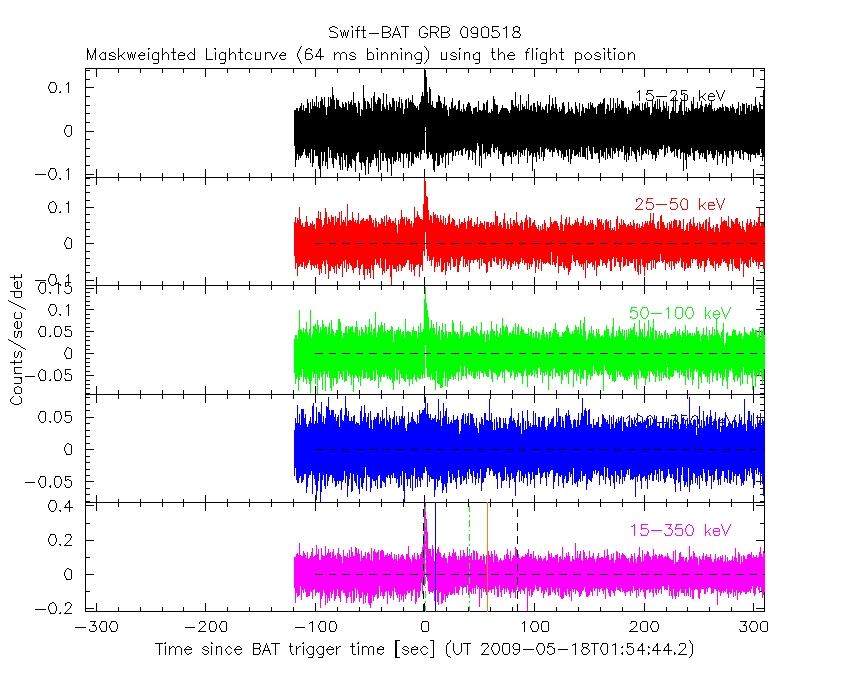
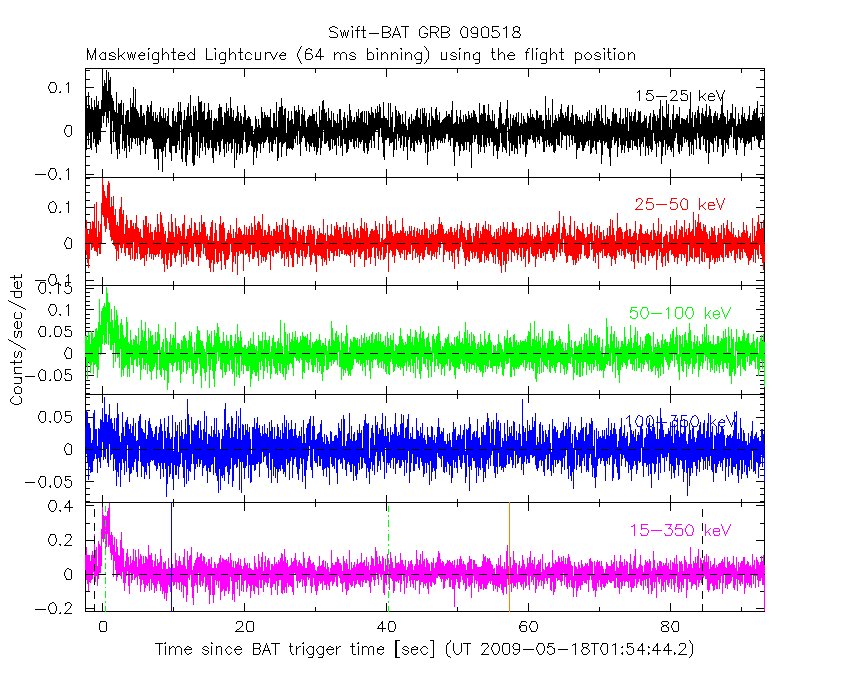
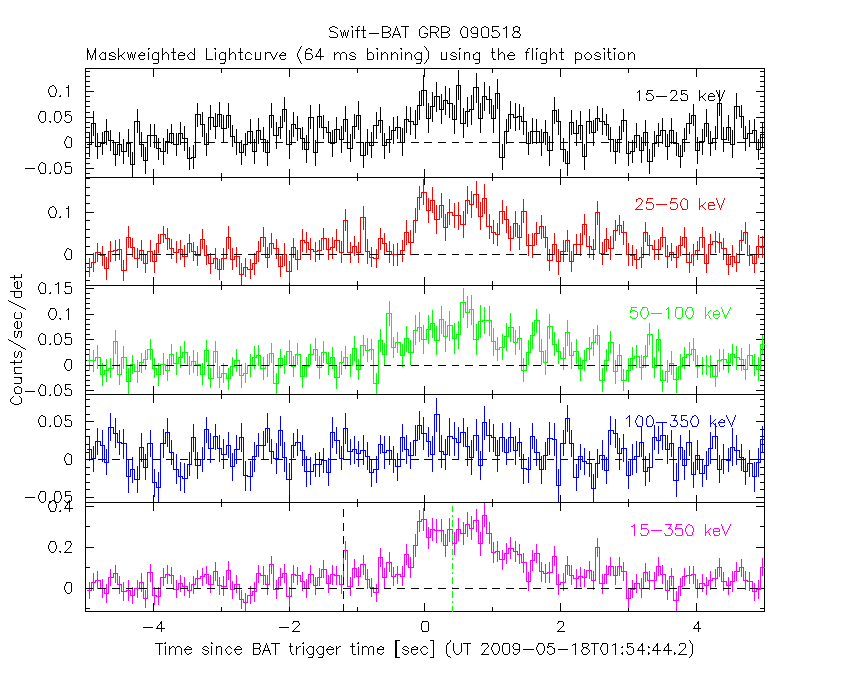
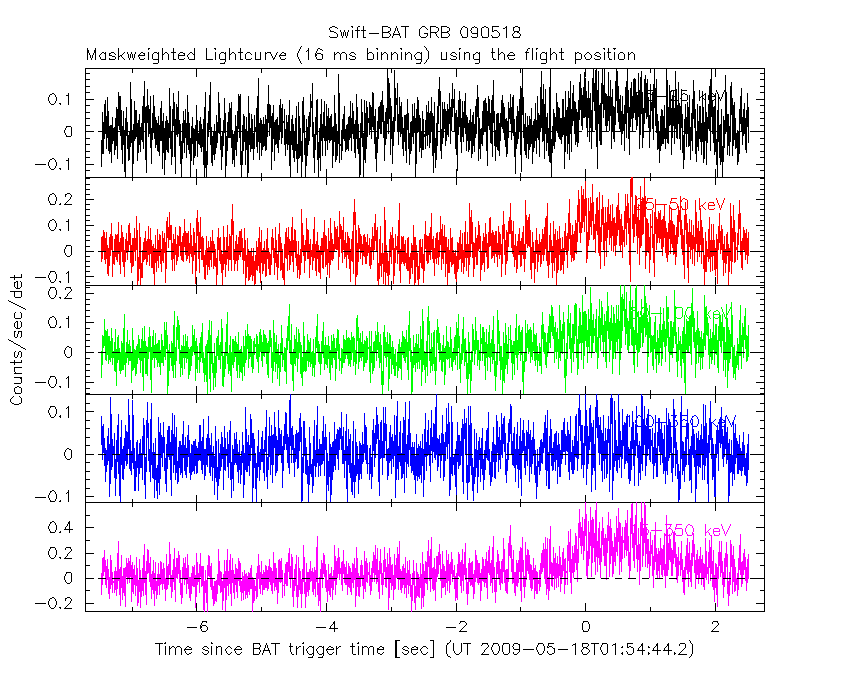
Lightcurves
Notes:
- 1) The mask-weighted light curves are using the flight position.
- 2) Multiple plots of different time binning/intervals are shown to cover all scenarios of short/long GRBs, rate/image triggers, and real/false positives.
- 3) For all the mask-weighted lightcurves, the y-axis units are counts/sec/det where a det is 0.4 x 0.4 = 0.16 sq cm.
- 4) The verticle lines correspond to following: green dotted lines are T50 interval, black dotted lines are T90 interval, blue solid line(s) is a spacecraft slew start time, and orange solid line(s) is a spacecraft slew end time.
- 5) Time of each bin is in the middle of the bin.
1 s binning
From T0-310 s to T0+310 s
From T100_start - 20 s to T100_end + 30 s
Full time interval
64 ms binning
Full time interval
From T100_start to T100_end
From T0-5 sec to T0+5 sec
16 ms binning
From T100_start-5 s to T100_start+5 s
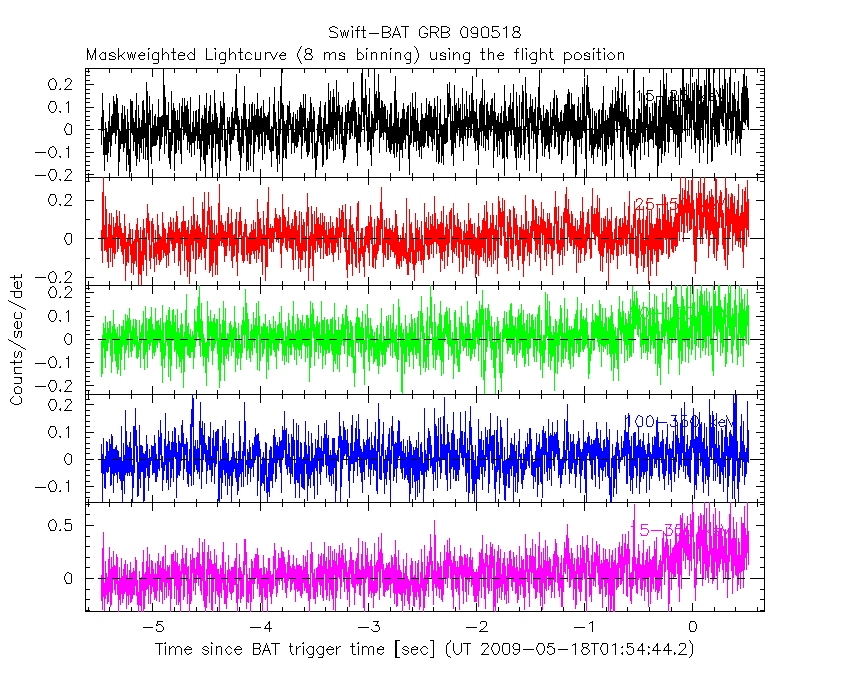
8 ms binning
From T100_start-3 s to T100_start+3 s
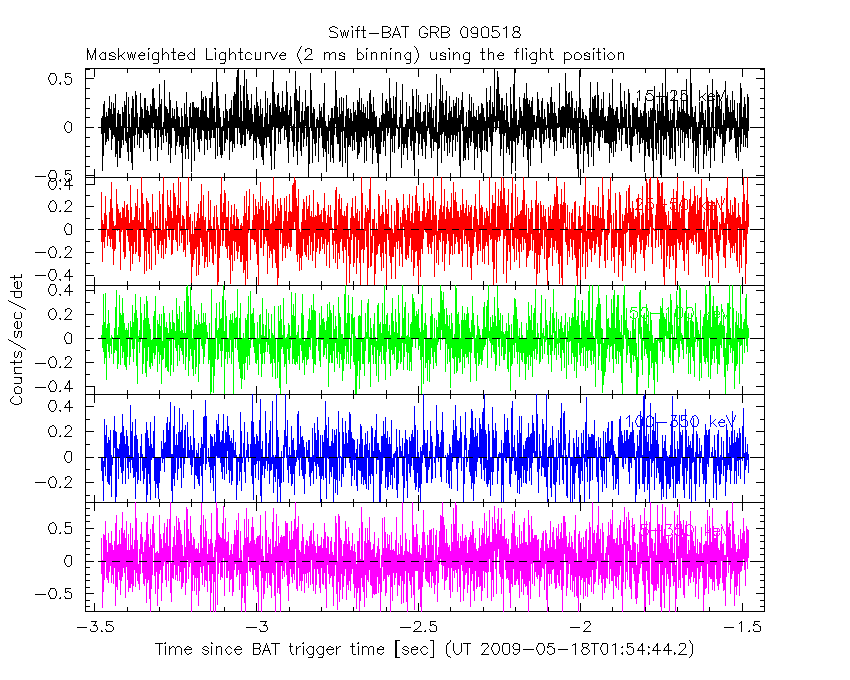
2 ms binning
From T100_start-1 s to T100_start+1 s
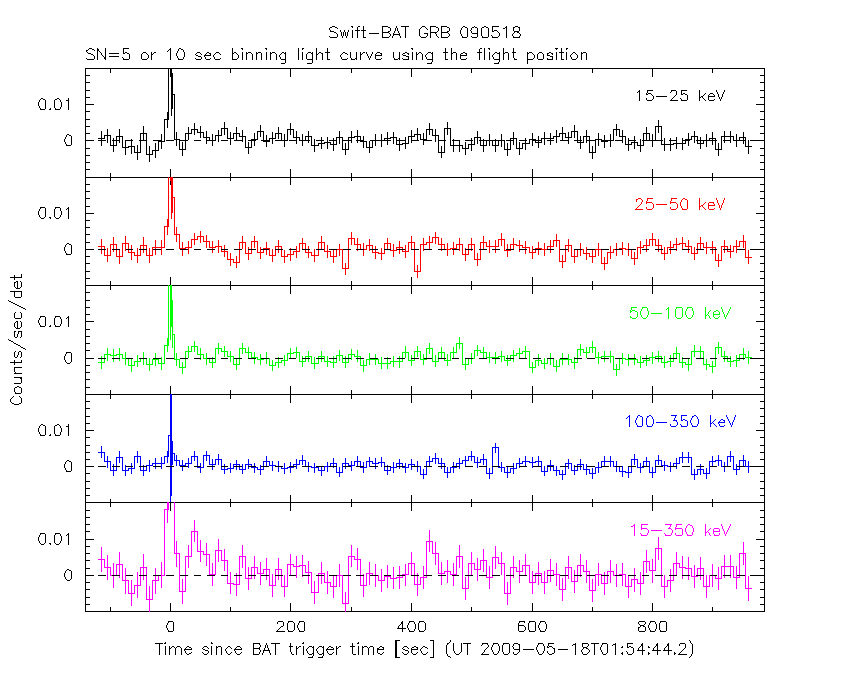
SN=5 or 10 sec. binning (whichever binning is satisfied first)
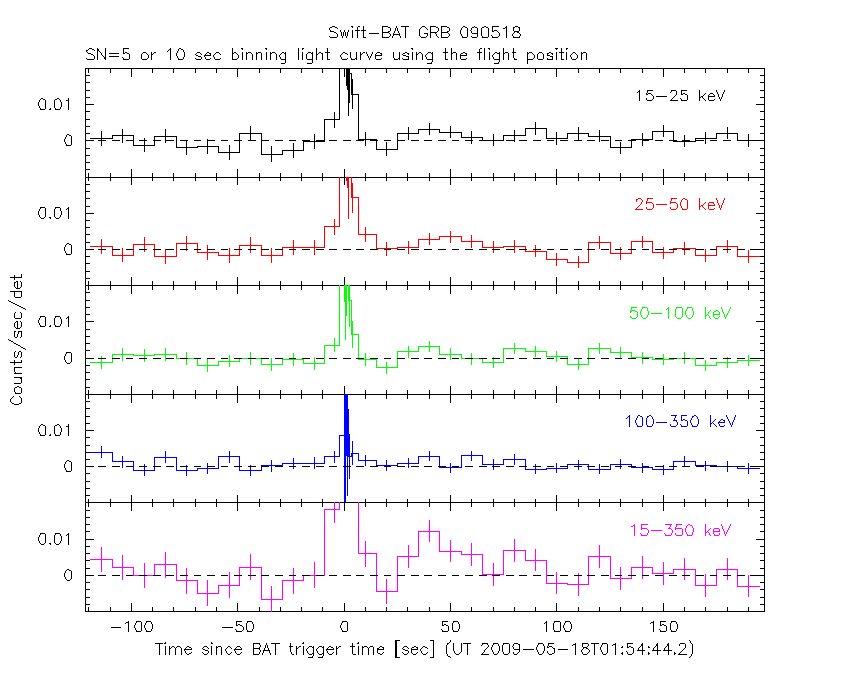
SN=5 or 10 sec. binning (T < 200 sec)
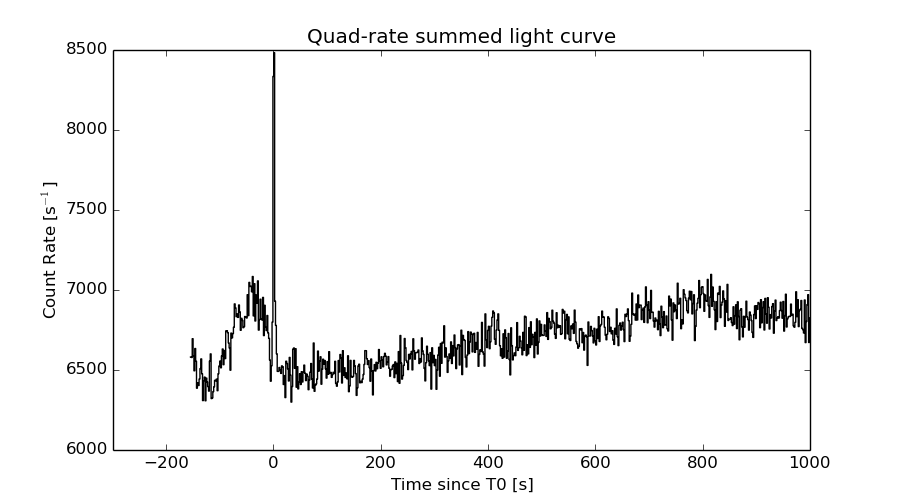
Quad-rate summed light curves (from T0-300s to T0+1000s)
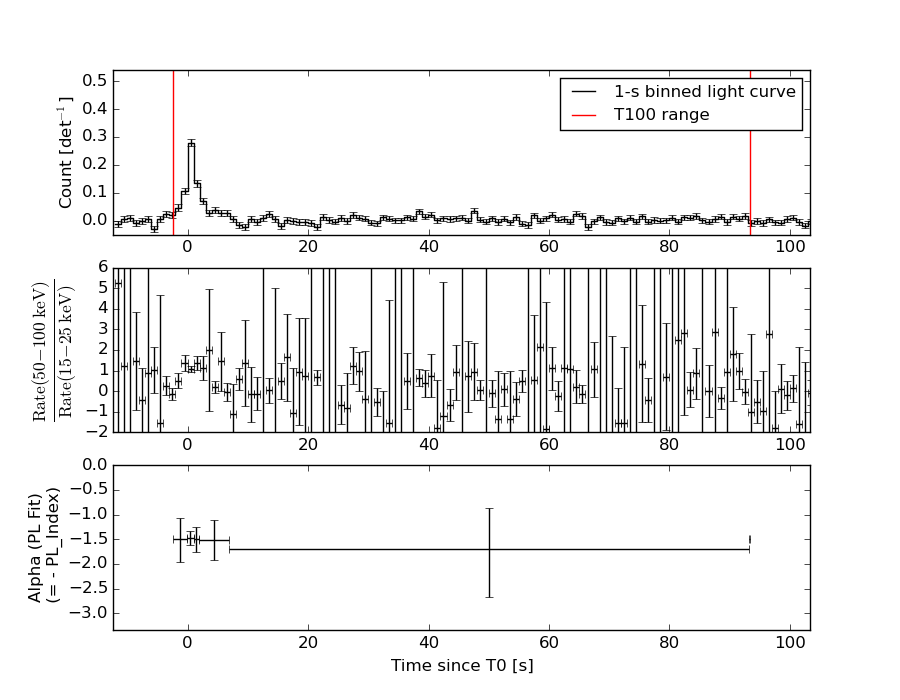
Spectral Evolution
Spectra
Notes:
- 1) The fitting includes the systematic errors.
- 2) When the burst includes telescope slew time periods, the fitting uses an average response file made from multiple 5-s response files through out the slew time plus single time preiod for the non-slew times, and weighted by the total counts in the corresponding time period using addrmf. An average response file is needed becuase a spectral fit using the pre-slew DRM will introduce some errors in both a spectral shape and a normalization if the PHA file contains a lot of the slew/post-slew time interval.
- 3) For fits to more complicated models (e.g. a power-law over a cutoff power-law), the BAT team has decided to require a chi-square improvement of more than 6 for each extra dof.
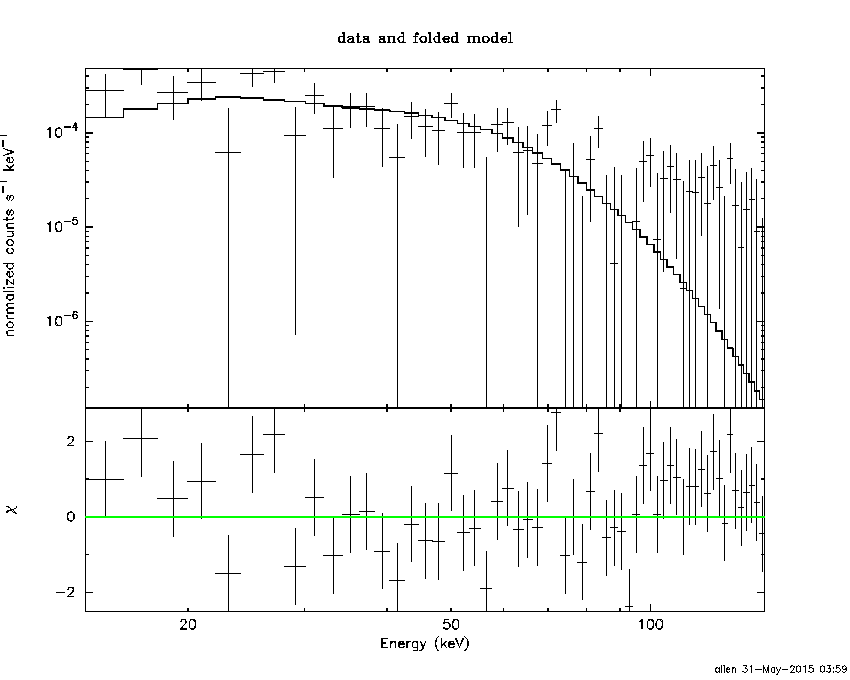
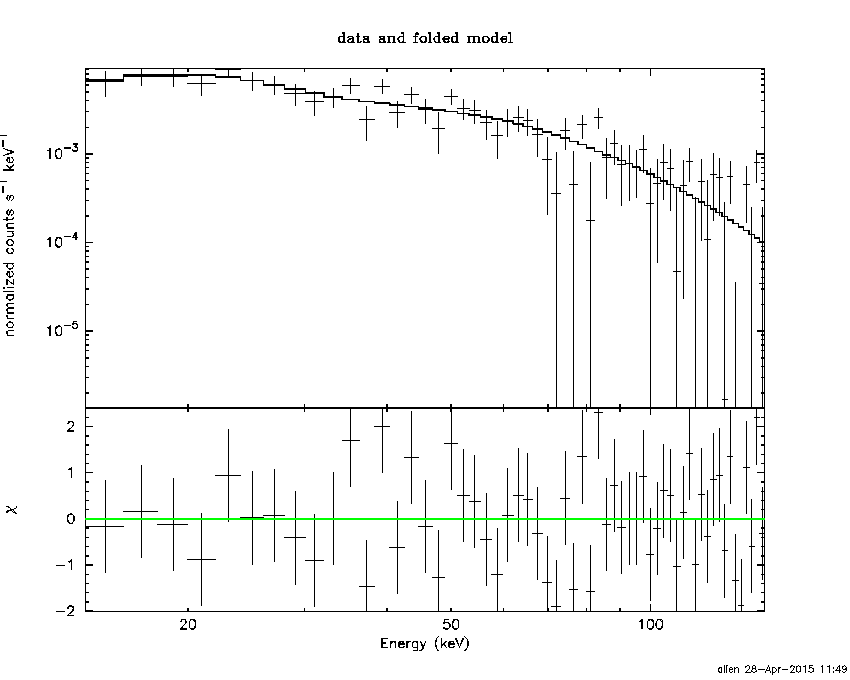
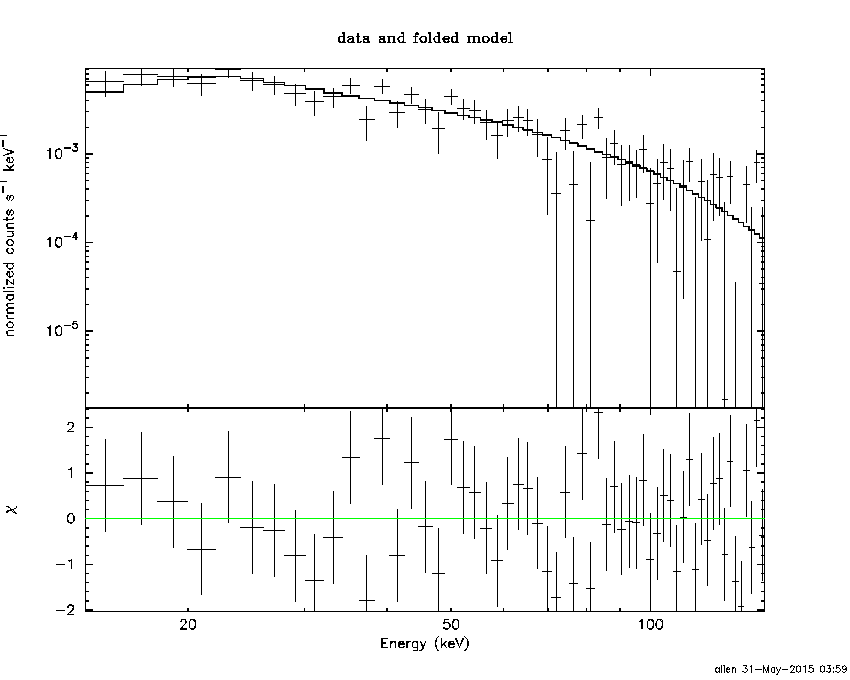
Time averaged spectrum fit using the average DRM
Power-law model
Time interval is from   -2.480 sec. to   93.328 sec.

Spectral model in power-law:
------------------------------------------------------------
Parameters  : value       lower 90%   higher 90%
Photon index: 1.53107     ( -0.263232   0.267698 )
Norm@50keV  : 7.24091E-04    ( -0.00011102   0.000109121 )
------------------------------------------------------------
#Fit statistic : Chi-Squared =          61.61 using 59 PHA bins.
# Reduced chi-squared =          1.081 for     57 degrees of freedom
# Null hypothesis probability =   3.147171e-01

Photon flux (15-150 keV)    in 95.81 sec: 9.11715E-02 ( -0.0131752  0.0131907 ) ph/cm2/s
Energy fluence (15-150 keV)             : 6.54923e-07 ( -1.09631e-07  1.11813e-07 ) ergs/cm2
Cutoff power-law model
Time interval is from   -2.480 sec. to   93.328 sec.
Spectral model in the cutoff power-law:
------------------------------------------------------------
Parameters  : value       lower 90%   higher 90%
Photon index: 1.53329     ( -0.457898   0.26492 )
Epeak [keV] : 9999.36      ( -9999.36 -9999.36 )
Norm@50keV  : 7.25372E-04    ( -0.000111335   0.00118933 )
------------------------------------------------------------
#Fit statistic : Chi-Squared =          61.61 using 59 PHA bins.
# Reduced chi-squared =          1.100 for     56 degrees of freedom
# Null hypothesis probability =   2.822590e-01

Photon flux (15-150 keV)    in 95.81 sec: 9.12348E-02 ( -0.0132475  0.0131012 ) ph/cm2/s
Energy fluence (15-150 keV)             : 6.53043e-07 ( -1.11714e-07  1.11641e-07 ) ergs/cm2
Band function

Time interval is from   -2.480 sec. to   93.328 sec.

Spectral model in the Band function:
------------------------------------------------------------
Parameters  : value       lower 90%   higher 90%
alpha       : -1.22289   ( 1.22283   1.22283 )
beta        : -1.53151    ( 1.53148   0.263795 )
Epeak [keV] : 42.8699      ( -42.5903 -42.5903 )
Norm@50keV   : 1.37481E-03    ( -0.000770591   0 )
------------------------------------------------------------
#Fit statistic : Chi-Squared =          61.61 using 59 PHA bins.
# Reduced chi-squared =          1.120 for     55 degrees of freedom
# Null hypothesis probability =   2.516495e-01

Photon flux (15-150 keV)    in 95.81 sec:  (    ) ph/cm2/s
Energy fluence (15-150 keV)             : 0 ( 0  0 ) ergs/cm2
Single BB
Spectral model blackbody:
------------------------------------------------------------
Parameters  : value    Lower 90%  Upper 90%
kT [keV]    : 13.3097  (-2.39154  3.10709)
R^2/D10^2   : 1.51999E-02  (-0.00797206   0.0157279)
(R is the radius in km and D10 is the distance to the source in units of 10 kpc)
------------------------------------------------------------
#Fit statistic : Chi-Squared =          76.30 using 59 PHA bins.
# Reduced chi-squared =          1.339 for     57 degrees of freedom
# Null hypothesis probability =   4.482815e-02

Energy  Fluence     90% Error
[keV]   [erg/cm2]   [erg/cm2]
15- 25  5.468e-08   1.739e-08
25- 50  1.931e-07   4.992e-08
50-150  2.192e-07   7.358e-08
15-150  4.670e-07   1.045e-07
Thermal bremsstrahlung (OTTB)
Spectral model: thermal bremsstrahlung
------------------------------------------------------------
Parameters  : value         Lower 90%    Upper 90%
kT [keV]    : 199.351       (-97.9165      -199.362)
Norm        : 0.370522       (-0.0530343     0.0530867)
------------------------------------------------------------
#Fit statistic : Chi-Squared =          62.32 using 59 PHA bins.
# Reduced chi-squared =          1.093 for     57 degrees of freedom
# Null hypothesis probability =   2.927800e-01

Energy  Fluence     90% Error
[keV]   [erg/cm2]   [erg/cm2]
15- 25  8.840e-08   5.030e-08
25- 50  1.700e-07   9.452e-08
50-150  3.729e-07   2.085e-07
15-150  6.314e-07   3.523e-07
Double BB
------------------------------------------------------------
Parameters  : value         Lower 90%    Upper 90%
kT1 [keV]   : 9.07459        (-3.96101      3.02491)
R1^2/D10^2  : 4.95741E-02        (-0.0358211      0.314276)
kT2 [keV]   : 81.4645        (-51.4834      -71.5159)
R2^2/D10^2  : 5.48291E-05    (   )
------------------------------------------------------------
#Fit statistic : Chi-Squared =          62.24 using 59 PHA bins.
#Fit statistic : Chi-Squared =          62.20 using 59 PHA bins.
# Reduced chi-squared =          1.132 for     55 degrees of freedom
# Reduced chi-squared =          1.131 for     55 degrees of freedom
# Null hypothesis probability =   2.343275e-01
# Null hypothesis probability =   2.351519e-01

Energy  Fluence     90% Error
[keV]   [erg/cm2]   [erg/cm2]
15- 25  8.052e-08   4.259e-08
25- 50  1.828e-07   8.936e-08
50-150  4.210e-07   2.136e-07
15-150  6.844e-07   3.227e-07
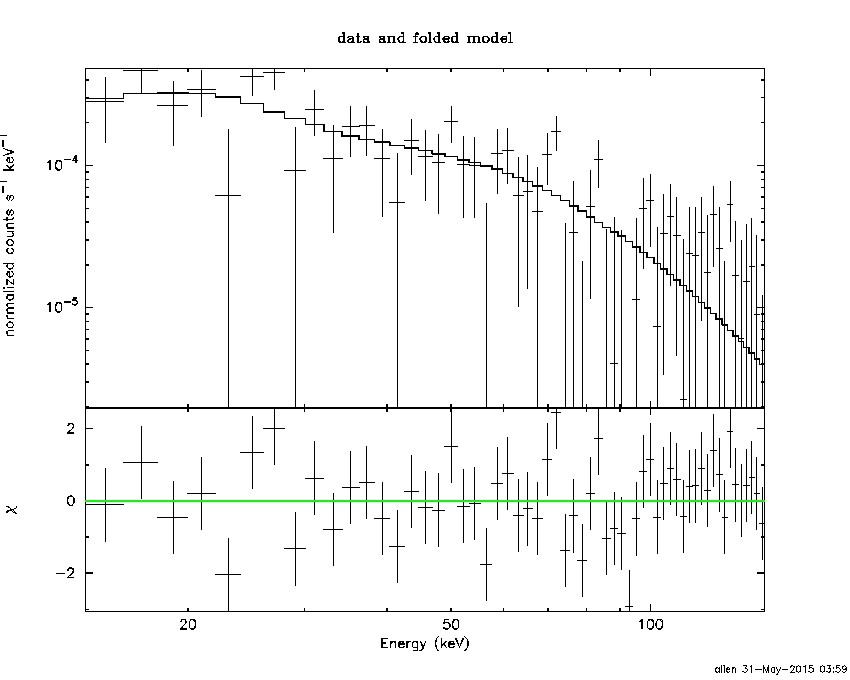
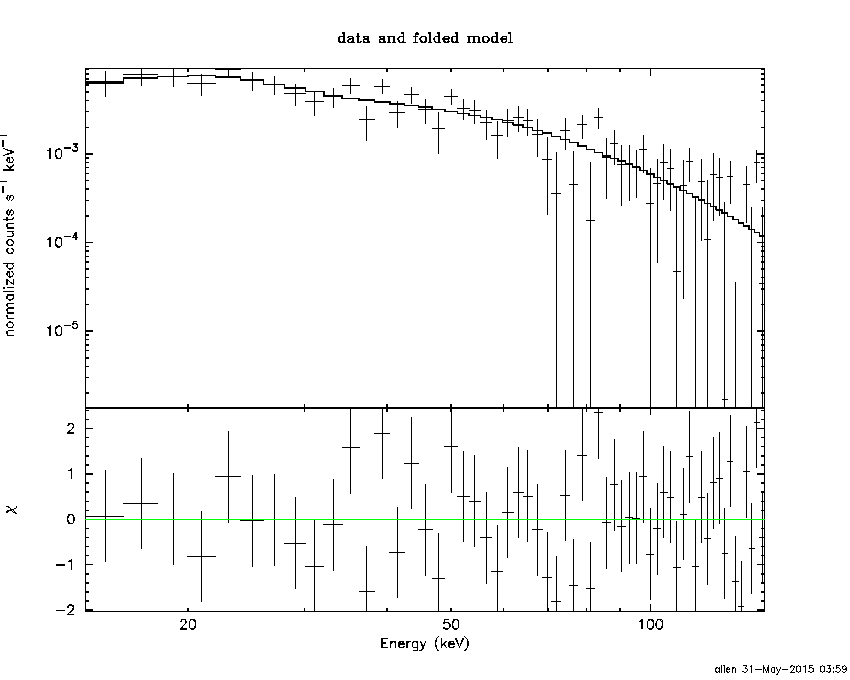
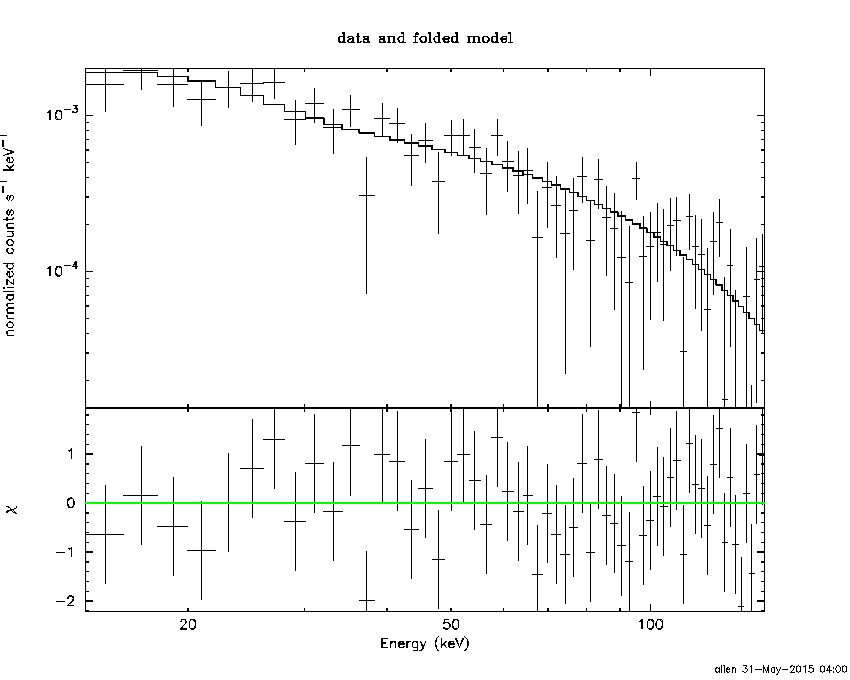
Peak spectrum fit
Power-law model
Time interval is from   -0.068 sec. to    0.932 sec.

Spectral model in power-law:
------------------------------------------------------------
Parameters  : value       lower 90%   higher 90%
Photon index: 1.50145     ( -0.140446   0.142382 )
Norm@50keV  : 1.88821E-02    ( -0.00161098   0.0016004 )
------------------------------------------------------------
#Fit statistic : Chi-Squared =          62.64 using 59 PHA bins.
# Reduced chi-squared =          1.099 for     57 degrees of freedom
# Null hypothesis probability =   2.830798e-01

Photon flux (15-150 keV)    in 1 sec: 2.35814 ( -0.193641  0.193756 ) ph/cm2/s
Energy fluence (15-150 keV)             : 1.79078e-07 ( -1.68174e-08  1.69856e-08 ) ergs/cm2
Cutoff power-law model
Time interval is from   -0.068 sec. to    0.932 sec.
Spectral model in the cutoff power-law:
------------------------------------------------------------
Parameters  : value       lower 90%   higher 90%
Photon index: 1.11946     ( -0.636019   0.450302 )
Epeak [keV] : 112.061      ( -43.5995 -112.068 )
Norm@50keV  : 2.98374E-02    ( -0.0133483   0.0333065 )
------------------------------------------------------------
#Fit statistic : Chi-Squared =          61.28 using 59 PHA bins.
# Reduced chi-squared =          1.094 for     56 degrees of freedom
# Null hypothesis probability =   2.924638e-01

Photon flux (15-150 keV)    in 1 sec: 2.32249 ( -0.20129  0.20028 ) ph/cm2/s
Energy fluence (15-150 keV)             : 1.73581e-07 ( -1.899e-08  1.885e-08 ) ergs/cm2
Band function
Time interval is from   -0.068 sec. to    0.932 sec.

Spectral model in the Band function:
------------------------------------------------------------
Parameters  : value       lower 90%   higher 90%
alpha       : -0.680755   ( 0.679984   0.679984 )
beta        : -1.74941    ( 1.75185   0.316843 )
Epeak [keV] : 66.0302      ( -66.305 523.147 )
Norm@50keV   : 5.54375E-02    ( -0.055273   1106.72 )
------------------------------------------------------------
#Fit statistic : Chi-Squared =          60.44 using 59 PHA bins.
# Reduced chi-squared =          1.099 for     55 degrees of freedom
# Null hypothesis probability =   2.857198e-01

Photon flux (15-150 keV)    in 1 sec:  (    ) ph/cm2/s
Energy fluence (15-150 keV)             : 0 ( 0  0 ) ergs/cm2
Single BB
Spectral model blackbody:
------------------------------------------------------------
Parameters  : value    Lower 90%  Upper 90%
kT [keV]    : 13.9781  (-1.37215  1.56952)
R^2/D10^2   : 0.344222  (-0.107888   0.151622)
(R is the radius in km and D10 is the distance to the source in units of 10 kpc)
------------------------------------------------------------
#Fit statistic : Chi-Squared =          89.26 using 59 PHA bins.
# Reduced chi-squared =          1.566 for     57 degrees of freedom
# Null hypothesis probability =   4.050980e-03

Energy  Fluence     90% Error
[keV]   [erg/cm2]   [erg/cm2]
15- 25  1.421e-08   2.130e-09
25- 50  5.277e-08   5.355e-09
50-150  6.783e-08   1.162e-08
15-150  1.348e-07   1.315e-08
Thermal bremsstrahlung (OTTB)
Spectral model: thermal bremsstrahlung
------------------------------------------------------------
Parameters  : value         Lower 90%    Upper 90%
kT [keV]    : 200.000       (      )
Norm        : 9.65454       (-0.782612     0.782593)
------------------------------------------------------------
#Fit statistic : Chi-Squared =          61.63 using 59 PHA bins.
# Reduced chi-squared =          1.081 for     57 degrees of freedom
# Null hypothesis probability =   3.140718e-01

Energy  Fluence     90% Error
[keV]   [erg/cm2]   [erg/cm2]
15- 25  2.404e-08   2.435e-09
25- 50  4.625e-08   1.132e-08
50-150  1.014e-07   4.810e-08
15-150  1.717e-07   5.264e-08
Double BB
Spectral model: bbodyrad<1> + bbodyrad<2>
------------------------------------------------------------
Parameters  : value         Lower 90%    Upper 90%
kT1 [keV]   : 8.71664        (-2.56562      2.23192)
R1^2/D10^2  : 1.26765        (-0.623932      2.28434)
kT2 [keV]   : 32.9085        (-11.7492      56.6647)
R2^2/D10^2  : 1.23409E-02    (-0.0113336   0.0502526)
------------------------------------------------------------
#Fit statistic : Chi-Squared =          62.18 using 59 PHA bins.
# Reduced chi-squared =          1.131 for     55 degrees of freedom
# Null hypothesis probability =   2.357478e-01

Energy  Fluence     90% Error
[keV]   [erg/cm2]   [erg/cm2]
15- 25  2.040e-08   6.453e-09
25- 50  4.984e-08   1.570e-08
50-150  1.054e-07   5.202e-08
15-150  1.756e-07   6.968e-08
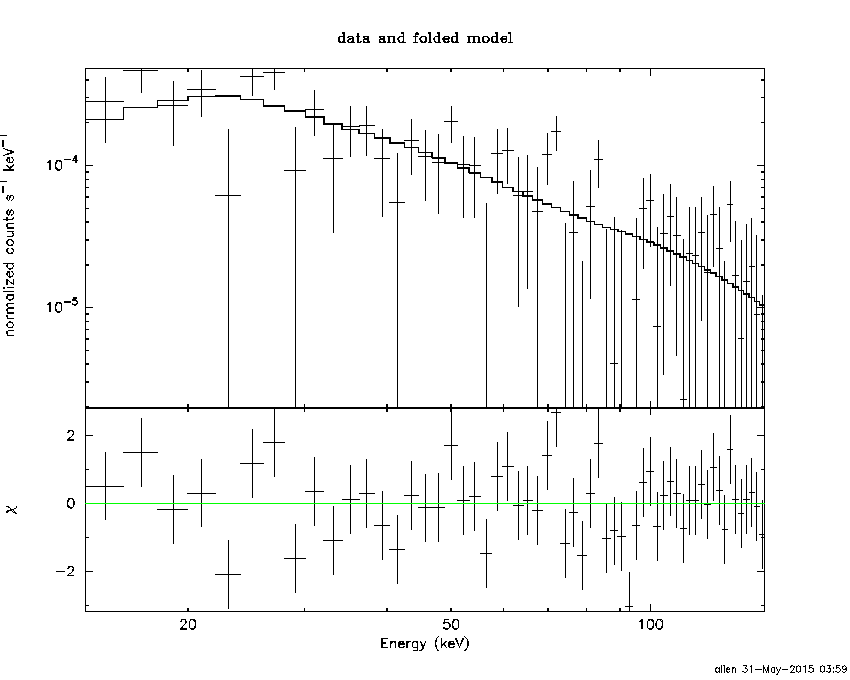
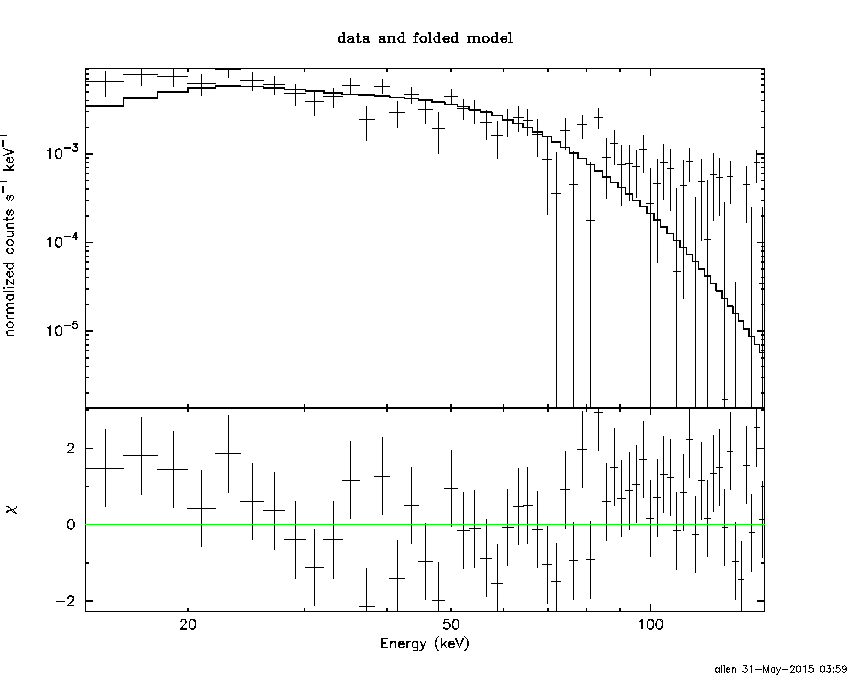
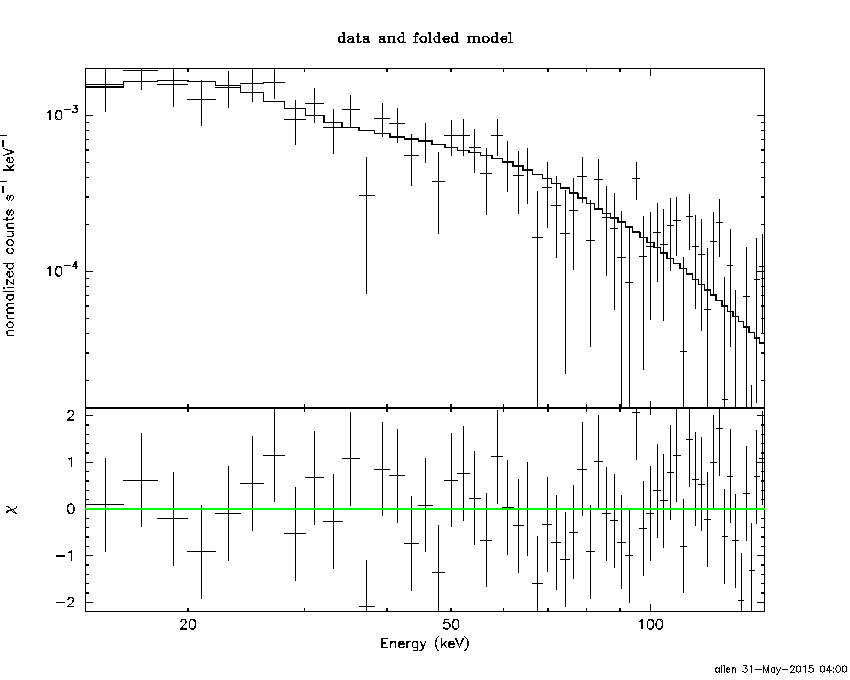
Pre-slew spectrum (Pre-slew PHA with pre-slew DRM)
Power-law model

Spectral model in power-law:
------------------------------------------------------------
Parameters  : value       lower 90%   higher 90%
Photon index: 1.43022     ( -0.161294   0.161388 )
Norm@50keV  : 4.11524E-03    ( -0.000364144   0.000362827 )
------------------------------------------------------------
#Fit statistic : Chi-Squared =          47.30 using 59 PHA bins.
# Reduced chi-squared =         0.8299 for     57 degrees of freedom
# Null hypothesis probability =   8.165098e-01

Photon flux (15-150 keV)    in 12.16 sec: 0.504706 ( -0.0450727  0.04521 ) ph/cm2/s
Energy fluence (15-150 keV)             : 4.80643e-07 ( -4.73023e-08  4.77051e-08 ) ergs/cm2
Cutoff power-law model
Spectral model in the cutoff power-law:
------------------------------------------------------------
Parameters  : value       lower 90%   higher 90%
Photon index: 2.26814     ( -0.167072   0.159446 )
Epeak [keV] : 95.7895      ( -9999.36 -9999.36 )
Norm@50keV  : 1.44872E-03    (     )
------------------------------------------------------------
#Fit statistic : Chi-Squared =          46.63 using 59 PHA bins.
# Reduced chi-squared =         0.8326 for     56 degrees of freedom
# Null hypothesis probability =   8.096656e-01

Photon flux (15-150 keV)    in 12.16 sec: 0.505370 ( -0.045785  0.044446 ) ph/cm2/s
Energy fluence (15-150 keV)             : 4.78239e-07 ( -4.51999e-08  4.90765e-08 ) ergs/cm2
Band function
Spectral model in the Band function:
------------------------------------------------------------
Parameters  : value       lower 90%   higher 90%
alpha       : -1.14160   ( 1.14201   1.14201 )
beta        : -1.43020    ( 1.43021   0.161343 )
Epeak [keV] : 38.0566      ( -37.7185 -37.7185 )
Norm@50keV   : 8.13887E-03    ( -0.00377845   14.1075 )
------------------------------------------------------------
#Fit statistic : Chi-Squared =          47.30 using 59 PHA bins.
# Reduced chi-squared =         0.8600 for     55 degrees of freedom
# Null hypothesis probability =   7.601772e-01

Photon flux (15-150 keV)    in 12.16 sec:  (    ) ph/cm2/s
Energy fluence (15-150 keV)             : 0 ( 0  0 ) ergs/cm2
S(25-50 keV) vs. S(50-100 keV) plot
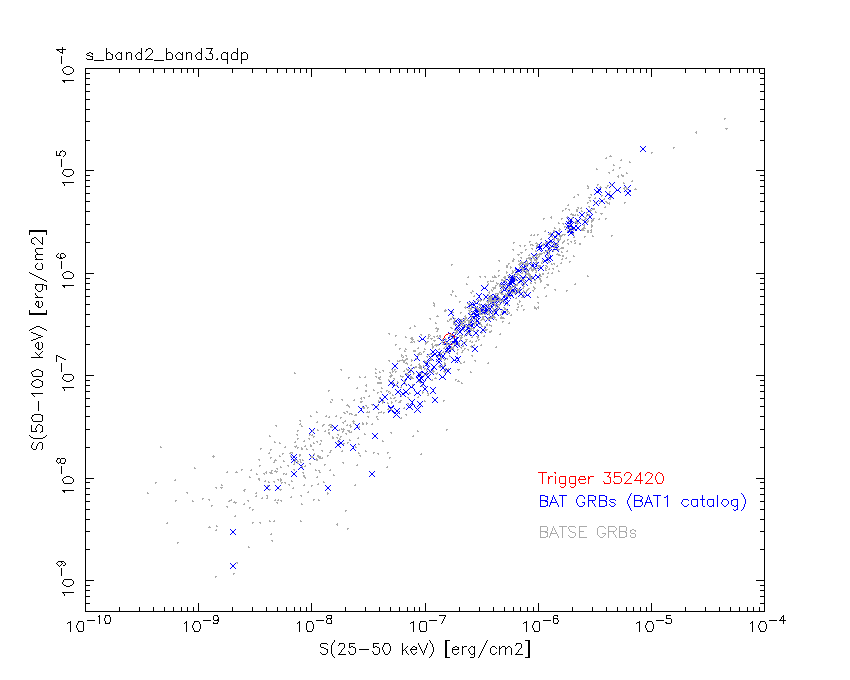
S(25-50 keV)  = 1.64e-07
S(50-100 keV) = 2.28e-07
T90 vs. Hardness ratio plot
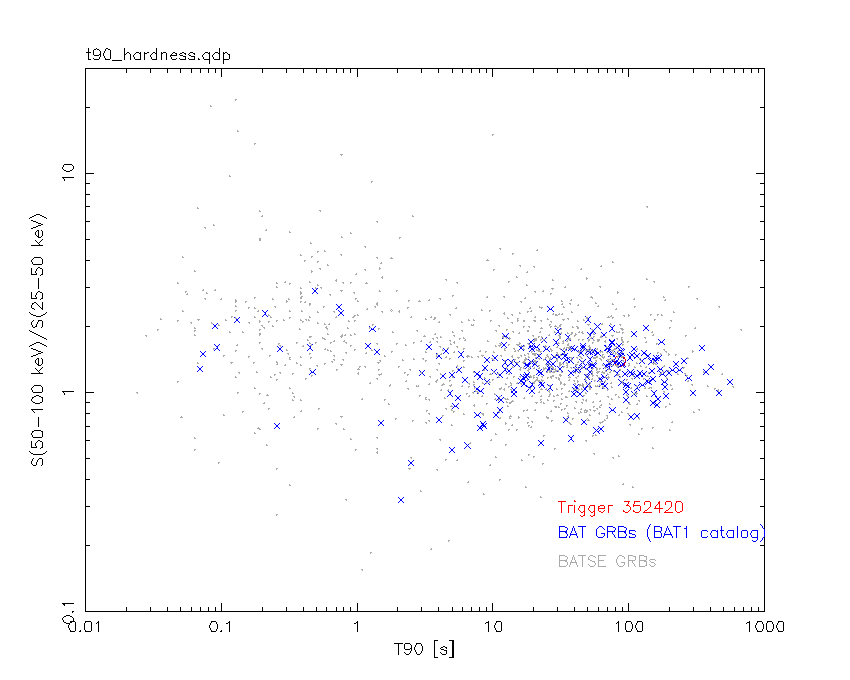
T90                                   = 85.8240000009537 sec.
Hardness ratio (energy fluence ratio) = 1.39024
Color vs. Color plot
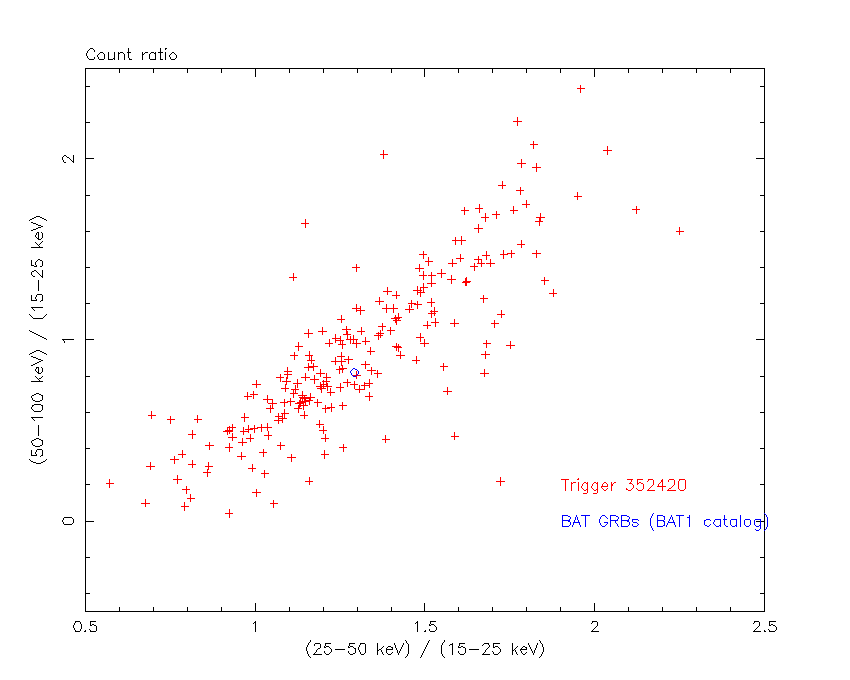
Count Ratio  (25-50 keV) / (15-25 keV) = 1.2923
Count Ratio (50-100 keV) / (15-25 keV) = 0.821354
Mask shadow pattern
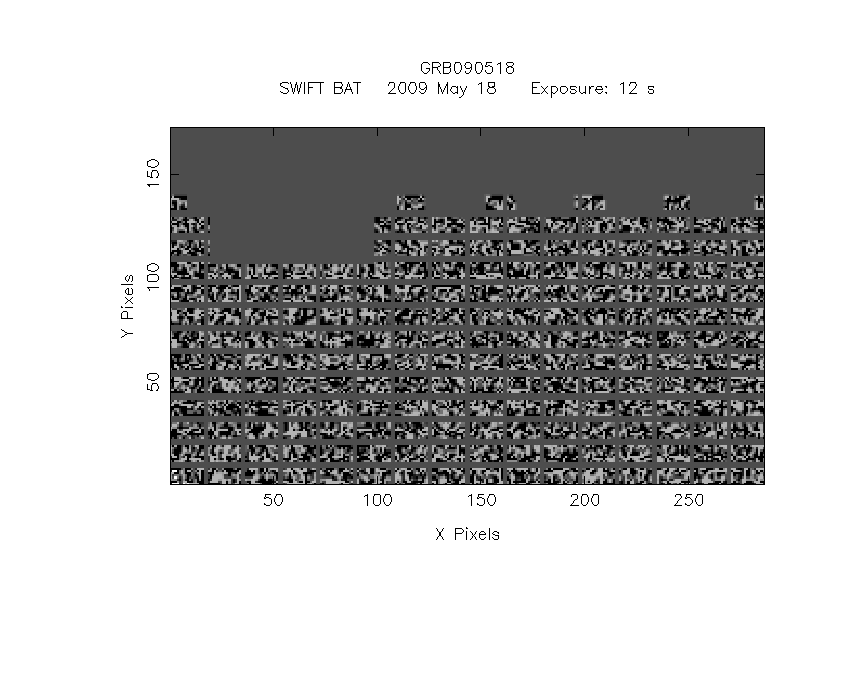
IMX = 3.534827324777359E-01, IMY = 3.626152797423156E-01
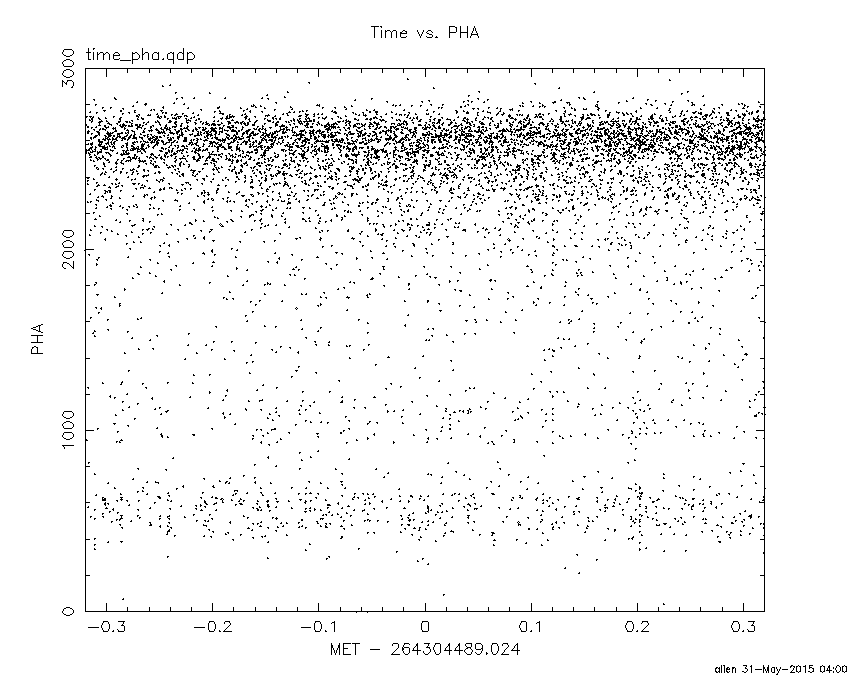
TIME vs. PHA plot around the trigger time
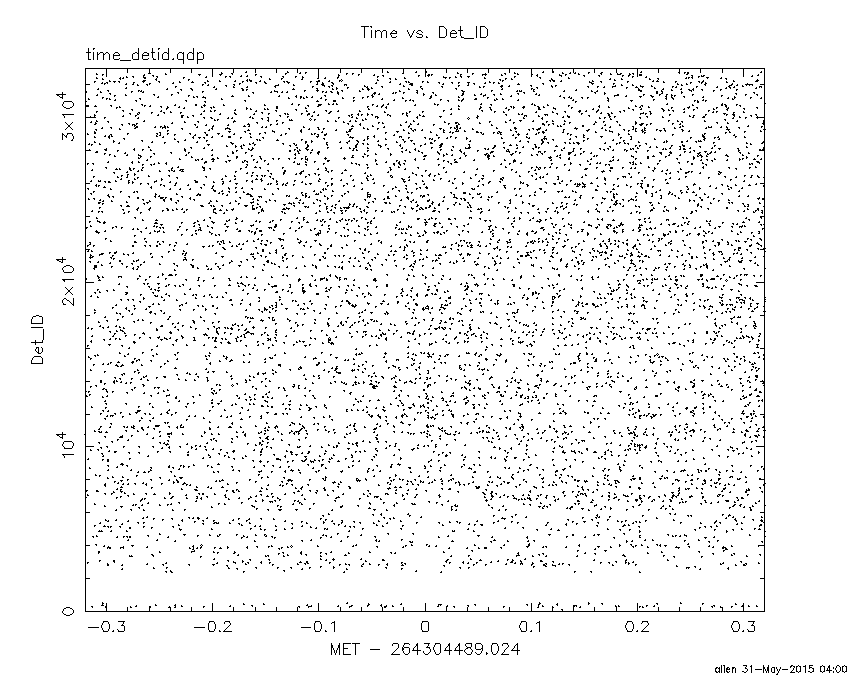
TIME vs. DetID plot around the trigger time
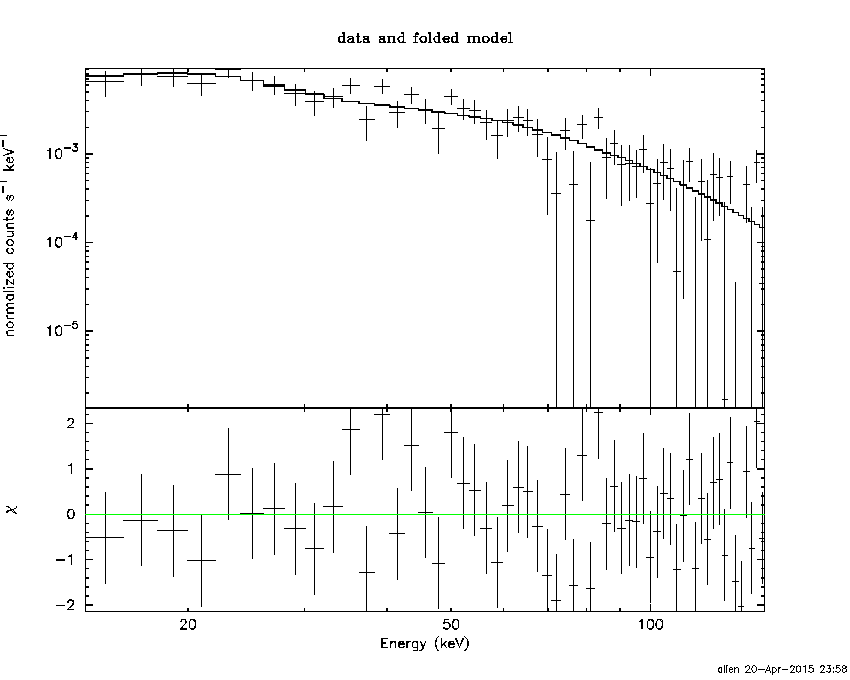
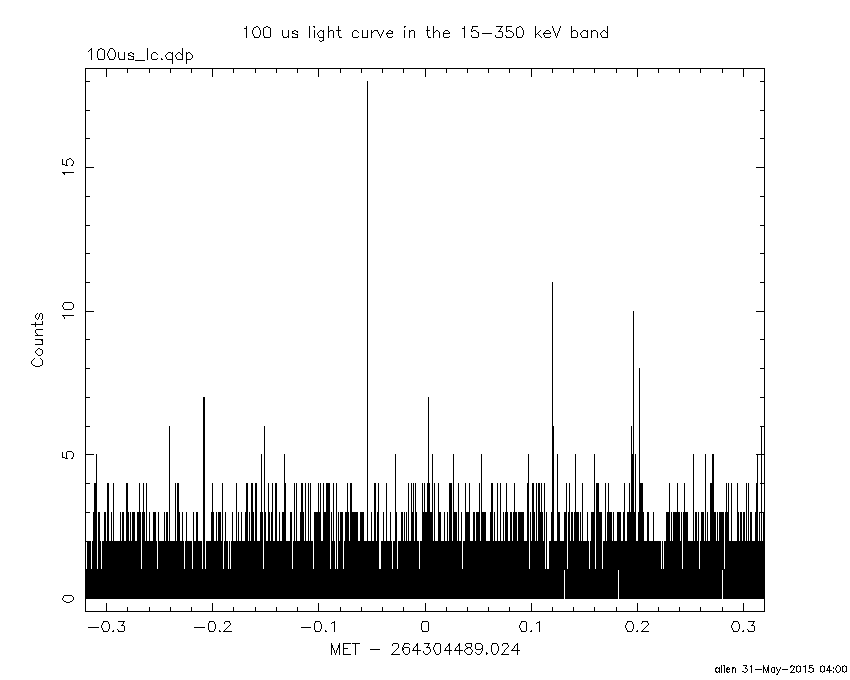
100 us light curve (15-350 keV)
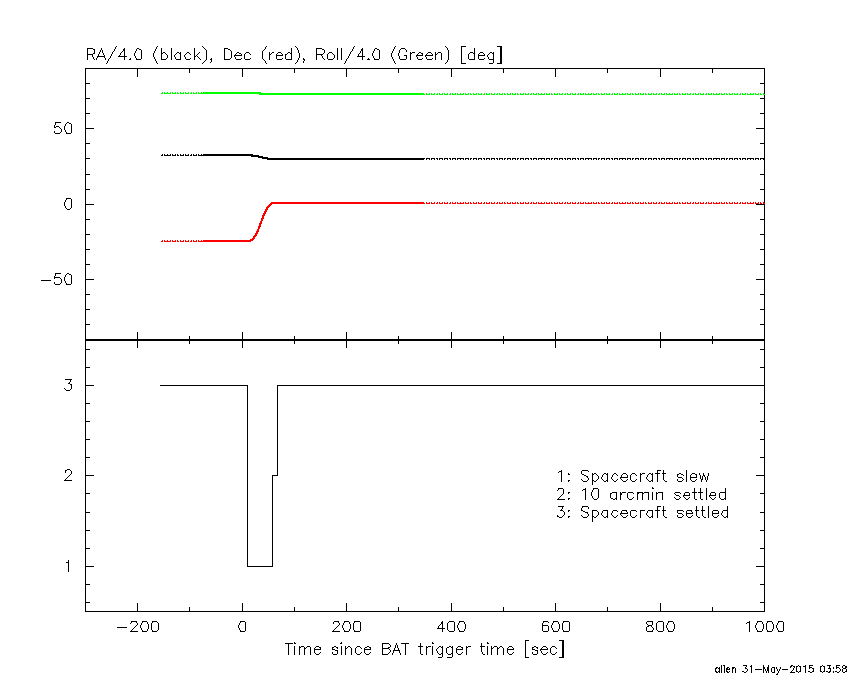
Spacecraft aspect plot
Bright source in the pre-burst/pre-slew/post-slew images
Pre-burst image of 15-350 keV band
Time interval of the image:
-119.024000 -2.480000

# RAcent  DECcent POSerr Theta    Phi  PeakCts   SNR AngSep     Name
#  [deg]    [deg]    ['] [deg]  [deg]                   [']
135.5337 -40.5600    0.3  16.9  140.3   4.9139  40.5    0.4	Vela X-1
108.1407 -71.2747    2.6  48.4  165.0   1.4599   4.4 ------	UNKNOWN
148.3491  21.4450    2.2  49.3   -0.7   1.5771   5.2 ------	UNKNOWN
Pre-slew background subtracted image of 15-350 keV band
Time interval of the image:
-2.480000 9.676600

# RAcent  DECcent POSerr Theta    Phi  PeakCts   SNR AngSep     Name
#  [deg]    [deg]    ['] [deg]  [deg]                   [']
135.5522 -40.5780    1.4  16.9  140.3  -0.3176  -8.5    1.8	Vela X-1
119.9477   0.7798    0.6  26.9  -45.7   0.7893  18.8 ------	UNKNOWN
Post-slew image of 15-350 keV band
Time interval of the image:
57.276660 963.022400

# RAcent  DECcent POSerr Theta    Phi  PeakCts   SNR AngSep     Name
#  [deg]    [deg]    ['] [deg]  [deg]                   [']
 83.6085  22.0072    0.8  41.2  -77.3  33.3870  15.2    1.4	Crab
135.5380 -40.5569    0.6  43.7  141.9  29.1965  18.3    0.4	Vela X-1
133.9082  38.5645    2.9  39.9   -3.8   3.0032   4.1 ------	UNKNOWN
Plot creation:
Sun May 31 04:01:01 EDT 2015