Click here for the BAT GCN circular template
Image
Pre-slew 15.0-350.0 keV image (Event data)
#   RAcent    DECcent   POSerr    Theta     Phi              Peak Cts       SNR   Name
  142.3091     0.1852   0.0166    22.3988    75.1332         1.6790839     11.474 TRIG_00352648

Foreground time interval of the image:
-12.400  54.888 (delta_t =  67.288 [sec])
Background time interval of the image:
-100.683 -12.400 (delta_t =  88.283 [sec])
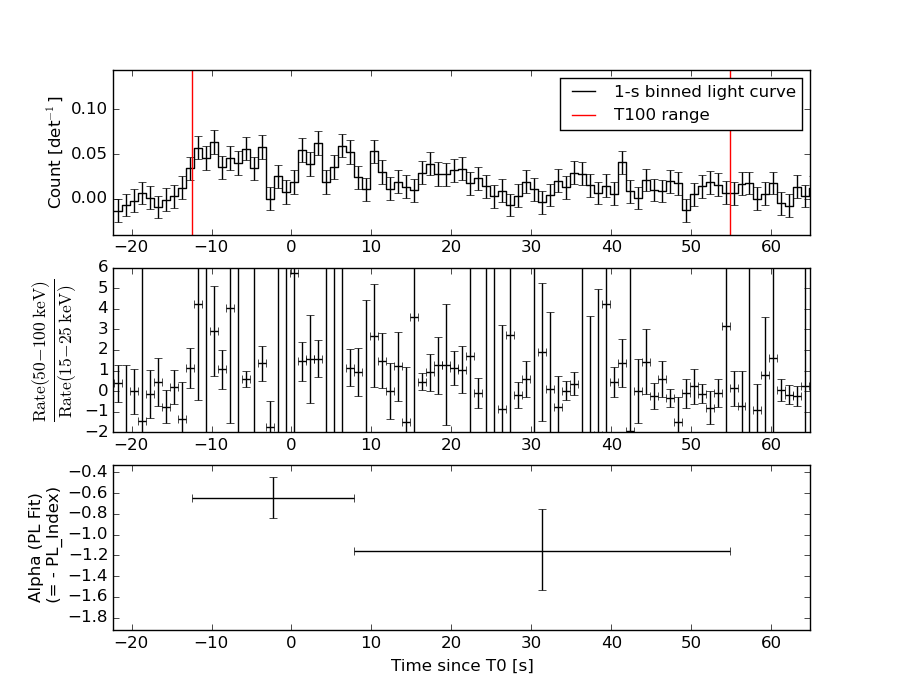
Lightcurves
Notes:
- 1) The mask-weighted light curves are using the flight position.
- 2) Multiple plots of different time binning/intervals are shown to cover all scenarios of short/long GRBs, rate/image triggers, and real/false positives.
- 3) For all the mask-weighted lightcurves, the y-axis units are counts/sec/det where a det is 0.4 x 0.4 = 0.16 sq cm.
- 4) The verticle lines correspond to following: green dotted lines are T50 interval, black dotted lines are T90 interval, blue solid line(s) is a spacecraft slew start time, and orange solid line(s) is a spacecraft slew end time.
- 5) Time of each bin is in the middle of the bin.
1 s binning
From T0-310 s to T0+310 s

From T100_start - 20 s to T100_end + 30 s
Full time interval
64 ms binning
Full time interval

From T100_start to T100_end
From T0-5 sec to T0+5 sec

16 ms binning
From T100_start-5 s to T100_start+5 s

8 ms binning
From T100_start-3 s to T100_start+3 s
2 ms binning
From T100_start-1 s to T100_start+1 s
SN=5 or 10 sec. binning (whichever binning is satisfied first)

SN=5 or 10 sec. binning (T < 200 sec)
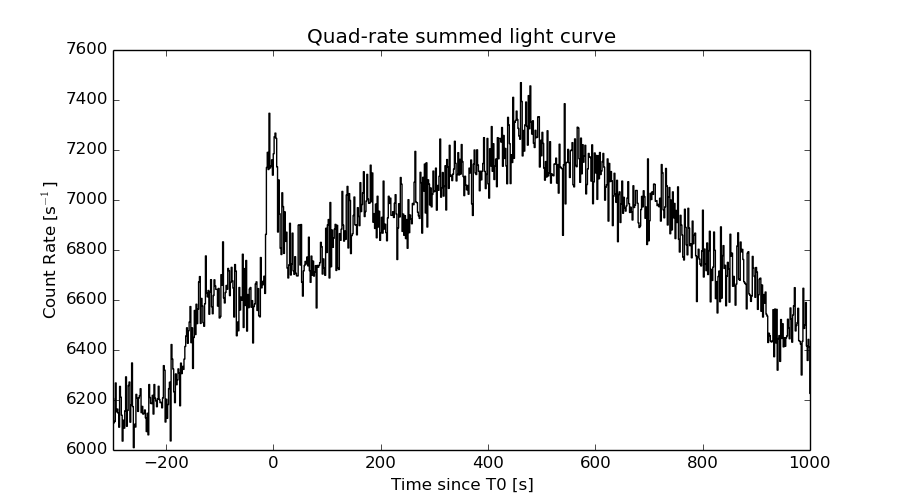
Quad-rate summed light curves (from T0-300s to T0+1000s)
Spectral Evolution
Spectra
Notes:
- 1) The fitting includes the systematic errors.
- 2) When the burst includes telescope slew time periods, the fitting uses an average response file made from multiple 5-s response files through out the slew time plus single time preiod for the non-slew times, and weighted by the total counts in the corresponding time period using addrmf. An average response file is needed becuase a spectral fit using the pre-slew DRM will introduce some errors in both a spectral shape and a normalization if the PHA file contains a lot of the slew/post-slew time interval.
- 3) For fits to more complicated models (e.g. a power-law over a cutoff power-law), the BAT team has decided to require a chi-square improvement of more than 6 for each extra dof.
Time averaged spectrum fit using the average DRM
Power-law model
Time interval is from  -12.400 sec. to   54.888 sec.

Spectral model in power-law:
------------------------------------------------------------
Parameters  : value       lower 90%   higher 90%
Photon index: 0.851553     ( -0.210162   0.19913 )
Norm@50keV  : 1.53258E-03    ( -0.000173097   0.000170094 )
------------------------------------------------------------
#Fit statistic : Chi-Squared =          63.78 using 59 PHA bins.
# Reduced chi-squared =          1.119 for     57 degrees of freedom
# Null hypothesis probability =   2.502981e-01

Photon flux (15-150 keV)    in 67.29 sec: 0.175922 ( -0.0194508  0.0195782 ) ph/cm2/s
Energy fluence (15-150 keV)             : 1.17979e-06 ( -1.31284e-07  1.32138e-07 ) ergs/cm2
Cutoff power-law model

Time interval is from  -12.400 sec. to   54.888 sec.
Spectral model in the cutoff power-law:
------------------------------------------------------------
Parameters  : value       lower 90%   higher 90%
Photon index: 0.844741     ( -0.523856   0.267852 )
Epeak [keV] : 1.00000E+04      (   )
Norm@50keV  : 1.54295E-03    ( -0.000173613   0.000160214 )
------------------------------------------------------------
#Fit statistic : Chi-Squared =          63.80 using 59 PHA bins.
# Reduced chi-squared =          1.139 for     56 degrees of freedom
# Null hypothesis probability =   2.212563e-01

Photon flux (15-150 keV)    in 67.29 sec: 0.176119 ( -0.019702  0.019294 ) ph/cm2/s
Energy fluence (15-150 keV)             : 1.17771e-06 ( -1.29204e-07  1.32797e-07 ) ergs/cm2
Band function

Time interval is from  -12.400 sec. to   54.888 sec.

Spectral model in the Band function:
------------------------------------------------------------
Parameters  : value       lower 90%   higher 90%
alpha       : 5.00000   ( -5   -5 )
beta        : -0.874127    ( -0.201818   0.212933 )
Epeak [keV] : 23.7284      ( -19.9171 527.589 )
Norm@50keV   : 122.800    ( -12.6884   230541 )
------------------------------------------------------------
#Fit statistic : Chi-Squared =          63.36 using 59 PHA bins.
# Reduced chi-squared =          1.152 for     55 degrees of freedom
# Null hypothesis probability =   2.052677e-01

Photon flux (15-150 keV)    in 67.29 sec:  (    ) ph/cm2/s
Energy fluence (15-150 keV)             : 0 ( 0  0 ) ergs/cm2
Single BB

Spectral model blackbody:
------------------------------------------------------------
Parameters  : value    Lower 90%  Upper 90%
kT [keV]    : 26.4947  (-4.10337  5.46334)
R^2/D10^2   : 3.60526E-03  (-0.00151328   0.00239342)
(R is the radius in km and D10 is the distance to the source in units of 10 kpc)
------------------------------------------------------------
#Fit statistic : Chi-Squared =          81.54 using 59 PHA bins.
# Reduced chi-squared =          1.430 for     57 degrees of freedom
# Null hypothesis probability =   1.817637e-02

Energy  Fluence     90% Error
[keV]   [erg/cm2]   [erg/cm2]
15- 25  2.866e-08   6.763e-09
25- 50  1.673e-07   3.301e-08
50-150  8.619e-07   1.563e-07
15-150  1.058e-06   1.713e-07
Thermal bremsstrahlung (OTTB)
Spectral model: thermal bremsstrahlung
------------------------------------------------------------
Parameters  : value         Lower 90%    Upper 90%
kT [keV]    : 200.000       (      )
Norm        : 0.724273       (-0.0811067     0.0810974)
------------------------------------------------------------
#Fit statistic : Chi-Squared =          98.80 using 59 PHA bins.
# Reduced chi-squared =          1.733 for     57 degrees of freedom
# Null hypothesis probability =   4.983492e-04

Energy  Fluence     90% Error
[keV]   [erg/cm2]   [erg/cm2]
15- 25  1.214e-07   6.790e-08
25- 50  2.335e-07   1.296e-07
50-150  5.122e-07   2.806e-07
15-150  8.671e-07   4.741e-07
Double BB

Spectral model: bbodyrad<1> + bbodyrad<2>
------------------------------------------------------------
Parameters  : value         Lower 90%    Upper 90%
kT1 [keV]   : 8.18263        (-2.75149      5.44319)
R1^2/D10^2  : 7.82603E-02        (-0.0556444      0.240428)
kT2 [keV]   : 44.2911        (-13.5356      -44.368)
R2^2/D10^2  : 7.54643E-04    (-0.000727137   0.00136698)
------------------------------------------------------------
#Fit statistic : Chi-Squared =          63.26 using 59 PHA bins.
# Reduced chi-squared =          1.150 for     55 degrees of freedom
# Null hypothesis probability =   2.078110e-01

Energy  Fluence     90% Error
[keV]   [erg/cm2]   [erg/cm2]
15- 25  7.673e-08   4.316e-08
25- 50  2.016e-07   1.037e-07
50-150  9.347e-07   4.794e-07
15-150  1.213e-06   5.606e-07
Peak spectrum fit
Power-law model
Time interval is from  -10.404 sec. to   -9.404 sec.

Spectral model in power-law:
------------------------------------------------------------
Parameters  : value       lower 90%   higher 90%
Photon index: 0.307490     ( -0.720879   0.564186 )
Norm@50keV  : 4.60667E-03    ( -0.00184327   0.00162289 )
------------------------------------------------------------
#Fit statistic : Chi-Squared =          46.24 using 59 PHA bins.
# Reduced chi-squared =         0.8113 for     57 degrees of freedom
# Null hypothesis probability =   8.450420e-01

Photon flux (15-150 keV)    in 1 sec: 0.567281 ( -0.156025  0.16055 ) ph/cm2/s
Energy fluence (15-150 keV)             : 6.85629e-08 ( -1.74377e-08  1.74514e-08 ) ergs/cm2
Cutoff power-law model
Time interval is from  -10.404 sec. to   -9.404 sec.
Spectral model in the cutoff power-law:
------------------------------------------------------------
Parameters  : value       lower 90%   higher 90%
Photon index: 0.336383     ( -0.766555   0.534153 )
Epeak [keV] : 9999.36      ( -9999.36 -9999.36 )
Norm@50keV  : 4.71846E-03    ( -0.00189713   0.0123464 )
------------------------------------------------------------
#Fit statistic : Chi-Squared =          46.27 using 59 PHA bins.
# Reduced chi-squared =         0.8263 for     56 degrees of freedom
# Null hypothesis probability =   8.198205e-01

Photon flux (15-150 keV)    in 1 sec: 0.571986 ( -0.159449  0.155973 ) ph/cm2/s
Energy fluence (15-150 keV)             : 6.82995e-08 ( -1.71942e-08  1.78006e-08 ) ergs/cm2
Band function

Time interval is from  -10.404 sec. to   -9.404 sec.

Spectral model in the Band function:
------------------------------------------------------------
Parameters  : value       lower 90%   higher 90%
alpha       : -9.99998   ( 9.99998   9.99998 )
beta        : -0.307460    ( -0.564438   0.720743 )
Epeak [keV] : 25.0133      ( -25.0133 -25.0133 )
Norm@50keV   : 0.626102    ( -0.250514   0.220586 )
------------------------------------------------------------
#Fit statistic : Chi-Squared =          46.24 using 59 PHA bins.
# Reduced chi-squared =         0.8408 for     55 degrees of freedom
# Null hypothesis probability =   7.937240e-01

Photon flux (15-150 keV)    in 1 sec:  (    ) ph/cm2/s
Energy fluence (15-150 keV)             : 0 ( 0  0 ) ergs/cm2
Single BB
Spectral model blackbody:
------------------------------------------------------------
Parameters  : value    Lower 90%  Upper 90%
kT [keV]    : 46.6450  (-18.6641  103.892)
R^2/D10^2   : 3.03020E-03  (-0.00302341   0.00815873)
(R is the radius in km and D10 is the distance to the source in units of 10 kpc)
------------------------------------------------------------
#Fit statistic : Chi-Squared =          48.12 using 59 PHA bins.
# Reduced chi-squared =         0.8443 for     57 degrees of freedom
# Null hypothesis probability =   7.926600e-01

Energy  Fluence     90% Error
[keV]   [erg/cm2]   [erg/cm2]
15- 25  7.592e-10   4.600e-10
25- 50  5.398e-09   3.121e-09
50-150  6.148e-08   3.515e-08
15-150  6.764e-08   3.952e-08
Thermal bremsstrahlung (OTTB)

Spectral model: thermal bremsstrahlung
------------------------------------------------------------
Parameters  : value         Lower 90%    Upper 90%
kT [keV]    : 200.000       (      )
Norm        : 2.25829       (-0.676165     0.676114)
------------------------------------------------------------
#Fit statistic : Chi-Squared =          60.30 using 59 PHA bins.
# Reduced chi-squared =          1.058 for     57 degrees of freedom
# Null hypothesis probability =   3.572075e-01

Energy  Fluence     90% Error
[keV]   [erg/cm2]   [erg/cm2]
15- 25  5.628e-09   3.548e-09
25- 50  1.083e-08   6.775e-09
50-150  2.374e-08   1.484e-08
15-150  4.020e-08   2.438e-08
Double BB

Spectral model: bbodyrad<1> + bbodyrad<2>
------------------------------------------------------------
Parameters  : value         Lower 90%    Upper 90%
kT1 [keV]   : 4.92787        (-4.92866      -4.92866)
R1^2/D10^2  : 1.33718        (-1.33614      25.5473)
kT2 [keV]   : 59.1561        (-27.936      -59.1653)
R2^2/D10^2  : 1.73236E-03    (-0.00173173   0.00606162)
------------------------------------------------------------
#Fit statistic : Chi-Squared =          45.66 using 59 PHA bins.
# Reduced chi-squared =         0.8303 for     55 degrees of freedom
# Null hypothesis probability =   8.109960e-01

Energy  Fluence     90% Error
[keV]   [erg/cm2]   [erg/cm2]
15- 25  3.646e-09   2.480e-09
25- 50  6.264e-09   3.347e-09
50-150  6.159e-08   3.509e-08
15-150  7.150e-08   3.787e-08
Pre-slew spectrum (Pre-slew PHA with pre-slew DRM)
Power-law model

Spectral model in power-law:
------------------------------------------------------------
Parameters  : value       lower 90%   higher 90%
Photon index: 0.851553     ( -0.210162   0.19913 )
Norm@50keV  : 1.53258E-03    ( -0.000173097   0.000170094 )
------------------------------------------------------------
#Fit statistic : Chi-Squared =          63.78 using 59 PHA bins.
# Reduced chi-squared =          1.119 for     57 degrees of freedom
# Null hypothesis probability =   2.502981e-01

Photon flux (15-150 keV)    in 67.29 sec: 0.175922 ( -0.0194508  0.0195782 ) ph/cm2/s
Energy fluence (15-150 keV)             : 1.17979e-06 ( -1.31284e-07  1.32138e-07 ) ergs/cm2
Cutoff power-law model

Spectral model in the cutoff power-law:
------------------------------------------------------------
Parameters  : value       lower 90%   higher 90%
Photon index: 0.844741     ( -0.523856   0.267852 )
Epeak [keV] : 1.00000E+04      (   )
Norm@50keV  : 1.54295E-03    ( -0.000173613   0.000160214 )
------------------------------------------------------------
#Fit statistic : Chi-Squared =          63.80 using 59 PHA bins.
# Reduced chi-squared =          1.139 for     56 degrees of freedom
# Null hypothesis probability =   2.212563e-01

Photon flux (15-150 keV)    in 67.29 sec: 0.176119 ( -0.019702  0.019294 ) ph/cm2/s
Energy fluence (15-150 keV)             : 1.17771e-06 ( -1.29204e-07  1.32797e-07 ) ergs/cm2
Band function

Spectral model in the Band function:
------------------------------------------------------------
Parameters  : value       lower 90%   higher 90%
alpha       : 5.00000   ( -5   -5 )
beta        : -0.874127    ( -0.201818   0.212933 )
Epeak [keV] : 23.7284      ( -19.9171 527.589 )
Norm@50keV   : 122.800    ( -12.6884   230541 )
------------------------------------------------------------
#Fit statistic : Chi-Squared =          63.36 using 59 PHA bins.
# Reduced chi-squared =          1.152 for     55 degrees of freedom
# Null hypothesis probability =   2.052677e-01

Photon flux (15-150 keV)    in 67.29 sec:  (    ) ph/cm2/s
Energy fluence (15-150 keV)             : 0 ( 0  0 ) ergs/cm2
S(25-50 keV) vs. S(50-100 keV) plot
S(25-50 keV)  = 1.97e-07
S(50-100 keV) = 4.38e-07
T90 vs. Hardness ratio plot

T90                                   = 58.0360000133514 sec.
Hardness ratio (energy fluence ratio) = 2.22335
Color vs. Color plot
Count Ratio  (25-50 keV) / (15-25 keV) = 1.80467
Count Ratio (50-100 keV) / (15-25 keV) = 1.95931
Mask shadow pattern

IMX = 1.057455153147989E-01, IMY = -3.983484153796124E-01
TIME vs. PHA plot around the trigger time

TIME vs. DetID plot around the trigger time
100 us light curve (15-350 keV)
Spacecraft aspect plot
Bright source in the pre-burst/pre-slew/post-slew images
Pre-burst image of 15-350 keV band
Time interval of the image:
-100.683400 -12.400000

# RAcent  DECcent POSerr Theta    Phi  PeakCts   SNR AngSep     Name
#  [deg]    [deg]    ['] [deg]  [deg]                   [']
 83.6253  22.0064    1.4  41.2  -72.8   3.0824   8.2    0.7	Crab
135.5589 -40.5709    2.8  43.8  146.4   1.0272   4.1    1.7	Vela X-1
126.8493   5.1276    2.3   8.2   41.6   0.4775   5.1 ------	UNKNOWN
107.6359  14.9046    2.8  18.6  -56.5   0.4206   4.1 ------	UNKNOWN
Pre-slew background subtracted image of 15-350 keV band
Time interval of the image:
-12.400000 54.888000

# RAcent  DECcent POSerr Theta    Phi  PeakCts   SNR AngSep     Name
#  [deg]    [deg]    ['] [deg]  [deg]                   [']
 83.5011  22.1388    0.0  41.4  -72.7   0.5821   1.4   10.5	Crab
135.6966 -40.5323  107.0  43.8  146.3  -0.0289  -0.1    7.8	Vela X-1
142.3091   0.1852    1.0  22.4   75.1   1.6792  11.5 ------	UNKNOWN
138.4355  41.5117    2.2  44.0    3.7   1.0667   5.2 ------	UNKNOWN
136.3281  55.8719    2.9  56.6   -5.4   2.2762   3.9 ------	UNKNOWN
Post-slew image of 15-350 keV band
Time interval of the image:
104.316590 962.861100

# RAcent  DECcent POSerr Theta    Phi  PeakCts   SNR AngSep     Name
#  [deg]    [deg]    ['] [deg]  [deg]                   [']
135.5667 -40.5687    0.7  41.2  168.0  14.1231  16.6    1.9	Vela X-1
150.6677 -13.0831    2.6  15.7  128.5   2.2942   4.4 ------	UNKNOWN
171.1154  49.6593    2.8  55.3    2.6  11.4742   4.1 ------	UNKNOWN
141.4419  -6.1069    2.4   6.4  167.8   2.4359   4.8 ------	UNKNOWN
Plot creation:
Sun May 31 03:58:44 EDT 2015