Special notes of this burst
Image
Pre-slew 15.0-350.0 keV image (Event data)
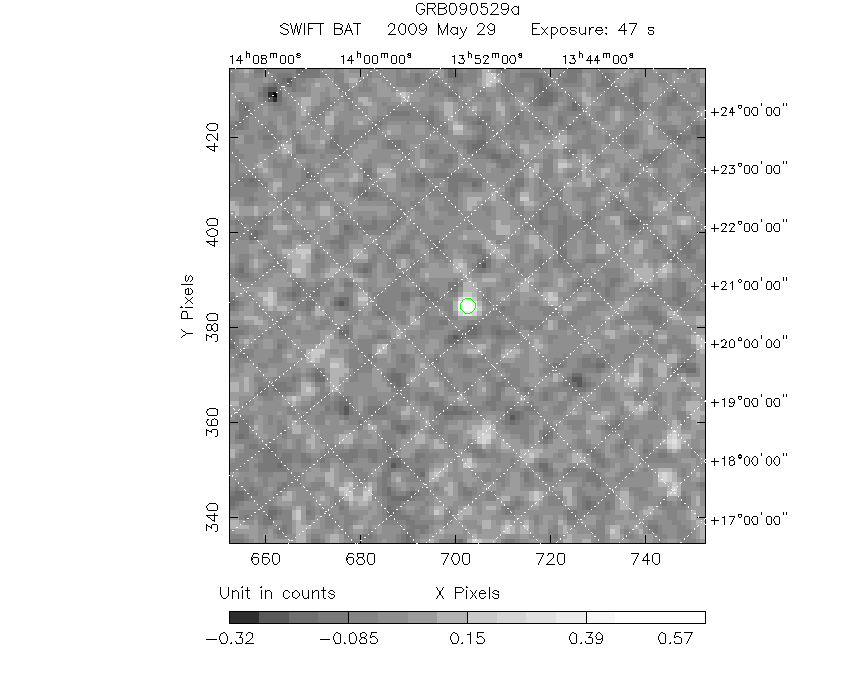
# RAcent DECcent POSerr Theta Phi Peak Cts SNR Name
212.4460 24.4544 0.0163 22.7501 27.4811 0.7424399 11.821 TRIG_00353540
Foreground time interval of the image:
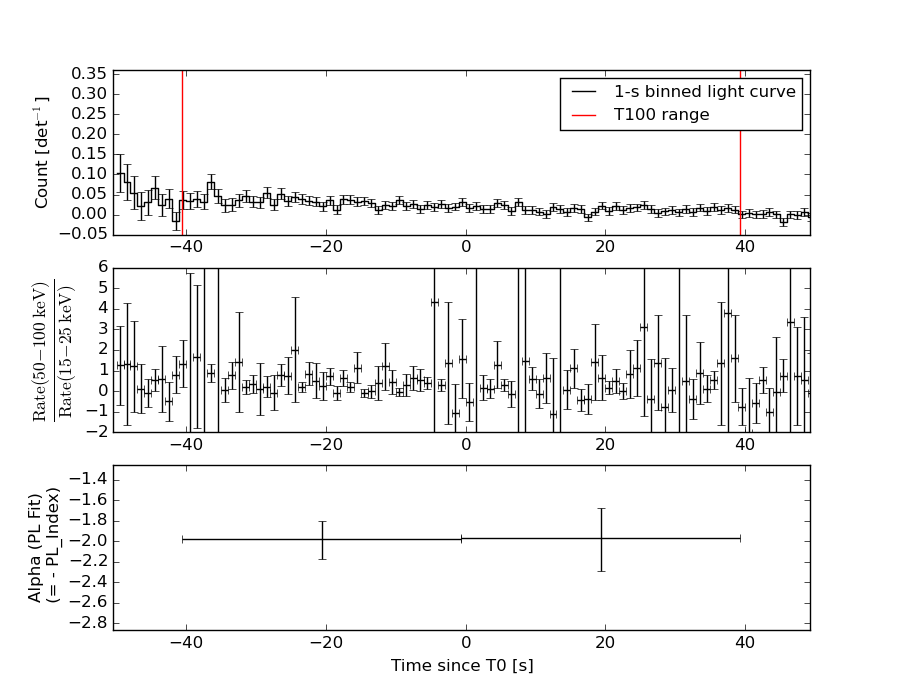
-7.299 39.300 (delta_t = 46.599 [sec])
Background time interval of the image:
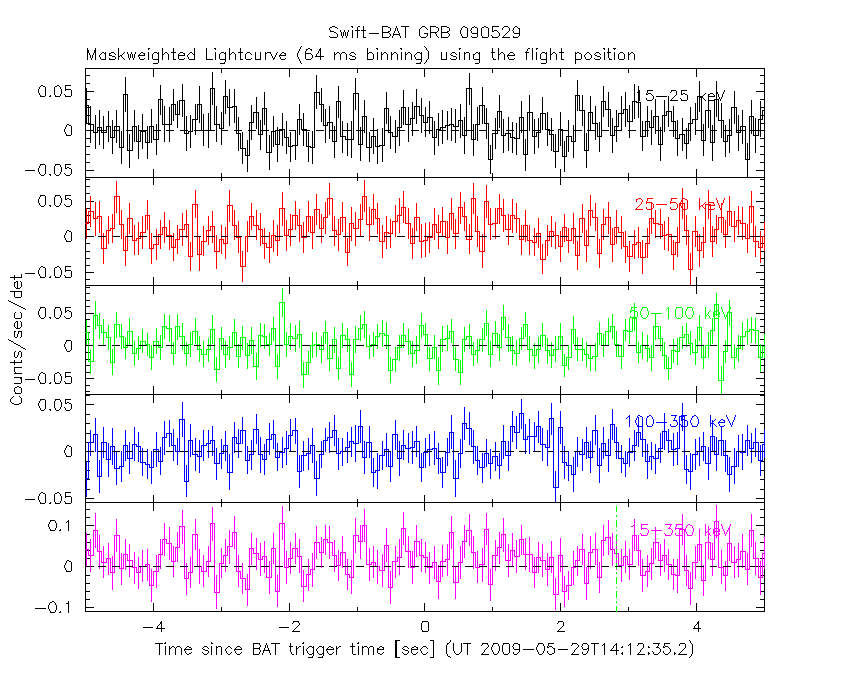
Lightcurves
Notes:
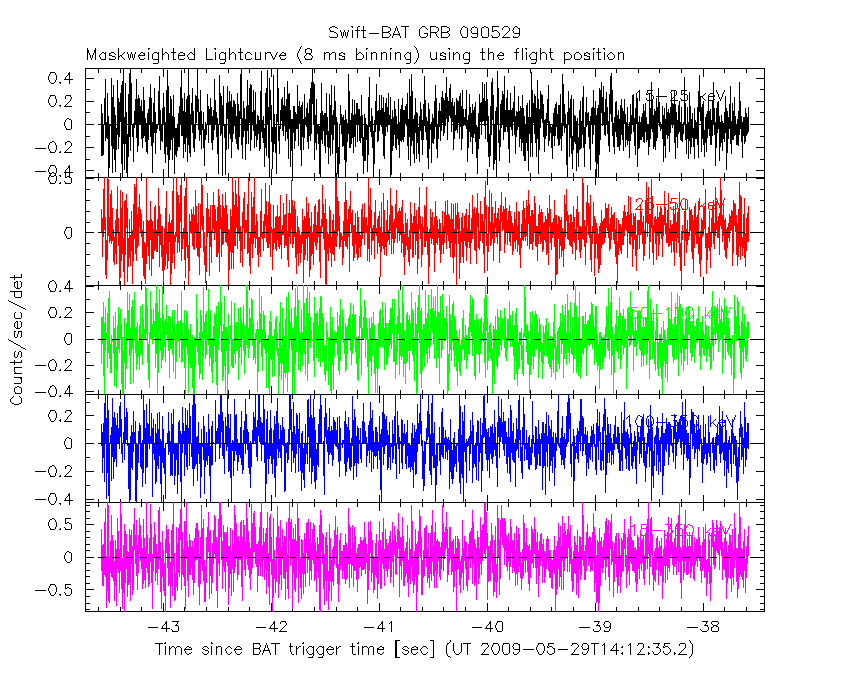
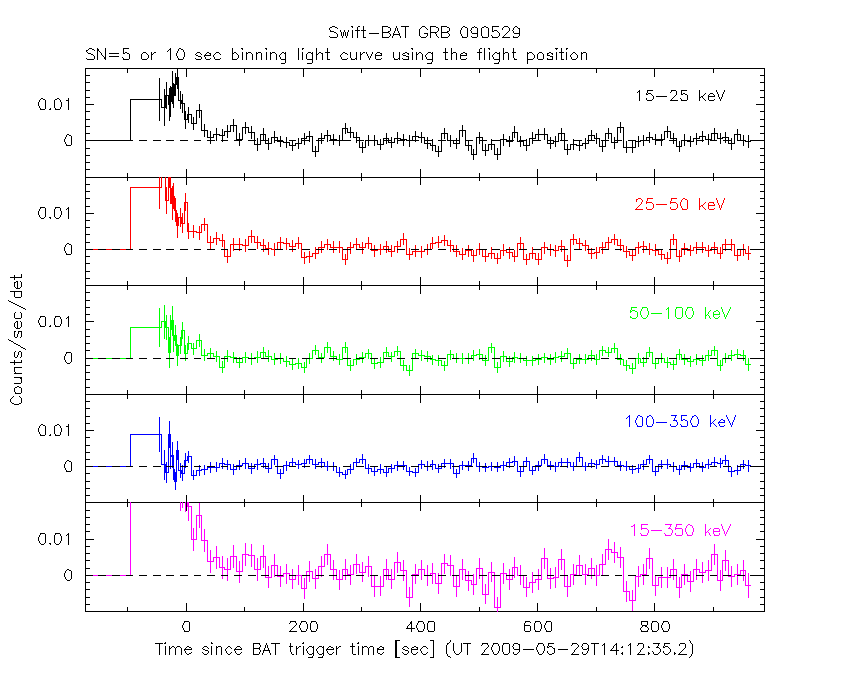
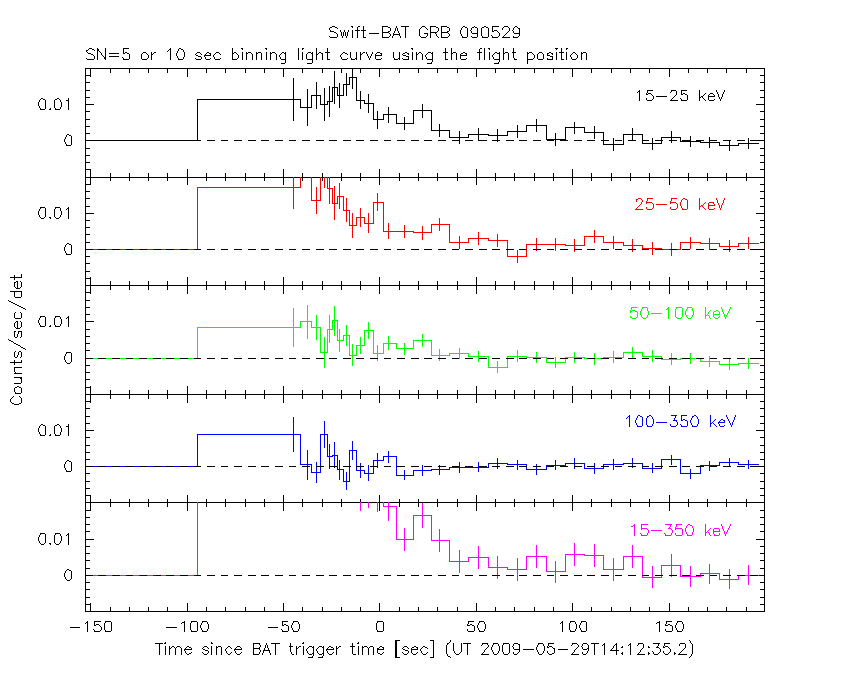
- 1) The mask-weighted light curves are using the flight position.
- 2) Multiple plots of different time binning/intervals are shown to cover all scenarios of short/long GRBs, rate/image triggers, and real/false positives.
- 3) For all the mask-weighted lightcurves, the y-axis units are counts/sec/det where a det is 0.4 x 0.4 = 0.16 sq cm.
- 4) The verticle lines correspond to following: green dotted lines are T50 interval, black dotted lines are T90 interval, blue solid line(s) is a spacecraft slew start time, and orange solid line(s) is a spacecraft slew end time.
- 5) Time of each bin is in the middle of the bin.
1 s binning
From T0-310 s to T0+310 s

From T100_start - 20 s to T100_end + 30 s
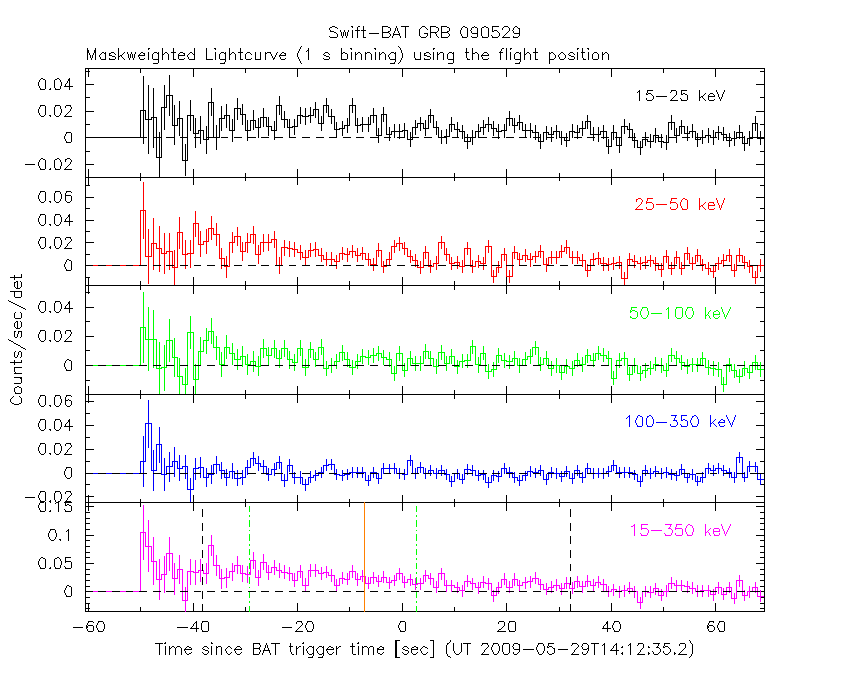
Full time interval

64 ms binning
Full time interval
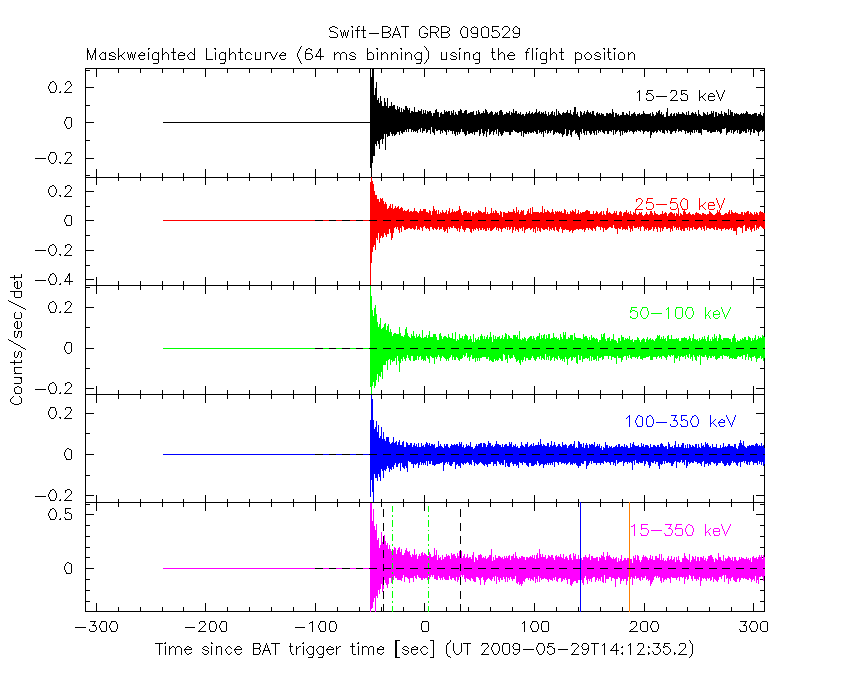
From T100_start to T100_end

From T0-5 sec to T0+5 sec
16 ms binning
From T100_start-5 s to T100_start+5 s

8 ms binning
From T100_start-3 s to T100_start+3 s
2 ms binning
From T100_start-1 s to T100_start+1 s

SN=5 or 10 sec. binning (whichever binning is satisfied first)
SN=5 or 10 sec. binning (T < 200 sec)
Quad-rate summed light curves (from T0-300s to T0+1000s)

Spectral Evolution
Spectra
Notes:
- 1) The fitting includes the systematic errors.
- 2) When the burst includes telescope slew time periods, the fitting uses an average response file made from multiple 5-s response files through out the slew time plus single time preiod for the non-slew times, and weighted by the total counts in the corresponding time period using addrmf. An average response file is needed becuase a spectral fit using the pre-slew DRM will introduce some errors in both a spectral shape and a normalization if the PHA file contains a lot of the slew/post-slew time interval.
- 3) For fits to more complicated models (e.g. a power-law over a cutoff power-law), the BAT team has decided to require a chi-square improvement of more than 6 for each extra dof.
Time averaged spectrum fit using the average DRM
Power-law model
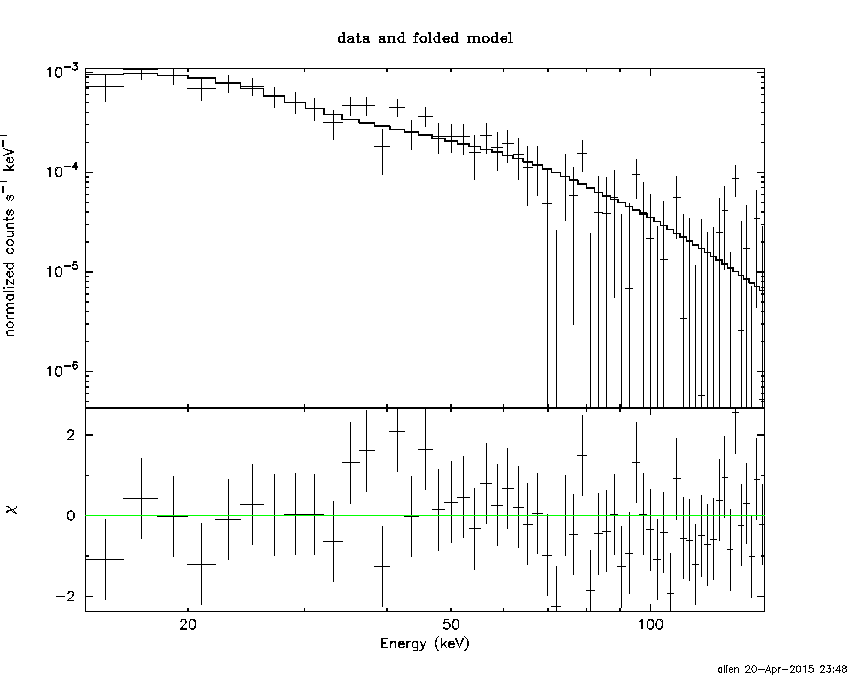
Time interval is from  -40.576 sec. to   39.300 sec.

Spectral model in power-law:
------------------------------------------------------------
Parameters  : value       lower 90%   higher 90%
Photon index: 1.98647     ( -0.159462   0.16692 )
Norm@50keV  : 1.40865E-03    ( -0.000155204   0.000152554 )
------------------------------------------------------------
#Fit statistic : Chi-Squared =          54.25 using 59 PHA bins.
# Reduced chi-squared =         0.9517 for     57 degrees of freedom
# Null hypothesis probability =   5.789985e-01

Photon flux (15-150 keV)    in 79.88 sec: 0.209993 ( -0.01838  0.0183858 ) ph/cm2/s
Energy fluence (15-150 keV)             : 1.03698e-06 ( -1.07641e-07  1.09593e-07 ) ergs/cm2
Cutoff power-law model

Time interval is from  -40.576 sec. to   39.300 sec.
Spectral model in the cutoff power-law:
------------------------------------------------------------
Parameters  : value       lower 90%   higher 90%
Photon index: 0.870296     ( -0.94146   0.779104 )
Epeak [keV] : 42.0659      ( -8.45313 11.4873 )
Norm@50keV  : 6.16840E-03    ( -0.00393141   0.0153035 )
------------------------------------------------------------
#Fit statistic : Chi-Squared =          47.86 using 59 PHA bins.
# Reduced chi-squared =         0.8546 for     56 degrees of freedom
# Null hypothesis probability =   7.722419e-01

Photon flux (15-150 keV)    in 79.88 sec: 0.200870 ( -0.019271  0.019344 ) ph/cm2/s
Energy fluence (15-150 keV)             : 9.34612e-07 ( -1.14899e-07  1.24589e-07 ) ergs/cm2
Band function
Time interval is from  -40.576 sec. to   39.300 sec.

Spectral model in the Band function:
------------------------------------------------------------
Parameters  : value       lower 90%   higher 90%
alpha       : -0.798418   ( -0.831122   1.15117 )
beta        : -3.24523    ( 3.22108   1.04078 )
Epeak [keV] : 41.7287      ( -8.51914 9.99591 )
Norm@50keV   : 6.75391E-03    ( -0.00209469   0.0296297 )
------------------------------------------------------------
#Fit statistic : Chi-Squared =          47.75 using 59 PHA bins.
# Reduced chi-squared =         0.8681 for     55 degrees of freedom
# Null hypothesis probability =   7.454894e-01

Photon flux (15-150 keV)    in 79.88 sec:  (    ) ph/cm2/s
Energy fluence (15-150 keV)             : 9.43031e-07 ( 0  0 ) ergs/cm2
Single BB

Spectral model blackbody:
------------------------------------------------------------
Parameters  : value    Lower 90%  Upper 90%
kT [keV]    : 10.3849  (-0.955224  1.05126)
R^2/D10^2   : 8.57867E-02  (-0.0265115   0.0382939)
(R is the radius in km and D10 is the distance to the source in units of 10 kpc)
------------------------------------------------------------
#Fit statistic : Chi-Squared =          61.40 using 59 PHA bins.
# Reduced chi-squared =          1.077 for     57 degrees of freedom
# Null hypothesis probability =   3.213795e-01

Energy  Fluence     90% Error
[keV]   [erg/cm2]   [erg/cm2]
15- 25  1.523e-07   2.269e-08
25- 50  3.990e-07   4.481e-08
50-150  2.321e-07   5.384e-08
15-150  7.834e-07   8.959e-08
Thermal bremsstrahlung (OTTB)

Spectral model: thermal bremsstrahlung
------------------------------------------------------------
Parameters  : value         Lower 90%    Upper 90%
kT [keV]    : 65.9922       (-15.4677      23.001)
Norm        : 1.05980       (-0.14287     0.160746)
------------------------------------------------------------
#Fit statistic : Chi-Squared =          48.68 using 59 PHA bins.
# Reduced chi-squared =         0.8541 for     57 degrees of freedom
# Null hypothesis probability =   7.754969e-01

Energy  Fluence     90% Error
[keV]   [erg/cm2]   [erg/cm2]
15- 25  2.157e-07   2.660e-08
25- 50  3.376e-07   3.075e-08
50-150  4.147e-07   1.001e-07
15-150  9.681e-07   1.086e-07
Double BB
Spectral model: bbodyrad<1> + bbodyrad<2>
------------------------------------------------------------
Parameters  : value         Lower 90%    Upper 90%
kT1 [keV]   : 3.69621        (-1.4201      2.40637)
R1^2/D10^2  : 2.36365        (-2.02297      9.79708)
kT2 [keV]   : 12.7754        (-1.77804      3.49034)
R2^2/D10^2  : 3.37430E-02    (-0.0229313   0.0189558)
------------------------------------------------------------
#Fit statistic : Chi-Squared =          47.20 using 59 PHA bins.
# Reduced chi-squared =         0.8583 for     55 degrees of freedom
# Null hypothesis probability =   7.633752e-01

Energy  Fluence     90% Error
[keV]   [erg/cm2]   [erg/cm2]
15- 25  2.089e-07   9.264e-08
25- 50  3.484e-07   1.060e-07
50-150  3.223e-07   1.245e-07
15-150  8.796e-07   2.395e-07
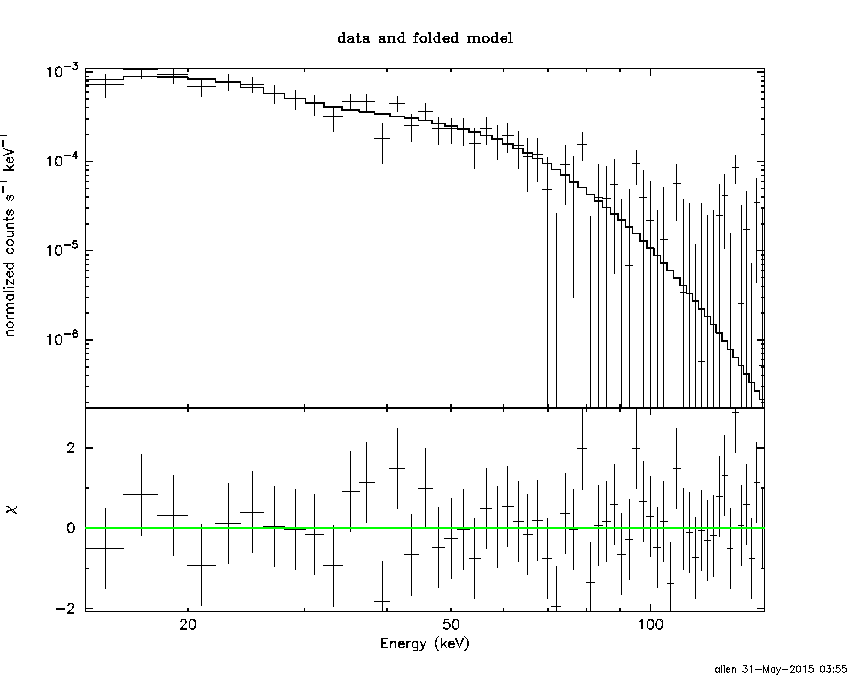
Peak spectrum fit
Power-law model

Time interval is from  -36.856 sec. to  -35.856 sec.

Spectral model in power-law:
------------------------------------------------------------
Parameters  : value       lower 90%   higher 90%
Photon index: 1.66761     ( -0.535227   0.558611 )
Norm@50keV  : 5.28258E-03    ( -0.00192681   0.00190113 )
------------------------------------------------------------
#Fit statistic : Chi-Squared =          41.98 using 59 PHA bins.
# Reduced chi-squared =         0.7365 for     57 degrees of freedom
# Null hypothesis probability =   9.318042e-01

Photon flux (15-150 keV)    in 1 sec: 0.693735 ( -0.248982  0.251157 ) ph/cm2/s
Energy fluence (15-150 keV)             : 4.90556e-08 ( -1.81736e-08  1.85939e-08 ) ergs/cm2
Cutoff power-law model

Time interval is from  -36.856 sec. to  -35.856 sec.
Spectral model in the cutoff power-law:
------------------------------------------------------------
Parameters  : value       lower 90%   higher 90%
Photon index: -1.02097     ( -5.89008   3.16294 )
Epeak [keV] : 50.8860      ( -14.8141 -50.6802 )
Norm@50keV  : 0.147013    ( -0.158711   237.966 )
------------------------------------------------------------
#Fit statistic : Chi-Squared =          39.41 using 59 PHA bins.
# Reduced chi-squared =         0.7038 for     56 degrees of freedom
# Null hypothesis probability =   9.546267e-01

Photon flux (15-150 keV)    in 1 sec: 0.651781 ( -0.24417  0.253898 ) ph/cm2/s
Energy fluence (15-150 keV)             : 4.24843e-08 ( -1.64645e-08  1.96517e-08 ) ergs/cm2
Band function

Time interval is from  -36.856 sec. to  -35.856 sec.

Spectral model in the Band function:
------------------------------------------------------------
Parameters  : value       lower 90%   higher 90%
alpha       : 5.00000   ( -12.0221   -5 )
beta        : -2.26834    ( 2.26845   0.805775 )
Epeak [keV] : 33.9281      ( -17.3148 16.221 )
Norm@50keV   : 112.667    ( -37.2233   9958.37 )
------------------------------------------------------------
#Fit statistic : Chi-Squared =          39.24 using 59 PHA bins.
# Reduced chi-squared =         0.7134 for     55 degrees of freedom
# Null hypothesis probability =   9.464739e-01

Photon flux (15-150 keV)    in 1 sec:  (    ) ph/cm2/s
Energy fluence (15-150 keV)             : 4.49693e-08 ( -4.49623e-08  -1.82266e-08 ) ergs/cm2
Single BB

Spectral model blackbody:
------------------------------------------------------------
Parameters  : value    Lower 90%  Upper 90%
kT [keV]    : 12.7923  (-3.54557  5.12671)
R^2/D10^2   : 0.151119  (-0.151117   0.344315)
(R is the radius in km and D10 is the distance to the source in units of 10 kpc)
------------------------------------------------------------
#Fit statistic : Chi-Squared =          39.48 using 59 PHA bins.
# Reduced chi-squared =         0.6927 for     57 degrees of freedom
# Null hypothesis probability =   9.626911e-01

Energy  Fluence     90% Error
[keV]   [erg/cm2]   [erg/cm2]
15- 25  5.245e-09   3.372e-09
25- 50  1.775e-08   1.108e-08
50-150  1.819e-08   1.252e-08
15-150  4.119e-08   2.729e-08
Thermal bremsstrahlung (OTTB)

Spectral model: thermal bremsstrahlung
------------------------------------------------------------
Parameters  : value         Lower 90%    Upper 90%
kT [keV]    : 121.849       (-75.9666      -120.124)
Norm        : 3.03723       (-1.15609     1.78957)
------------------------------------------------------------
#Fit statistic : Chi-Squared =          41.07 using 59 PHA bins.
# Reduced chi-squared =         0.7205 for     57 degrees of freedom
# Null hypothesis probability =   9.446887e-01

Energy  Fluence     90% Error
[keV]   [erg/cm2]   [erg/cm2]
15- 25  7.906e-09   4.813e-09
25- 50  1.418e-08   8.890e-09
50-150  2.550e-08   1.769e-08
15-150  4.758e-08   3.054e-08
Double BB

R1^2/D10^2  : 0.180136        (      )
kT2 [keV]   : 200.000        (      )
R2^2/D10^2  : 2.23253E-05    (-2.23256e-05   -2.23256e-05)
------------------------------------------------------------
#Fit statistic : Chi-Squared =          39.29 using 59 PHA bins.
#Fit statistic : Chi-Squared =          39.27 using 59 PHA bins.
#Fit statistic : Chi-Squared =          39.25 using 59 PHA bins.
# Reduced chi-squared =         0.7144 for     55 degrees of freedom
# Reduced chi-squared =         0.7140 for     55 degrees of freedom
# Reduced chi-squared =         0.7136 for     55 degrees of freedom
# Null hypothesis probability =   9.457160e-01
# Null hypothesis probability =   9.460320e-01
# Null hypothesis probability =   9.462871e-01

Energy  Fluence     90% Error
[keV]   [erg/cm2]   [erg/cm2]
15- 25  5.643e-09   3.742e-09
25- 50  1.763e-08   1.218e-08
50-150  2.143e-08   1.985e-08
15-150  4.471e-08   3.712e-08
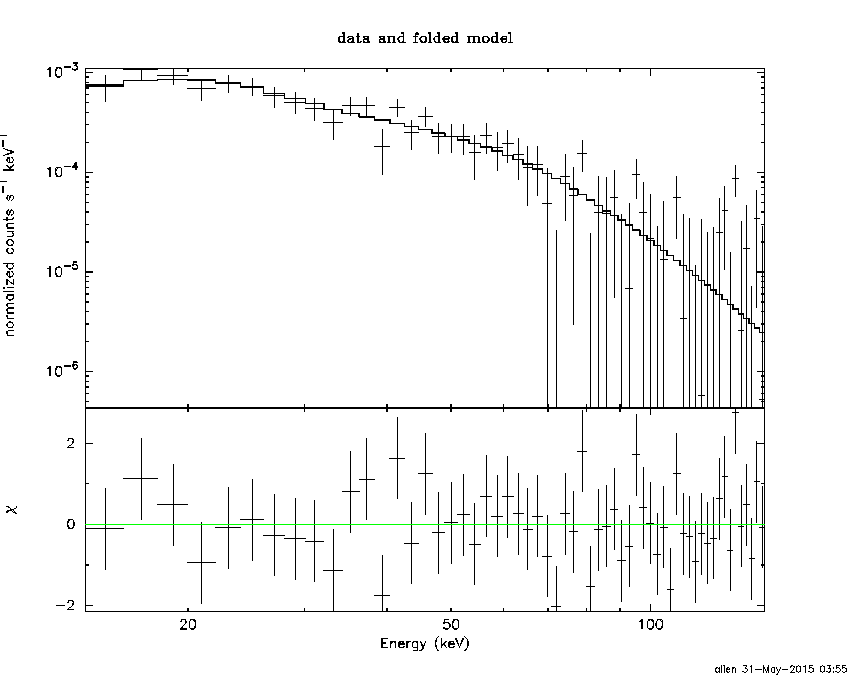
Pre-slew spectrum (Pre-slew PHA with pre-slew DRM)
Power-law model
Spectral model in power-law:
------------------------------------------------------------
Parameters  : value       lower 90%   higher 90%
Photon index: 1.98479     ( -0.256096   0.277694 )
Norm@50keV  : 8.83110E-04    ( -0.000167551   0.00016293 )
------------------------------------------------------------
#Fit statistic : Chi-Squared =          55.06 using 59 PHA bins.
# Reduced chi-squared =         0.9659 for     57 degrees of freedom
# Null hypothesis probability =   5.483940e-01

Photon flux (15-150 keV)    in 46.6 sec: 0.131549 ( -0.0186575  0.0186578 ) ph/cm2/s
Energy fluence (15-150 keV)             : 3.79229e-07 ( -6.6666e-08  6.91241e-08 ) ergs/cm2
Cutoff power-law model

Spectral model in the cutoff power-law:
------------------------------------------------------------
Parameters  : value       lower 90%   higher 90%
Photon index: 0.897191     ( -1.44024   1.10351 )
Epeak [keV] : 41.4121      (   )
Norm@50keV  : 3.82489E-03    (     )
------------------------------------------------------------
#Fit statistic : Chi-Squared =          52.35 using 59 PHA bins.
# Reduced chi-squared =         0.9348 for     56 degrees of freedom
# Null hypothesis probability =   6.137728e-01

Photon flux (15-150 keV)    in 46.6 sec: 0.127185 ( -0.018948  0.019065 ) ph/cm2/s
Energy fluence (15-150 keV)             : 3.43428e-07 ( -6.58616e-08  7.54771e-08 ) ergs/cm2
Band function

Spectral model in the Band function:
------------------------------------------------------------
Parameters  : value       lower 90%   higher 90%
alpha       : -0.956711   ( 0.956711   0.956711 )
beta        : -8.34793    ( 5.58026   15.5802 )
Epeak [keV] : 41.4010      ( -41.401 50.286 )
Norm@50keV   : 3.53836E-03    ( -0.00222819   874.919 )
------------------------------------------------------------
#Fit statistic : Chi-Squared =          52.36 using 59 PHA bins.
# Reduced chi-squared =         0.9520 for     55 degrees of freedom
# Null hypothesis probability =   5.762138e-01

Photon flux (15-150 keV)    in 46.6 sec:  (    ) ph/cm2/s
Energy fluence (15-150 keV)             : 0 ( 0  0 ) ergs/cm2
S(25-50 keV) vs. S(50-100 keV) plot
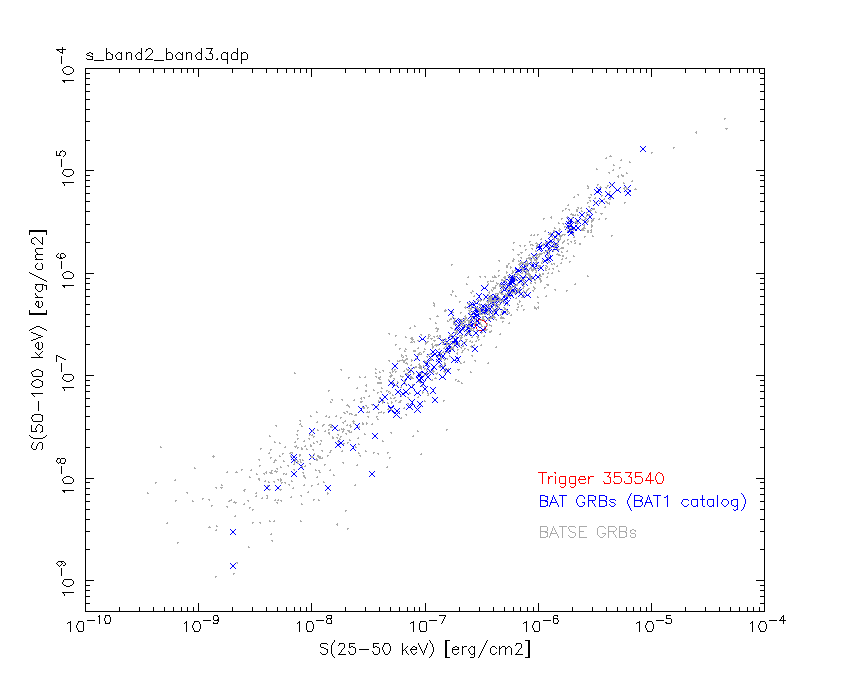
S(25-50 keV)  = 3.11e-07
S(50-100 keV) = 3.14e-07
T90 vs. Hardness ratio plot

T90                                   = 70.444000005722 sec.
Hardness ratio (energy fluence ratio) = 1.00965
Color vs. Color plot

Count Ratio  (25-50 keV) / (15-25 keV) = 1.12662
Count Ratio (50-100 keV) / (15-25 keV) = 0.528846
Mask shadow pattern
IMX = 3.720201844102486E-01, IMY = -1.935054301786858E-01
TIME vs. PHA plot around the trigger time

TIME vs. DetID plot around the trigger time

100 us light curve (15-350 keV)

Spacecraft aspect plot

Bright source in the pre-burst/pre-slew/post-slew images
Pre-burst image of 15-350 keV band
Time interval of the image:
Pre-slew background subtracted image of 15-350 keV band
Time interval of the image:
-7.299400 39.300000

# RAcent  DECcent POSerr Theta    Phi  PeakCts   SNR AngSep     Name
#  [deg]    [deg]    ['] [deg]  [deg]                   [']
185.0289 -16.4569    2.3  33.6  148.7   0.5008   5.1 ------	UNKNOWN
212.4460  24.4544    1.0  22.8   27.5   0.7425  11.8 ------	UNKNOWN
159.1174  18.5193    2.5  29.0 -121.1   0.4004   4.6 ------	UNKNOWN
178.3701  49.1574    2.6  33.6  -52.3   0.3845   4.4 ------	UNKNOWN
Post-slew image of 15-350 keV band
Time interval of the image:
186.300590 963.080000

# RAcent  DECcent POSerr Theta    Phi  PeakCts   SNR AngSep     Name
#  [deg]    [deg]    ['] [deg]  [deg]                   [']
254.4594  35.2587   36.2  37.7   12.0  -0.1720  -0.3    5.0	Her X-1
280.3165  52.6396    2.7  57.5   -9.5   7.8918   4.3 ------	UNKNOWN
246.1746  63.6535    2.9  45.0  -30.9   2.8697   3.9 ------	UNKNOWN
Plot creation:
Sun May 31 03:56:32 EDT 2015