Click here for the BAT GCN circular template
Image
Pre-slew 15.0-350.0 keV image (Event data)

#   RAcent    DECcent   POSerr    Theta     Phi              Peak Cts       SNR   Name
  191.1913    44.1063   0.0153    19.9310    -6.7939         0.1831166     12.533 TRIG_00354299

Foreground time interval of the image:
  0.060   2.488 (delta_t =   2.428 [sec])
Background time interval of the image:
-60.208   0.060 (delta_t =  60.268 [sec])
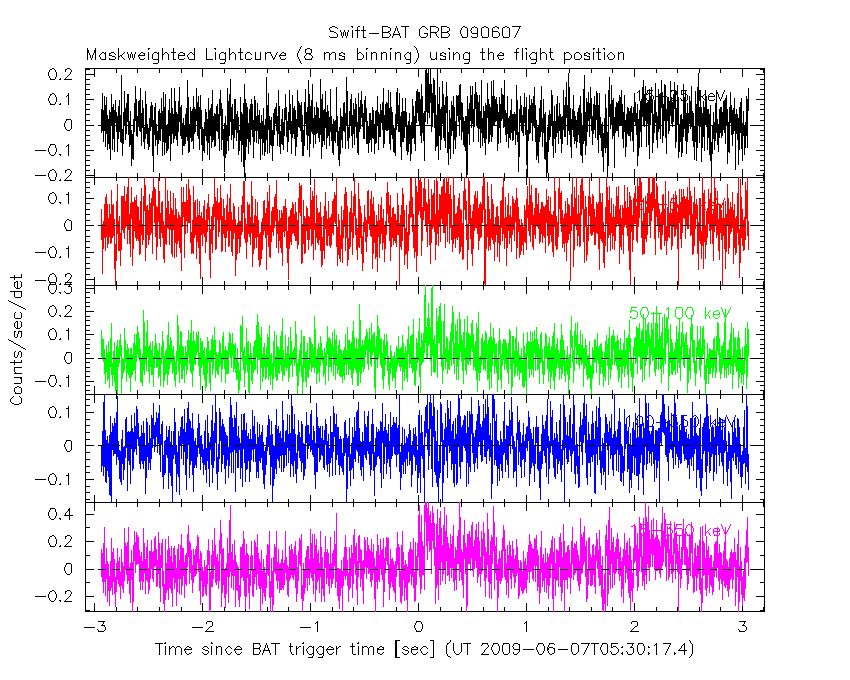
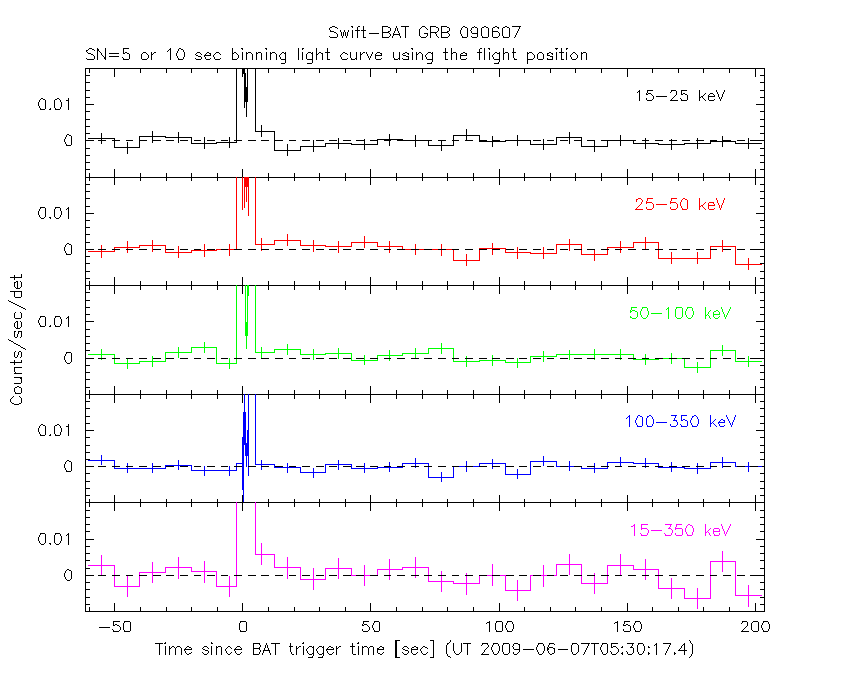
Lightcurves
Notes:
- 1) The mask-weighted light curves are using the flight position.
- 2) Multiple plots of different time binning/intervals are shown to cover all scenarios of short/long GRBs, rate/image triggers, and real/false positives.
- 3) For all the mask-weighted lightcurves, the y-axis units are counts/sec/det where a det is 0.4 x 0.4 = 0.16 sq cm.
- 4) The verticle lines correspond to following: green dotted lines are T50 interval, black dotted lines are T90 interval, blue solid line(s) is a spacecraft slew start time, and orange solid line(s) is a spacecraft slew end time.
- 5) Time of each bin is in the middle of the bin.
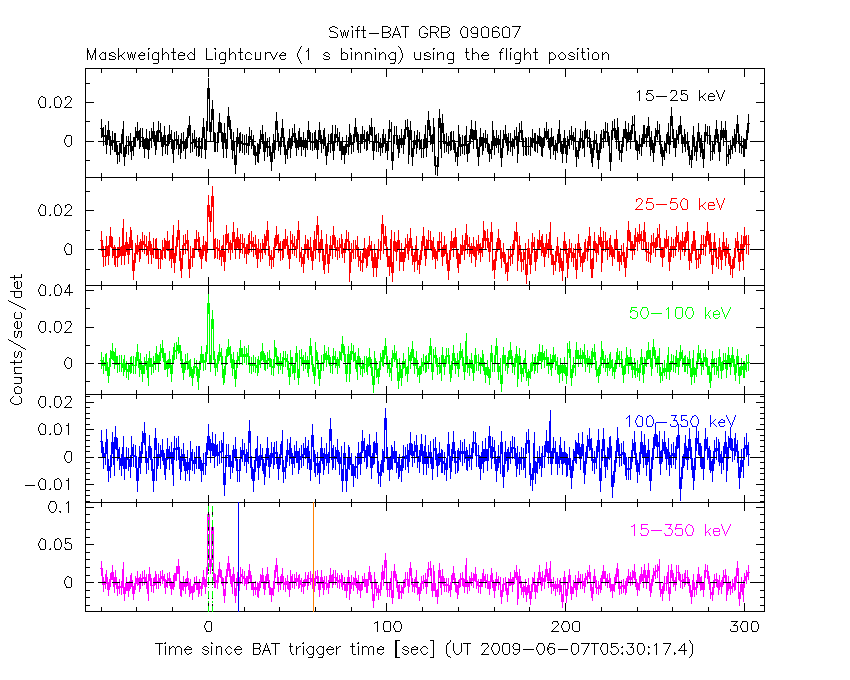
1 s binning
From T0-310 s to T0+310 s

From T100_start - 20 s to T100_end + 30 s

Full time interval
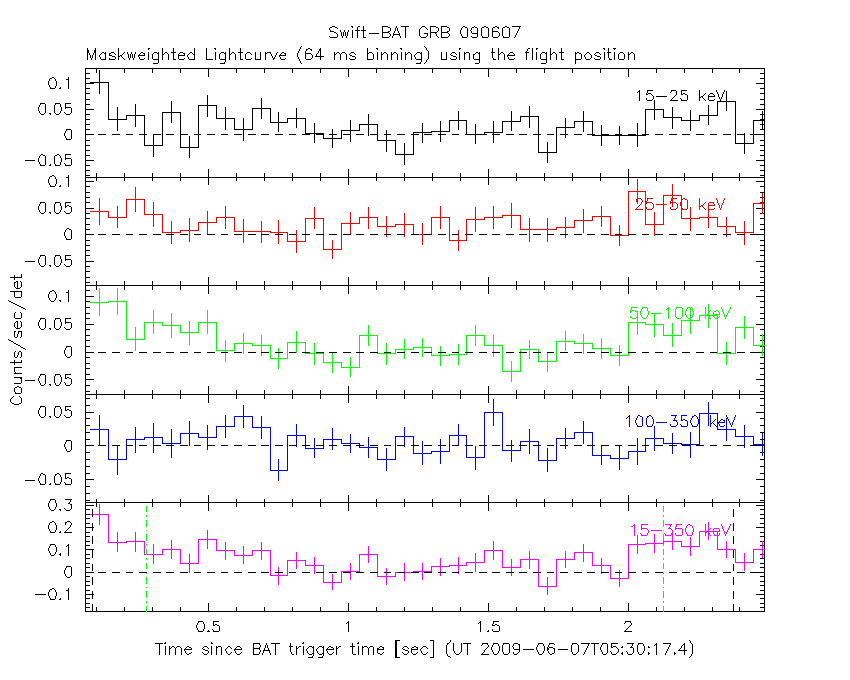
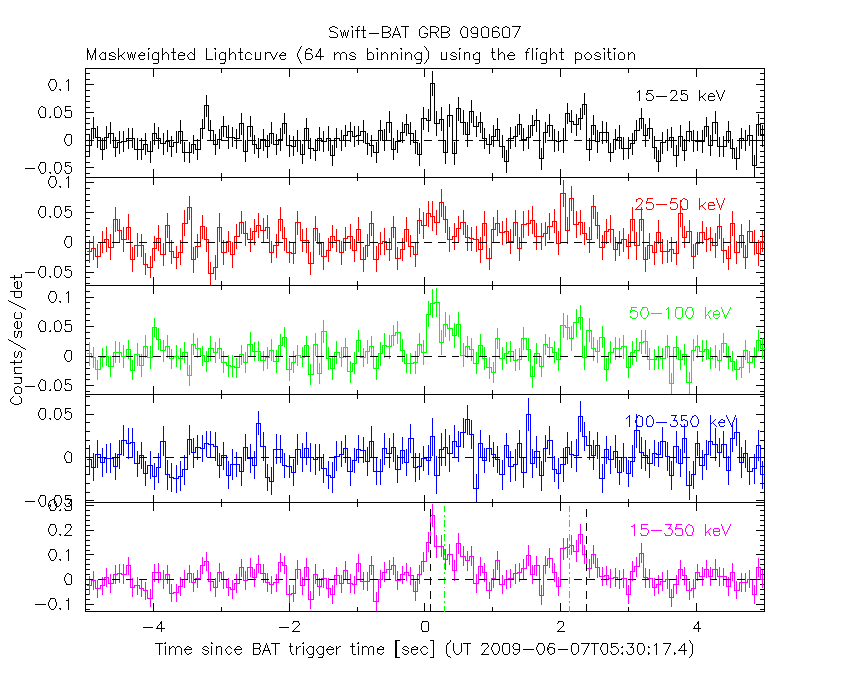
64 ms binning
Full time interval

From T100_start to T100_end
From T0-5 sec to T0+5 sec
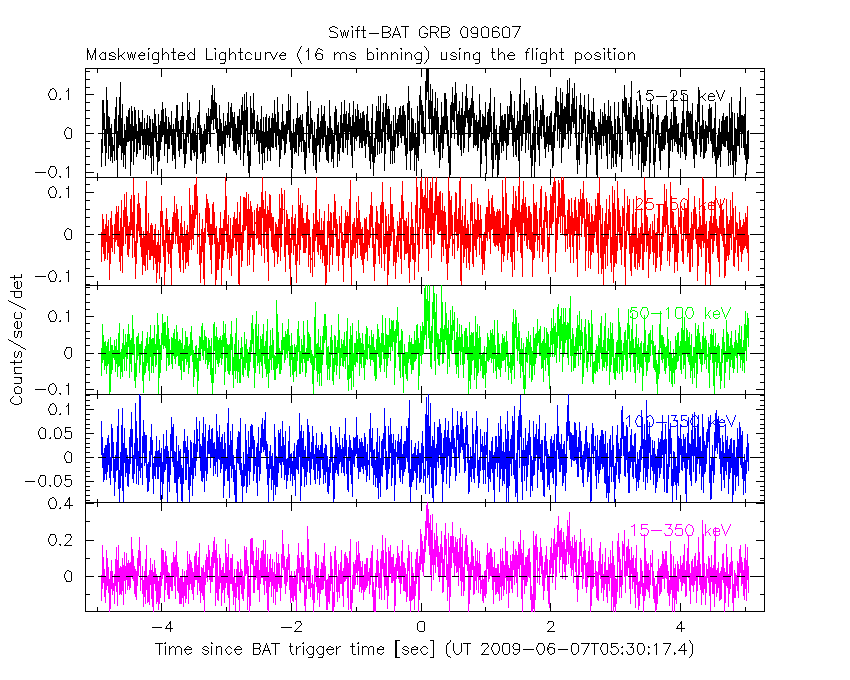
16 ms binning
From T100_start-5 s to T100_start+5 s
8 ms binning
From T100_start-3 s to T100_start+3 s
2 ms binning
From T100_start-1 s to T100_start+1 s

SN=5 or 10 sec. binning (whichever binning is satisfied first)

SN=5 or 10 sec. binning (T < 200 sec)
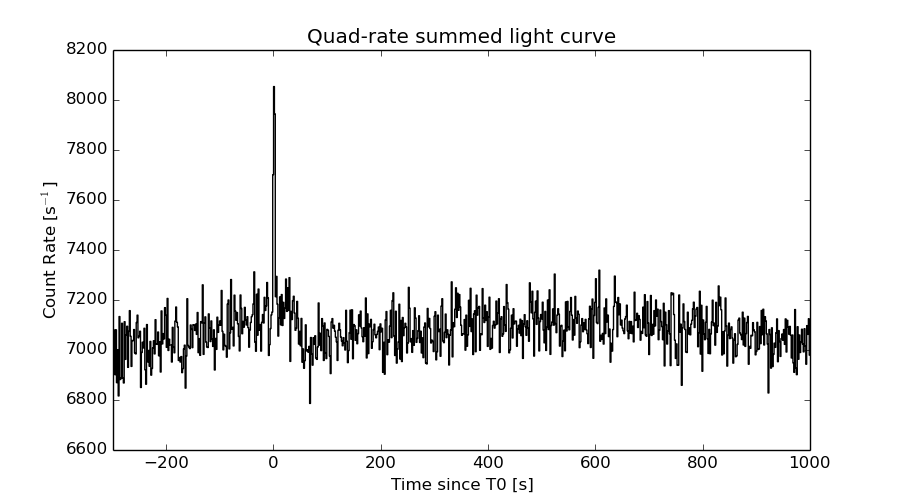
Quad-rate summed light curves (from T0-300s to T0+1000s)
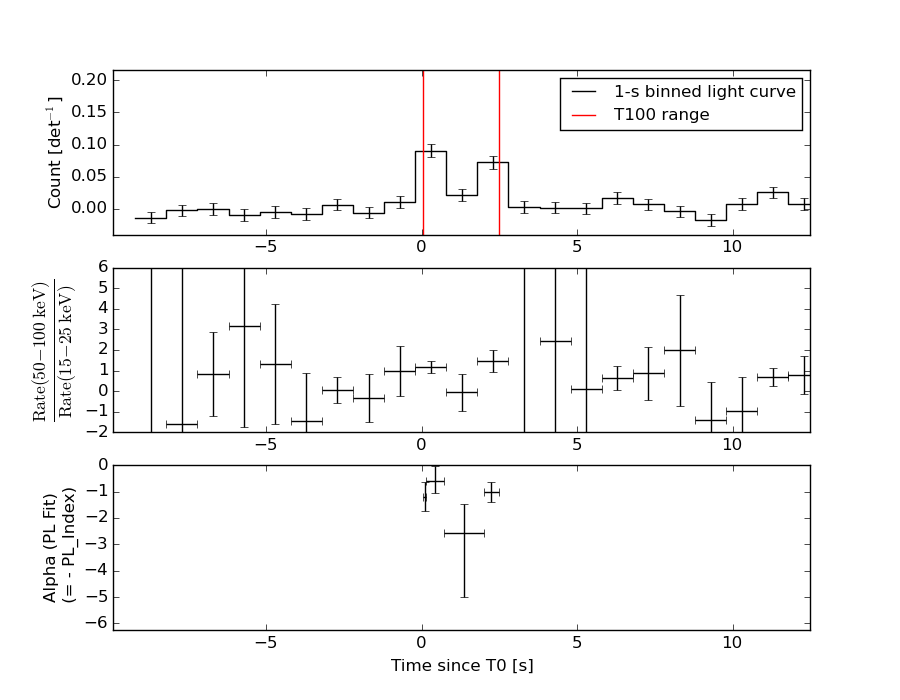
Spectral Evolution
Spectra
Notes:
- 1) The fitting includes the systematic errors.
- 2) When the burst includes telescope slew time periods, the fitting uses an average response file made from multiple 5-s response files through out the slew time plus single time preiod for the non-slew times, and weighted by the total counts in the corresponding time period using addrmf. An average response file is needed becuase a spectral fit using the pre-slew DRM will introduce some errors in both a spectral shape and a normalization if the PHA file contains a lot of the slew/post-slew time interval.
- 3) For fits to more complicated models (e.g. a power-law over a cutoff power-law), the BAT team has decided to require a chi-square improvement of more than 6 for each extra dof.
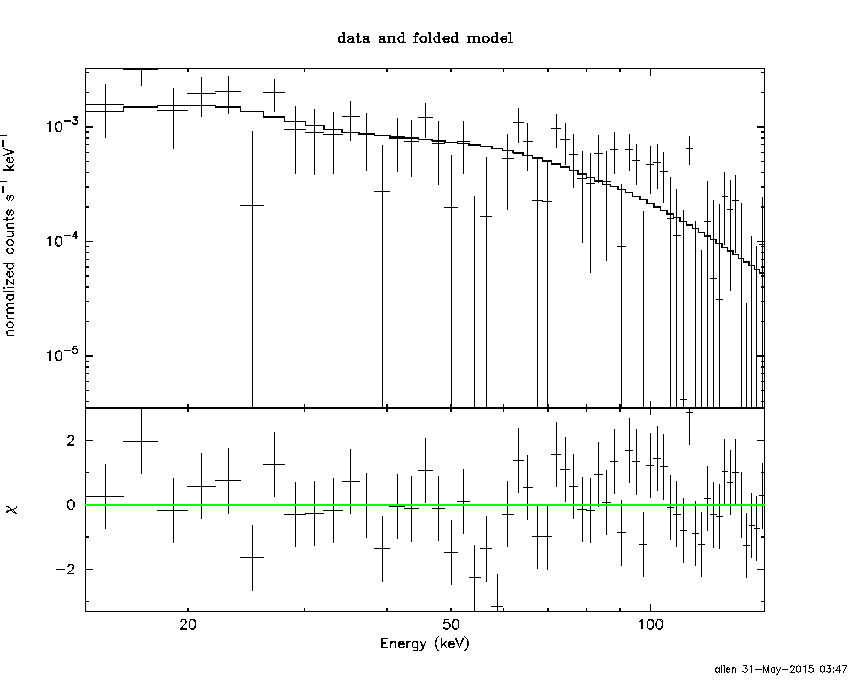
Time averaged spectrum fit using the average DRM
Power-law model

Time interval is from    0.060 sec. to    2.488 sec.

Spectral model in power-law:
------------------------------------------------------------
Parameters  : value       lower 90%   higher 90%
Photon index: 1.15548     ( -0.303173   0.294583 )
Norm@50keV  : 4.57827E-03    ( -0.000655353   0.000655296 )
------------------------------------------------------------
#Fit statistic : Chi-Squared =          71.54 using 59 PHA bins.
# Reduced chi-squared =          1.255 for     57 degrees of freedom
# Null hypothesis probability =   9.309568e-02

Photon flux (15-150 keV)    in 2.428 sec: 0.534259 ( -0.078981  0.0791911 ) ph/cm2/s
Energy fluence (15-150 keV)             : 1.14252e-07 ( -1.89556e-08  1.91539e-08 ) ergs/cm2
Cutoff power-law model

Time interval is from    0.060 sec. to    2.488 sec.
Spectral model in the cutoff power-law:
------------------------------------------------------------
Parameters  : value       lower 90%   higher 90%
Photon index: 1.15266     ( -0.280109   0.27138 )
Epeak [keV] : 1.00000E+04      (   )
Norm@50keV  : 4.60080E-03    (     )
------------------------------------------------------------
#Fit statistic : Chi-Squared =          71.58 using 59 PHA bins.
# Reduced chi-squared =          1.278 for     56 degrees of freedom
# Null hypothesis probability =   7.841981e-02

Photon flux (15-150 keV)    in 2.428 sec: 0.536810 ( -0.080492  0.077131 ) ph/cm2/s
Energy fluence (15-150 keV)             : 1.13901e-07 ( -1.86157e-08  1.81051e-08 ) ergs/cm2
Band function
Time interval is from    0.060 sec. to    2.488 sec.

Spectral model in the Band function:
------------------------------------------------------------
Parameters  : value       lower 90%   higher 90%
alpha       : -0.976785   ( 0.976769   0.976769 )
beta        : -1.15536    ( 1.15527   0.303535 )
Epeak [keV] : 39.1716      ( -39.2407 -39.2407 )
Norm@50keV   : 7.80861E-03    ( -0.00387996   0.248172 )
------------------------------------------------------------
#Fit statistic : Chi-Squared =          71.54 using 59 PHA bins.
# Reduced chi-squared =          1.301 for     55 degrees of freedom
# Null hypothesis probability =   6.627713e-02

Photon flux (15-150 keV)    in 2.428 sec:  (    ) ph/cm2/s
Energy fluence (15-150 keV)             : 0 ( 0  0 ) ergs/cm2
Single BB
Spectral model blackbody:
------------------------------------------------------------
Parameters  : value    Lower 90%  Upper 90%
kT [keV]    : 26.9049  (-6.49921  9.39584)
R^2/D10^2   : 9.46381E-03  (-0.00537353   0.0123115)
(R is the radius in km and D10 is the distance to the source in units of 10 kpc)
------------------------------------------------------------
#Fit statistic : Chi-Squared =          93.63 using 59 PHA bins.
# Reduced chi-squared =          1.643 for     57 degrees of freedom
# Null hypothesis probability =   1.601497e-03

Energy  Fluence     90% Error
[keV]   [erg/cm2]   [erg/cm2]
15- 25  2.775e-09   9.235e-10
25- 50  1.632e-08   4.895e-09
50-150  8.638e-08   2.611e-08
15-150  1.055e-07   2.876e-08
Thermal bremsstrahlung (OTTB)

Spectral model: thermal bremsstrahlung
------------------------------------------------------------
Parameters  : value         Lower 90%    Upper 90%
kT [keV]    : 200.000       (      )
Norm        : 2.18310       (-0.321883     0.321856)
------------------------------------------------------------
#Fit statistic : Chi-Squared =          79.05 using 59 PHA bins.
# Reduced chi-squared =          1.387 for     57 degrees of freedom
# Null hypothesis probability =   2.824518e-02

Energy  Fluence     90% Error
[keV]   [erg/cm2]   [erg/cm2]
15- 25  1.320e-08   7.535e-09
25- 50  2.539e-08   1.423e-08
50-150  5.568e-08   3.169e-08
15-150  9.427e-08   5.263e-08
Double BB

Spectral model: bbodyrad<1> + bbodyrad<2>
------------------------------------------------------------
Parameters  : value         Lower 90%    Upper 90%
kT1 [keV]   : 5.78316        (-1.71432      2.04836)
R1^2/D10^2  : 1.21624        (-0.849725      4.22357)
kT2 [keV]   : 45.5266        (-14.1719      41.1103)
R2^2/D10^2  : 2.00310E-03    (-0.0015074   0.00345296)
------------------------------------------------------------
#Fit statistic : Chi-Squared =          64.18 using 59 PHA bins.
# Reduced chi-squared =          1.167 for     55 degrees of freedom
# Null hypothesis probability =   1.856630e-01

Energy  Fluence     90% Error
[keV]   [erg/cm2]   [erg/cm2]
15- 25  1.361e-08   7.569e-09
25- 50  1.978e-08   8.704e-09
50-150  9.363e-08   5.105e-08
15-150  1.270e-07   6.094e-08
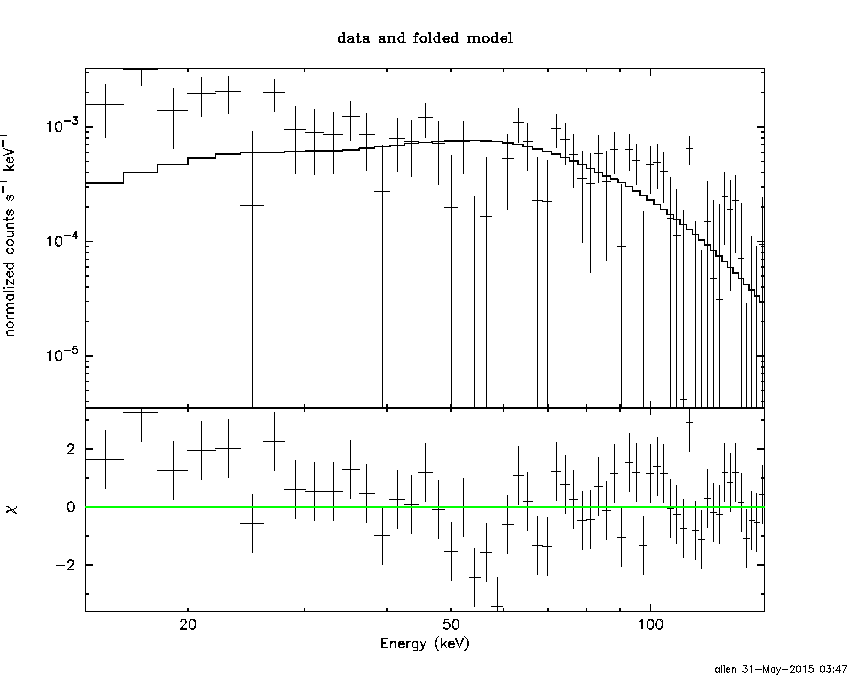
Peak spectrum fit
Power-law model

Time interval is from   -0.010 sec. to    0.990 sec.

Spectral model in power-law:
------------------------------------------------------------
Parameters  : value       lower 90%   higher 90%
Photon index: 1.13513     ( -0.424513   0.41311 )
Norm@50keV  : 5.72711E-03    ( -0.00104506   0.00104505 )
------------------------------------------------------------
#Fit statistic : Chi-Squared =          69.43 using 59 PHA bins.
# Reduced chi-squared =          1.218 for     57 degrees of freedom
# Null hypothesis probability =   1.250103e-01

Photon flux (15-150 keV)    in 1 sec: 0.666710 ( -0.125501  0.125566 ) ph/cm2/s
Energy fluence (15-150 keV)             : 5.92286e-08 ( -1.30089e-08  1.31414e-08 ) ergs/cm2
Cutoff power-law model

Time interval is from   -0.010 sec. to    0.990 sec.
Spectral model in the cutoff power-law:
------------------------------------------------------------
Parameters  : value       lower 90%   higher 90%
Photon index: 1.13648     ( -0.484447   0.372066 )
Epeak [keV] : 1.00000E+04      (   )
Norm@50keV  : 5.75374E-03    ( -0.00104884   -0.00575375 )
------------------------------------------------------------
#Fit statistic : Chi-Squared =          69.46 using 59 PHA bins.
# Reduced chi-squared =          1.240 for     56 degrees of freedom
# Null hypothesis probability =   1.066709e-01

Photon flux (15-150 keV)    in 1 sec: 0.665869 ( -0.122765  0.125755 ) ph/cm2/s
Energy fluence (15-150 keV)             : 5.83397e-08 ( -1.20318e-08  1.26341e-08 ) ergs/cm2
Band function

Time interval is from   -0.010 sec. to    0.990 sec.

Spectral model in the Band function:
------------------------------------------------------------
Parameters  : value       lower 90%   higher 90%
alpha       : -0.963642   ( 0.963404   0.963404 )
beta        : -1.13552    ( -0.413378   0.425552 )
Epeak [keV] : 40.5557      ( -40.3418 -40.3418 )
Norm@50keV   : 9.60131E-03    ( -0.00490922   4880.93 )
------------------------------------------------------------
#Fit statistic : Chi-Squared =          69.43 using 59 PHA bins.
# Reduced chi-squared =          1.262 for     55 degrees of freedom
# Null hypothesis probability =   9.119656e-02

Photon flux (15-150 keV)    in 1 sec:  (    ) ph/cm2/s
Energy fluence (15-150 keV)             : 0 ( 0  0 ) ergs/cm2
Single BB

Spectral model blackbody:
------------------------------------------------------------
Parameters  : value    Lower 90%  Upper 90%
kT [keV]    : 30.8087  (-8.59934  15.0898)
R^2/D10^2   : 8.19806E-03  (-0.00529585   0.0128698)
(R is the radius in km and D10 is the distance to the source in units of 10 kpc)
------------------------------------------------------------
#Fit statistic : Chi-Squared =          82.57 using 59 PHA bins.
# Reduced chi-squared =          1.449 for     57 degrees of freedom
# Null hypothesis probability =   1.502919e-02

Energy  Fluence     90% Error
[keV]   [erg/cm2]   [erg/cm2]
15- 25  1.197e-09   5.523e-10
25- 50  7.466e-09   3.078e-09
50-150  4.952e-08   2.391e-08
15-150  5.819e-08   2.518e-08
Thermal bremsstrahlung (OTTB)

Spectral model: thermal bremsstrahlung
------------------------------------------------------------
Parameters  : value         Lower 90%    Upper 90%
kT [keV]    : 200.000       (      )
Norm        : 2.70119       (-0.509529     0.509505)
------------------------------------------------------------
#Fit statistic : Chi-Squared =          74.58 using 59 PHA bins.
# Reduced chi-squared =          1.308 for     57 degrees of freedom
# Null hypothesis probability =   5.895299e-02

Energy  Fluence     90% Error
[keV]   [erg/cm2]   [erg/cm2]
15- 25  6.726e-09   3.878e-09
25- 50  1.294e-08   7.535e-09
50-150  2.838e-08   1.624e-08
15-150  4.804e-08   2.737e-08
Double BB
Spectral model: bbodyrad<1> + bbodyrad<2>
------------------------------------------------------------
Parameters  : value         Lower 90%    Upper 90%
kT1 [keV]   : 4.36185        (-1.22032      1.61584)
R1^2/D10^2  : 5.60247        (-4.26483      18.3293)
kT2 [keV]   : 44.8472        (-14.6213      43.5032)
R2^2/D10^2  : 2.80674E-03    (-0.0021423   0.00509217)
------------------------------------------------------------
#Fit statistic : Chi-Squared =          58.27 using 59 PHA bins.
# Reduced chi-squared =          1.060 for     55 degrees of freedom
# Null hypothesis probability =   3.558884e-01

Energy  Fluence     90% Error
[keV]   [erg/cm2]   [erg/cm2]
15- 25  8.303e-09   4.520e-09
25- 50  8.219e-09   3.585e-09
50-150  5.154e-08   2.976e-08
15-150  6.807e-08   3.387e-08
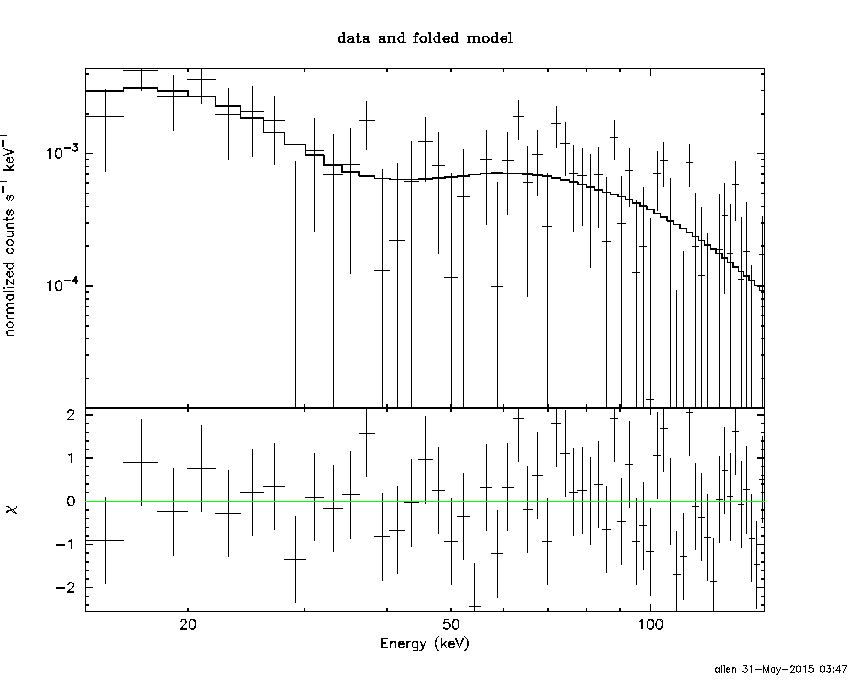
Pre-slew spectrum (Pre-slew PHA with pre-slew DRM)
Power-law model

Spectral model in power-law:
------------------------------------------------------------
Parameters  : value       lower 90%   higher 90%
Photon index: 1.15548     ( -0.303173   0.294583 )
Norm@50keV  : 4.57827E-03    ( -0.000655353   0.000655296 )
------------------------------------------------------------
#Fit statistic : Chi-Squared =          71.54 using 59 PHA bins.
# Reduced chi-squared =          1.255 for     57 degrees of freedom
# Null hypothesis probability =   9.309568e-02

Photon flux (15-150 keV)    in 2.428 sec: 0.534259 ( -0.078981  0.0791911 ) ph/cm2/s
Energy fluence (15-150 keV)             : 1.14252e-07 ( -1.89556e-08  1.91539e-08 ) ergs/cm2
Cutoff power-law model

Spectral model in the cutoff power-law:
------------------------------------------------------------
Parameters  : value       lower 90%   higher 90%
Photon index: 1.15266     ( -0.280109   0.27138 )
Epeak [keV] : 1.00000E+04      (   )
Norm@50keV  : 4.60080E-03    (     )
------------------------------------------------------------
#Fit statistic : Chi-Squared =          71.58 using 59 PHA bins.
# Reduced chi-squared =          1.278 for     56 degrees of freedom
# Null hypothesis probability =   7.841981e-02

Photon flux (15-150 keV)    in 2.428 sec: 0.536810 ( -0.080427  0.077131 ) ph/cm2/s
Energy fluence (15-150 keV)             : 1.13901e-07 ( -1.86157e-08  1.81051e-08 ) ergs/cm2
Band function

Spectral model in the Band function:
------------------------------------------------------------
Parameters  : value       lower 90%   higher 90%
alpha       : -0.976785   ( 0.976769   0.976769 )
beta        : -1.15536    ( 1.15527   0.303535 )
Epeak [keV] : 39.1716      ( -39.2407 -39.2407 )
Norm@50keV   : 7.80861E-03    ( -0.00387996   0.287213 )
------------------------------------------------------------
#Fit statistic : Chi-Squared =          71.54 using 59 PHA bins.
# Reduced chi-squared =          1.301 for     55 degrees of freedom
# Null hypothesis probability =   6.627713e-02

Photon flux (15-150 keV)    in 2.428 sec:  (    ) ph/cm2/s
Energy fluence (15-150 keV)             : 0 ( 0  0 ) ergs/cm2
S(25-50 keV) vs. S(50-100 keV) plot

S(25-50 keV)  = 2.34e-08
S(50-100 keV) = 4.19e-08
T90 vs. Hardness ratio plot

T90                                   = 2.29200002551079 sec.
Hardness ratio (energy fluence ratio) = 1.7906
Color vs. Color plot

Count Ratio  (25-50 keV) / (15-25 keV) = 1.17781
Count Ratio (50-100 keV) / (15-25 keV) = 1.11368
Mask shadow pattern

IMX = 3.600613765182163E-01, IMY = 4.289605819807337E-02
TIME vs. PHA plot around the trigger time

TIME vs. DetID plot around the trigger time

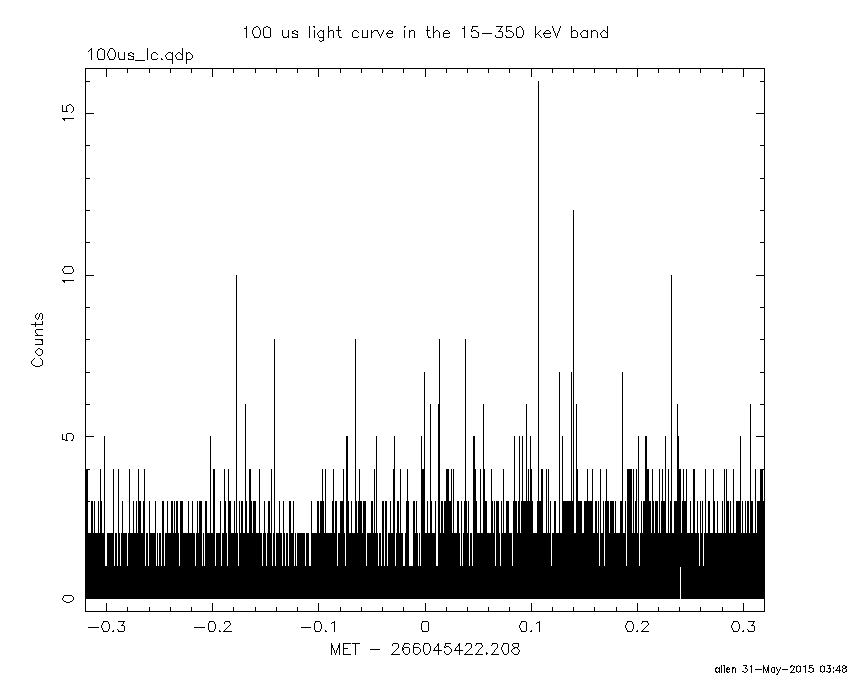
100 us light curve (15-350 keV)
Spacecraft aspect plot

Bright source in the pre-burst/pre-slew/post-slew images
Pre-burst image of 15-350 keV band
Time interval of the image:
-60.208000 0.060000

# RAcent  DECcent POSerr Theta    Phi  PeakCts   SNR AngSep     Name
#  [deg]    [deg]    ['] [deg]  [deg]                   [']
202.9037   4.1539    2.2  31.8   98.5   0.7214   5.4 ------	UNKNOWN
190.3362   3.1068    3.1  25.7  121.7   0.3514   3.7 ------	UNKNOWN
195.2254  69.3617    2.6  43.8  -24.3   0.5343   4.5 ------	UNKNOWN
Pre-slew background subtracted image of 15-350 keV band
Time interval of the image:
0.060000 2.488000

# RAcent  DECcent POSerr Theta    Phi  PeakCts   SNR AngSep     Name
#  [deg]    [deg]    ['] [deg]  [deg]                   [']
188.5009  -2.2632    1.7  30.2  129.3   0.1529   6.7 ------	UNKNOWN
177.5236  14.9492    2.4  11.8  156.4   0.0709   4.8 ------	UNKNOWN
191.1913  44.1063    0.9  19.9   -6.8   0.1831  12.5 ------	UNKNOWN
Post-slew image of 15-350 keV band
Time interval of the image:
59.092590 302.854300

# RAcent  DECcent POSerr Theta    Phi  PeakCts   SNR AngSep     Name
#  [deg]    [deg]    ['] [deg]  [deg]                   [']
254.4016  35.2054    4.4  48.2   44.2   1.9920   2.6    8.7	Her X-1
259.6061  38.8655    3.5  50.0   37.2   2.8021   3.3 ------	UNKNOWN
235.9076  29.0313    3.2  38.4   64.1   1.7807   3.6 ------	UNKNOWN
172.9111  -5.1982    2.7  52.0  169.7   2.5207   4.3 ------	UNKNOWN
172.5813   7.1828    2.8  40.4  175.6   1.0848   4.2 ------	UNKNOWN
294.5325  63.2048    2.6  56.8   -2.1   3.5027   4.5 ------	UNKNOWN
160.1390   8.8264    2.1  44.4 -166.9   1.6657   5.6 ------	UNKNOWN
  7.7829  81.4179    3.4  54.4  -33.1   3.1465   3.4 ------	UNKNOWN
Plot creation:
Sun May 31 03:48:29 EDT 2015