Special notes of this burst
Image
Pre-slew 15.0-350.0 keV image (Event data)
#   RAcent    DECcent   POSerr    Theta     Phi              Peak Cts       SNR   Name
   93.5056    64.0739   0.0128    37.0464   -87.5126         2.5372834     15.054 TRIG_00356912

Foreground time interval of the image:
 -5.408  27.760 (delta_t =  33.168 [sec])
Background time interval of the image:
-239.776  -5.408 (delta_t = 234.368 [sec])
Lightcurves
Notes:
- 1) The mask-weighted light curves are using the flight position.
- 2) Multiple plots of different time binning/intervals are shown to cover all scenarios of short/long GRBs, rate/image triggers, and real/false positives.
- 3) For all the mask-weighted lightcurves, the y-axis units are counts/sec/det where a det is 0.4 x 0.4 = 0.16 sq cm.
- 4) The verticle lines correspond to following: green dotted lines are T50 interval, black dotted lines are T90 interval, blue solid line(s) is a spacecraft slew start time, and orange solid line(s) is a spacecraft slew end time.
- 5) Time of each bin is in the middle of the bin.
1 s binning
From T0-310 s to T0+310 s
From T100_start - 20 s to T100_end + 30 s
Full time interval
64 ms binning
Full time interval
From T100_start to T100_end
From T0-5 sec to T0+5 sec
16 ms binning
From T100_start-5 s to T100_start+5 s
Blue+Cyan dotted lines: Time interval of the scaled map
From 0.000000 to 1.024000
8 ms binning
From T100_start-3 s to T100_start+3 s
Blue+Cyan dotted lines: Time interval of the scaled map
From 0.000000 to 1.024000
2 ms binning
From T100_start-1 s to T100_start+1 s
Blue+Cyan dotted lines: Time interval of the scaled map
From 0.000000 to 1.024000
SN=5 or 10 sec. binning (whichever binning is satisfied first)
SN=5 or 10 sec. binning (T < 200 sec)
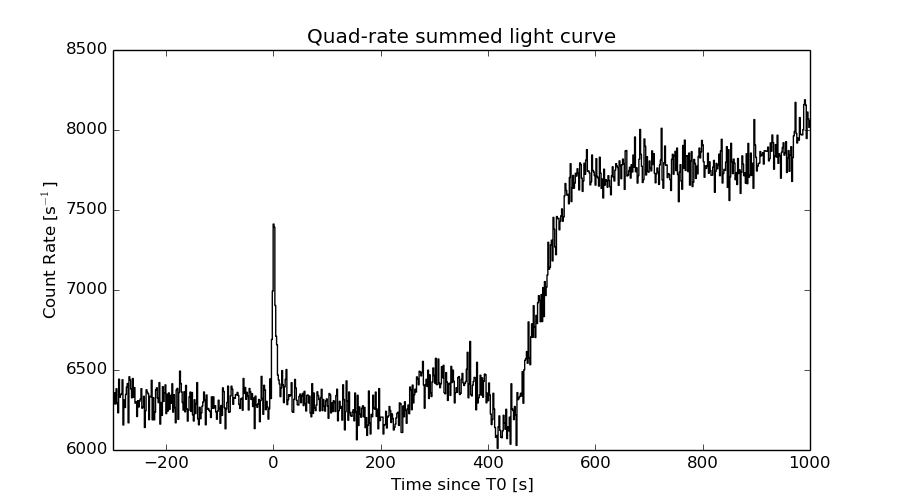
Quad-rate summed light curves (from T0-300s to T0+1000s)
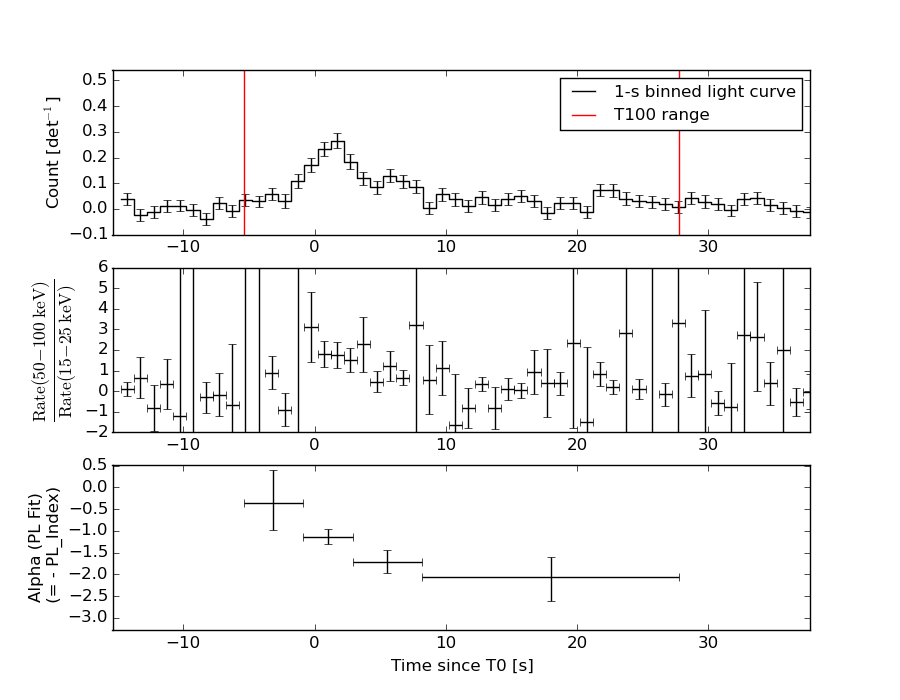
Spectral Evolution
Spectra
Notes:
- 1) The fitting includes the systematic errors.
- 2) When the burst includes telescope slew time periods, the fitting uses an average response file made from multiple 5-s response files through out the slew time plus single time preiod for the non-slew times, and weighted by the total counts in the corresponding time period using addrmf. An average response file is needed becuase a spectral fit using the pre-slew DRM will introduce some errors in both a spectral shape and a normalization if the PHA file contains a lot of the slew/post-slew time interval.
- 3) For fits to more complicated models (e.g. a power-law over a cutoff power-law), the BAT team has decided to require a chi-square improvement of more than 6 for each extra dof.
Time averaged spectrum fit using the average DRM
Power-law model

Time interval is from   -5.408 sec. to   27.760 sec.

Spectral model in power-law:
------------------------------------------------------------
Parameters  : value       lower 90%   higher 90%
Photon index: 1.44926     ( -0.170551   0.171826 )
Norm@50keV  : 4.63401E-03    ( -0.00047377   0.000472473 )
------------------------------------------------------------
#Fit statistic : Chi-Squared =          45.52 using 59 PHA bins.
# Reduced chi-squared =         0.7985 for     57 degrees of freedom
# Null hypothesis probability =   8.630173e-01

Photon flux (15-150 keV)    in 33.17 sec: 0.570974 ( -0.0590903  0.0592032 ) ph/cm2/s
Energy fluence (15-150 keV)             : 1.4711e-06 ( -1.63776e-07  1.65009e-07 ) ergs/cm2
Cutoff power-law model

Time interval is from   -5.408 sec. to   27.760 sec.
Spectral model in the cutoff power-law:
------------------------------------------------------------
Parameters  : value       lower 90%   higher 90%
Photon index: 0.728859     ( -0.846621   0.711017 )
Epeak [keV] : 92.1776      ( -25.4556 890.846 )
Norm@50keV  : 1.03869E-02    (     )
------------------------------------------------------------
#Fit statistic : Chi-Squared =          42.54 using 59 PHA bins.
# Reduced chi-squared =         0.7596 for     56 degrees of freedom
# Null hypothesis probability =   9.077192e-01

Photon flux (15-150 keV)    in 33.17 sec: 0.553459 ( -0.062044  0.061738 ) ph/cm2/s
Energy fluence (15-150 keV)             : 1.41236e-06 ( -1.74713e-07  1.76037e-07 ) ergs/cm2
Band function

Time interval is from   -5.408 sec. to   27.760 sec.

Spectral model in the Band function:
------------------------------------------------------------
Parameters  : value       lower 90%   higher 90%
alpha       : -0.761186   ( -0.427386   0.685159 )
beta        : -9.36346    ( 9.37131   19.3713 )
Epeak [keV] : 94.7725      ( -23.6032 171.286 )
Norm@50keV   : 9.97521E-03    ( -0.00400847   0.00550117 )
------------------------------------------------------------
#Fit statistic : Chi-Squared =          42.55 using 59 PHA bins.
# Reduced chi-squared =         0.7736 for     55 degrees of freedom
# Null hypothesis probability =   8.899531e-01

Photon flux (15-150 keV)    in 33.17 sec: 0.554438 (    ) ph/cm2/s
Energy fluence (15-150 keV)             : 1.41602e-06 ( 0  0 ) ergs/cm2
Single BB
Spectral model blackbody:
------------------------------------------------------------
Parameters  : value    Lower 90%  Upper 90%
kT [keV]    : 16.4675  (-1.83902  2.10287)
R^2/D10^2   : 4.85050E-02  (-0.0166574   0.0247872)
(R is the radius in km and D10 is the distance to the source in units of 10 kpc)
------------------------------------------------------------
#Fit statistic : Chi-Squared =          55.82 using 59 PHA bins.
# Reduced chi-squared =         0.9793 for     57 degrees of freedom
# Null hypothesis probability =   5.194910e-01

Energy  Fluence     90% Error
[keV]   [erg/cm2]   [erg/cm2]
15- 25  8.960e-08   1.896e-08
25- 50  3.863e-07   5.524e-08
50-150  7.400e-07   1.360e-07
15-150  1.216e-06   1.733e-07
Thermal bremsstrahlung (OTTB)
Spectral model: thermal bremsstrahlung
------------------------------------------------------------
Parameters  : value         Lower 90%    Upper 90%
kT [keV]    : 200.000       (      )
Norm        : 2.36088       (-0.23719     0.237176)
------------------------------------------------------------
#Fit statistic : Chi-Squared =          44.81 using 59 PHA bins.
# Reduced chi-squared =         0.7861 for     57 degrees of freedom
# Null hypothesis probability =   8.793808e-01

Energy  Fluence     90% Error
[keV]   [erg/cm2]   [erg/cm2]
15- 25  1.950e-07   5.785e-08
25- 50  3.752e-07   1.977e-07
50-150  8.227e-07   4.440e-07
15-150  1.393e-06   7.496e-07
Double BB
Spectral model: bbodyrad<1> + bbodyrad<2>
------------------------------------------------------------
Parameters  : value         Lower 90%    Upper 90%
kT1 [keV]   : 4.79691        (-2.18436      3.31484)
R1^2/D10^2  : 1.76724        (-1.48993      34.2946)
kT2 [keV]   : 20.2121        (-3.25788      5.86114)
R2^2/D10^2  : 2.13624E-02    (-0.0135   0.0142535)
------------------------------------------------------------
#Fit statistic : Chi-Squared =          41.23 using 59 PHA bins.
# Reduced chi-squared =         0.7496 for     55 degrees of freedom
# Null hypothesis probability =   9.157715e-01

Energy  Fluence     90% Error
[keV]   [erg/cm2]   [erg/cm2]
15- 25  1.760e-07   8.460e-08
25- 50  3.496e-07   1.017e-07
50-150  8.477e-07   2.680e-07
15-150  1.373e-06   4.027e-07
Peak spectrum fit
Power-law model
Time interval is from    0.980 sec. to    1.980 sec.

Spectral model in power-law:
------------------------------------------------------------
Parameters  : value       lower 90%   higher 90%
Photon index: 1.30869     ( -0.254805   0.252664 )
Norm@50keV  : 1.85740E-02    ( -0.00305675   0.00305667 )
------------------------------------------------------------
#Fit statistic : Chi-Squared =          62.65 using 59 PHA bins.
# Reduced chi-squared =          1.099 for     57 degrees of freedom
# Null hypothesis probability =   2.826917e-01

Photon flux (15-150 keV)    in 1 sec: 2.21953 ( -0.377935  0.379245 ) ph/cm2/s
Energy fluence (15-150 keV)             : 1.83154e-07 ( -3.21107e-08  3.23148e-08 ) ergs/cm2
Cutoff power-law model
Time interval is from    0.980 sec. to    1.980 sec.
Spectral model in the cutoff power-law:
------------------------------------------------------------
Parameters  : value       lower 90%   higher 90%
Photon index: -1.47343E-02     ( -1.58004   1.1261 )
Epeak [keV] : 82.0523      ( -21.5077 143.787 )
Norm@50keV  : 7.90551E-02    ( -0.0790551   0.351358 )
------------------------------------------------------------
#Fit statistic : Chi-Squared =          58.45 using 59 PHA bins.
# Reduced chi-squared =          1.044 for     56 degrees of freedom
# Null hypothesis probability =   3.855231e-01

Photon flux (15-150 keV)    in 1 sec: 2.14145 ( -0.38658  0.38714 ) ph/cm2/s
Energy fluence (15-150 keV)             : 1.74687e-07 ( -3.4315e-08  3.4169e-08 ) ergs/cm2
Band function
Time interval is from    0.980 sec. to    1.980 sec.

Spectral model in the Band function:
------------------------------------------------------------
Parameters  : value       lower 90%   higher 90%
alpha       : 9.32917E-03   ( -5.44795   -2.95606 )
beta        : -10.0000    ( 10   1.77636e-15 )
Epeak [keV] : 82.1535      ( -18.428 143.224 )
Norm@50keV   : 7.86199E-02    ( -0.0786198   0.352095 )
------------------------------------------------------------
#Fit statistic : Chi-Squared =          58.45 using 59 PHA bins.
# Reduced chi-squared =          1.063 for     55 degrees of freedom
# Null hypothesis probability =   3.499047e-01

Photon flux (15-150 keV)    in 1 sec: 2.16086 (    ) ph/cm2/s
Energy fluence (15-150 keV)             : 1.74948e-07 ( 0  0 ) ergs/cm2
Single BB
Spectral model blackbody:
------------------------------------------------------------
Parameters  : value    Lower 90%  Upper 90%
kT [keV]    : 17.2894  (-2.91054  3.73273)
R^2/D10^2   : 0.172573  (-0.0852508   0.154093)
(R is the radius in km and D10 is the distance to the source in units of 10 kpc)
------------------------------------------------------------
#Fit statistic : Chi-Squared =          60.94 using 59 PHA bins.
# Reduced chi-squared =          1.069 for     57 degrees of freedom
# Null hypothesis probability =   3.360290e-01

Energy  Fluence     90% Error
[keV]   [erg/cm2]   [erg/cm2]
15- 25  1.046e-08   3.416e-09
25- 50  4.689e-08   1.335e-08
50-150  1.006e-07   3.084e-08
15-150  1.579e-07   3.805e-08
Thermal bremsstrahlung (OTTB)
Spectral model: thermal bremsstrahlung
------------------------------------------------------------
Parameters  : value         Lower 90%    Upper 90%
kT [keV]    : 200.000       (      )
Norm        : 9.35251       (-1.54744     1.54729)
------------------------------------------------------------
#Fit statistic : Chi-Squared =          63.65 using 59 PHA bins.
# Reduced chi-squared =          1.117 for     57 degrees of freedom
# Null hypothesis probability =   2.539098e-01

Energy  Fluence     90% Error
[keV]   [erg/cm2]   [erg/cm2]
15- 25  2.329e-08   1.346e-08
25- 50  4.480e-08   2.536e-08
50-150  9.826e-08   5.600e-08
15-150  1.664e-07   9.450e-08
Double BB
Spectral model: bbodyrad<1> + bbodyrad<2>
------------------------------------------------------------
Parameters  : value         Lower 90%    Upper 90%
kT1 [keV]   : 10.6909        (-9.09455      -10.6891)
R1^2/D10^2  : 0.480328        (-0.240198      103299)
kT2 [keV]   : 27.5713        (-13.7225      -27.568)
R2^2/D10^2  : 2.30004E-02    (-0.0227939   0.170161)
------------------------------------------------------------
#Fit statistic : Chi-Squared =          58.13 using 59 PHA bins.
# Reduced chi-squared =          1.057 for     55 degrees of freedom
# Null hypothesis probability =   3.607530e-01

Energy  Fluence     90% Error
[keV]   [erg/cm2]   [erg/cm2]
15- 25  1.428e-08   8.650e-09
25- 50  4.817e-08   2.885e-08
50-150  1.141e-07   6.075e-08
15-150  1.765e-07   9.340e-08
Pre-slew spectrum (Pre-slew PHA with pre-slew DRM)
Power-law model
Spectral model in power-law:
------------------------------------------------------------
Parameters  : value       lower 90%   higher 90%
Photon index: 1.44926     ( -0.170551   0.171826 )
Norm@50keV  : 4.63401E-03    ( -0.00047377   0.000472473 )
------------------------------------------------------------
#Fit statistic : Chi-Squared =          45.52 using 59 PHA bins.
# Reduced chi-squared =         0.7985 for     57 degrees of freedom
# Null hypothesis probability =   8.630173e-01

Photon flux (15-150 keV)    in 33.17 sec: 0.570974 ( -0.0590903  0.0592032 ) ph/cm2/s
Energy fluence (15-150 keV)             : 1.4711e-06 ( -1.63776e-07  1.65009e-07 ) ergs/cm2
Cutoff power-law model

Spectral model in the cutoff power-law:
------------------------------------------------------------
Parameters  : value       lower 90%   higher 90%
Photon index: 0.728859     ( -0.846621   0.711017 )
Epeak [keV] : 92.1776      ( -25.4556 890.846 )
Norm@50keV  : 1.03869E-02    (     )
------------------------------------------------------------
#Fit statistic : Chi-Squared =          42.54 using 59 PHA bins.
# Reduced chi-squared =         0.7596 for     56 degrees of freedom
# Null hypothesis probability =   9.077192e-01

Photon flux (15-150 keV)    in 33.17 sec: 0.553459 ( -0.062044  0.061738 ) ph/cm2/s
Energy fluence (15-150 keV)             : 1.41236e-06 ( -1.74713e-07  1.76037e-07 ) ergs/cm2
Band function
Spectral model in the Band function:
------------------------------------------------------------
Parameters  : value       lower 90%   higher 90%
alpha       : -0.761186   ( -0.427386   0.685159 )
beta        : -9.36346    ( 9.37131   19.3713 )
Epeak [keV] : 94.7725      ( -23.6032 171.289 )
Norm@50keV   : 9.97521E-03    ( -0.00400847   0.00550117 )
------------------------------------------------------------
#Fit statistic : Chi-Squared =          42.55 using 59 PHA bins.
# Reduced chi-squared =         0.7736 for     55 degrees of freedom
# Null hypothesis probability =   8.899531e-01

Photon flux (15-150 keV)    in 33.17 sec: 0.554438 (    ) ph/cm2/s
Energy fluence (15-150 keV)             : 1.41602e-06 ( 0  0 ) ergs/cm2
S(25-50 keV) vs. S(50-100 keV) plot
S(25-50 keV)  = 3.55e-07
S(50-100 keV) = 5.20e-07
T90 vs. Hardness ratio plot
T90                                   = 26.944000005722 sec.
Hardness ratio (energy fluence ratio) = 1.46479
Color vs. Color plot
Count Ratio  (25-50 keV) / (15-25 keV) = 1.43427
Count Ratio (50-100 keV) / (15-25 keV) = 1.37279
Mask shadow pattern
IMX = 3.275944959142454E-02, IMY = 7.541145878494562E-01
TIME vs. PHA plot around the trigger time
Blue+Cyan dotted lines: Time interval of the scaled map
From 0.000000 to 1.024000
TIME vs. DetID plot around the trigger time

Blue+Cyan dotted lines: Time interval of the scaled map
From 0.000000 to 1.024000
100 us light curve (15-350 keV)
Blue+Cyan dotted lines: Time interval of the scaled map
From 0.000000 to 1.024000
Spacecraft aspect plot
Bright source in the pre-burst/pre-slew/post-slew images
Pre-burst image of 15-350 keV band
Time interval of the image:
-239.776000 -5.408000

# RAcent  DECcent POSerr Theta    Phi  PeakCts   SNR AngSep     Name
#  [deg]    [deg]    ['] [deg]  [deg]                   [']
308.1135  40.9465  836.8  37.8   60.3  -0.0061  -0.0    0.4	Cyg X-3
326.4314  38.3165    3.5  42.2   39.0  -1.2875  -3.3   12.2	Cyg X-2
252.6283  58.6298    2.6  23.8  136.4   0.8552   4.5 ------	UNKNOWN
209.1629  35.6181    2.2  54.2  171.0   3.7781   5.3 ------	UNKNOWN
357.3735  36.5416    2.3  49.0    5.7   1.8066   5.0 ------	UNKNOWN
 58.7320  51.6261    1.9  45.9  -56.9   4.4167   6.2 ------	UNKNOWN
Pre-slew background subtracted image of 15-350 keV band
Time interval of the image:
-5.408000 27.760000

# RAcent  DECcent POSerr Theta    Phi  PeakCts   SNR AngSep     Name
#  [deg]    [deg]    ['] [deg]  [deg]                   [']
308.0292  41.0969    5.0  37.7   60.4  -0.3327  -2.3    9.4	Cyg X-3
326.0992  38.4517   19.3  42.0   39.4   0.0878   0.6    8.5	Cyg X-2
352.5852  34.0305    2.2  50.5   11.5   0.8980   5.3 ------	UNKNOWN
202.7601  36.5299    2.2  54.6  177.5   1.2103   5.3 ------	UNKNOWN
197.4027  48.6080    2.2  44.0 -173.2   0.4956   5.3 ------	UNKNOWN
 93.5056  64.0738    0.8  37.0  -87.5   2.5371  15.1 ------	UNKNOWN
Post-slew image of 15-350 keV band
Time interval of the image:
273.124590 378.724590

# RAcent  DECcent POSerr Theta    Phi  PeakCts   SNR AngSep     Name
#  [deg]    [deg]    ['] [deg]  [deg]                   [']
254.4750  35.2909   13.2  34.0  146.8   0.1522   0.9    3.2	Her X-1
299.5801  35.1972    0.5  26.3   71.0   3.8749  25.2    0.6	Cyg X-1
307.9834  41.1243    0.0  22.5   51.5   0.3022   2.4   11.8	Cyg X-3
326.1859  38.3383   34.1  31.8   27.2  -0.0482  -0.3    1.2	Cyg X-2
225.2344  38.7309    2.3  44.9 -179.8   0.9876   5.0 ------	UNKNOWN
179.1819  61.8717    2.5  46.5 -128.4   2.1469   4.7 ------	UNKNOWN
Plot creation:
Sun May 31 03:35:49 EDT 2015