Special notes of this burst
Image
Pre-slew 15.0-350.0 keV image (Event data)
#   RAcent    DECcent   POSerr    Theta     Phi              Peak Cts       SNR   Name
   70.0935    22.5246   0.0122    35.1938   -22.0675         5.8717864     15.710 TRIG_00357072

Foreground time interval of the image:
-112.896 159.752 (delta_t = 272.648 [sec])
Background time interval of the image:
-567.179 -534.007 (delta_t =  33.172 [sec])
-239.080 -112.896 (delta_t = 126.184 [sec])
Lightcurves
Notes:
- 1) The mask-weighted light curves are using the flight position.
- 2) Multiple plots of different time binning/intervals are shown to cover all scenarios of short/long GRBs, rate/image triggers, and real/false positives.
- 3) For all the mask-weighted lightcurves, the y-axis units are counts/sec/det where a det is 0.4 x 0.4 = 0.16 sq cm.
- 4) The verticle lines correspond to following: green dotted lines are T50 interval, black dotted lines are T90 interval, blue solid line(s) is a spacecraft slew start time, and orange solid line(s) is a spacecraft slew end time.
- 5) Time of each bin is in the middle of the bin.
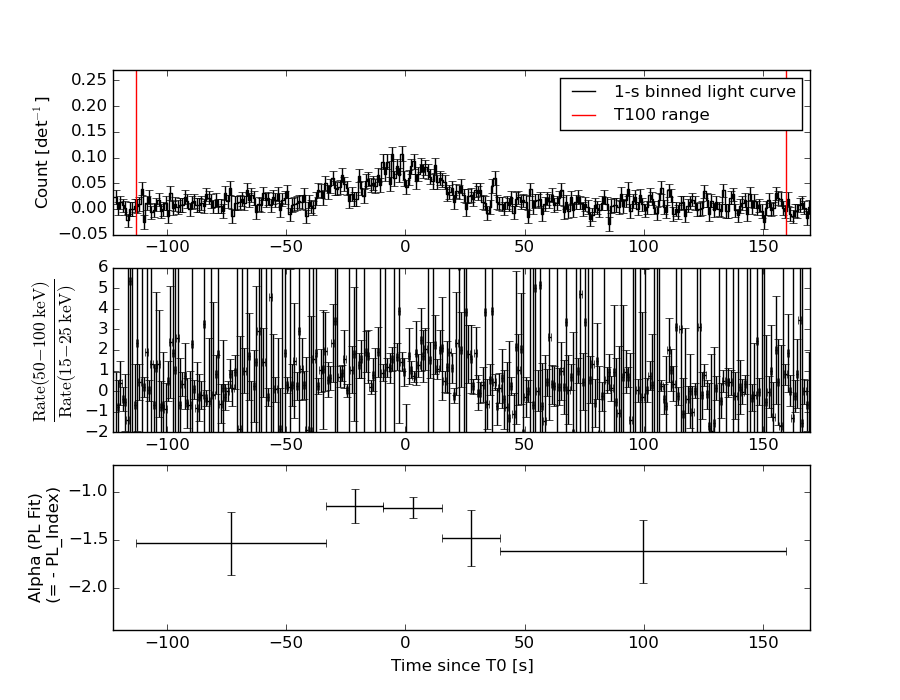
1 s binning
From T0-310 s to T0+310 s
From T100_start - 20 s to T100_end + 30 s
Full time interval
64 ms binning
Full time interval
From T100_start to T100_end
From T0-5 sec to T0+5 sec
16 ms binning
From T100_start-5 s to T100_start+5 s
Blue+Cyan dotted lines: Time interval of the scaled map
From 0.000000 to 4.096000
8 ms binning
From T100_start-3 s to T100_start+3 s
Blue+Cyan dotted lines: Time interval of the scaled map
From 0.000000 to 4.096000
2 ms binning
From T100_start-1 s to T100_start+1 s
Blue+Cyan dotted lines: Time interval of the scaled map
From 0.000000 to 4.096000
SN=5 or 10 sec. binning (whichever binning is satisfied first)
SN=5 or 10 sec. binning (T < 200 sec)
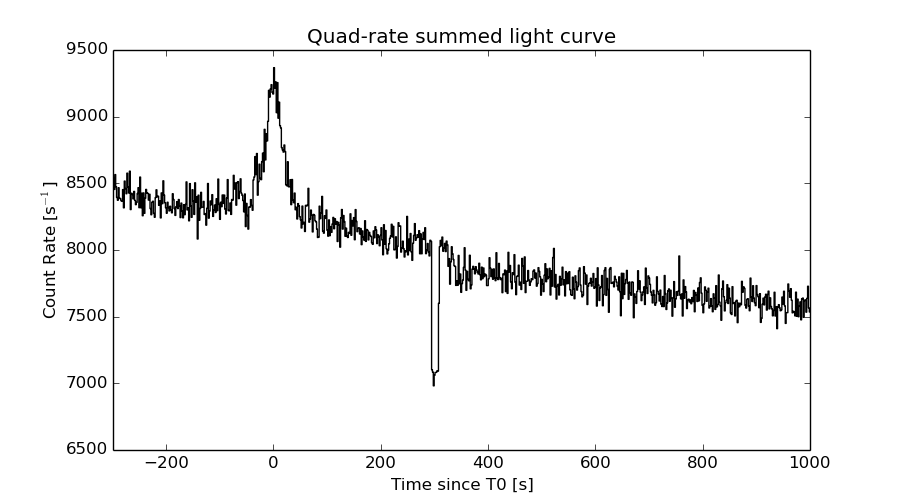
Quad-rate summed light curves (from T0-300s to T0+1000s)
Spectral Evolution
Spectra
Notes:
- 1) The fitting includes the systematic errors.
- 2) When the burst includes telescope slew time periods, the fitting uses an average response file made from multiple 5-s response files through out the slew time plus single time preiod for the non-slew times, and weighted by the total counts in the corresponding time period using addrmf. An average response file is needed becuase a spectral fit using the pre-slew DRM will introduce some errors in both a spectral shape and a normalization if the PHA file contains a lot of the slew/post-slew time interval.
- 3) For fits to more complicated models (e.g. a power-law over a cutoff power-law), the BAT team has decided to require a chi-square improvement of more than 6 for each extra dof.
Time averaged spectrum fit using the average DRM
Power-law model

Time interval is from -112.896 sec. to  159.752 sec.

Spectral model in power-law:
------------------------------------------------------------
Parameters  : value       lower 90%   higher 90%
Photon index: 1.36395     ( -0.112236   0.111897 )
Norm@50keV  : 1.46132E-03    ( -8.96317e-05   8.95111e-05 )
------------------------------------------------------------
#Fit statistic : Chi-Squared =          57.76 using 59 PHA bins.
# Reduced chi-squared =          1.013 for     57 degrees of freedom
# Null hypothesis probability =   4.469763e-01

Photon flux (15-150 keV)    in 272.6 sec: 0.176561 ( -0.0111618  0.0111891 ) ph/cm2/s
Energy fluence (15-150 keV)             : 3.87866e-06 ( -2.644e-07  2.65945e-07 ) ergs/cm2
Cutoff power-law model

Time interval is from -112.896 sec. to  159.752 sec.
Spectral model in the cutoff power-law:
------------------------------------------------------------
Parameters  : value       lower 90%   higher 90%
Photon index: 1.28315     ( -0.420825   0.138367 )
Epeak [keV] : 438.421      ( -465.132 -465.132 )
Norm@50keV  : 1.59783E-03    ( -0.000217475   0.000902157 )
------------------------------------------------------------
#Fit statistic : Chi-Squared =          57.67 using 59 PHA bins.
# Reduced chi-squared =          1.030 for     56 degrees of freedom
# Null hypothesis probability =   4.133674e-01

Photon flux (15-150 keV)    in 272.6 sec: 0.175771 ( -0.011742  0.005887 ) ph/cm2/s
Energy fluence (15-150 keV)             : 3.85721e-06 ( -2.88329e-07  2.81378e-07 ) ergs/cm2
Band function
Time interval is from -112.896 sec. to  159.752 sec.

Spectral model in the Band function:
------------------------------------------------------------
Parameters  : value       lower 90%   higher 90%
alpha       : 4.95092   ( -4.95092   -4.95092 )
beta        : -1.40768    ( -0.123351   0.121027 )
Epeak [keV] : 23.3363      ( -23.3363 3.84613 )
Norm@50keV   : 190.957    ( -11.6179   572725 )
------------------------------------------------------------
#Fit statistic : Chi-Squared =          55.84 using 59 PHA bins.
# Reduced chi-squared =          1.015 for     55 degrees of freedom
# Null hypothesis probability =   4.429389e-01

Photon flux (15-150 keV)    in 272.6 sec: 0.175502 (    ) ph/cm2/s
Energy fluence (15-150 keV)             : 0 ( 0  0 ) ergs/cm2
Single BB
Spectral model blackbody:
------------------------------------------------------------
Parameters  : value    Lower 90%  Upper 90%
kT [keV]    : 17.4849  (  )
R^2/D10^2   : 1.18424E-02  (   )
(R is the radius in km and D10 is the distance to the source in units of 10 kpc)
------------------------------------------------------------
#Fit statistic : Chi-Squared =         123.81 using 59 PHA bins.
# Reduced chi-squared =         2.1720 for     57 degrees of freedom
# Null hypothesis probability =   7.503634e-07

Energy  Fluence     90% Error
[keV]   [erg/cm2]   [erg/cm2]
15- 25  1.994e-07   2.475e-08
25- 50  9.020e-07   8.164e-08
50-150  1.986e-06   2.230e-07
15-150  3.087e-06   2.385e-07
Thermal bremsstrahlung (OTTB)
Spectral model: thermal bremsstrahlung
------------------------------------------------------------
Parameters  : value         Lower 90%    Upper 90%
kT [keV]    : 200.000       (      )
Norm        : 0.730381       (-0.0447801     0.0447753)
------------------------------------------------------------
#Fit statistic : Chi-Squared =          66.69 using 59 PHA bins.
# Reduced chi-squared =          1.170 for     57 degrees of freedom
# Null hypothesis probability =   1.781842e-01

Energy  Fluence     90% Error
[keV]   [erg/cm2]   [erg/cm2]
15- 25  4.959e-07   3.448e-08
25- 50  9.539e-07   7.319e-08
50-150  2.092e-06   4.693e-07
15-150  3.542e-06   5.778e-07
Double BB
Spectral model: bbodyrad<1> + bbodyrad<2>
------------------------------------------------------------
Parameters  : value         Lower 90%    Upper 90%
kT1 [keV]   : 6.44700        (-1.20098      1.44706)
R1^2/D10^2  : 0.228862        (-0.116231      0.267131)
kT2 [keV]   : 27.9598        (-4.26778      6.64229)
R2^2/D10^2  : 2.10909E-03    (-0.00106382   0.00161963)
------------------------------------------------------------
#Fit statistic : Chi-Squared =          55.07 using 59 PHA bins.
# Reduced chi-squared =          1.001 for     55 degrees of freedom
# Null hypothesis probability =   4.718286e-01

Energy  Fluence     90% Error
[keV]   [erg/cm2]   [erg/cm2]
15- 25  4.527e-07   1.186e-07
25- 50  8.796e-07   1.492e-07
50-150  2.537e-06   5.765e-07
15-150  3.869e-06   7.616e-07
Peak spectrum fit
Power-law model
Time interval is from   -6.096 sec. to   -5.096 sec.

Spectral model in power-law:
------------------------------------------------------------
Parameters  : value       lower 90%   higher 90%
Photon index: 1.37027     ( -0.353699   0.352536 )
Norm@50keV  : 7.03806E-03    ( -0.0015292   0.0015211 )
------------------------------------------------------------
#Fit statistic : Chi-Squared =          66.26 using 59 PHA bins.
# Reduced chi-squared =          1.162 for     57 degrees of freedom
# Null hypothesis probability =   1.878863e-01

Photon flux (15-150 keV)    in 1 sec: 0.851501 ( -0.183891  0.184398 ) ph/cm2/s
Energy fluence (15-150 keV)             : 6.84311e-08 ( -1.62604e-08  1.66844e-08 ) ergs/cm2
Cutoff power-law model
Time interval is from   -6.096 sec. to   -5.096 sec.
Spectral model in the cutoff power-law:
------------------------------------------------------------
Parameters  : value       lower 90%   higher 90%
Photon index: 0.124060     ( -2.03342   1.3759 )
Epeak [keV] : 73.1249      ( -21.2141 -73.1251 )
Norm@50keV  : 3.07606E-02    ( -0.0307602   0.281968 )
------------------------------------------------------------
#Fit statistic : Chi-Squared =          64.08 using 59 PHA bins.
# Reduced chi-squared =          1.144 for     56 degrees of freedom
# Null hypothesis probability =   2.142656e-01

Photon flux (15-150 keV)    in 1 sec: 0.810403 ( -0.18871  0.190197 ) ph/cm2/s
Energy fluence (15-150 keV)             : 6.17677e-08 ( -1.69364e-08  1.836e-08 ) ergs/cm2
Band function
Time interval is from   -6.096 sec. to   -5.096 sec.

Spectral model in the Band function:
------------------------------------------------------------
Parameters  : value       lower 90%   higher 90%
alpha       : 4.95098   ( -13.6794   -4.95098 )
beta        : -1.66317    ( -0.702241   0.458249 )
Epeak [keV] : 30.2963      ( -9.69481 10.3756 )
Norm@50keV   : 214.118    ( -44.505   2447.62 )
------------------------------------------------------------
#Fit statistic : Chi-Squared =          63.14 using 59 PHA bins.
# Reduced chi-squared =          1.148 for     55 degrees of freedom
# Null hypothesis probability =   2.108370e-01

Photon flux (15-150 keV)    in 1 sec: 0.843608 ( 6.15639  -0.18737 ) ph/cm2/s
Energy fluence (15-150 keV)             : 0 ( 0  0 ) ergs/cm2
Single BB
Spectral model blackbody:
------------------------------------------------------------
Parameters  : value    Lower 90%  Upper 90%
kT [keV]    : 15.6130  (-3.55214  4.69997)
R^2/D10^2   : 8.88205E-02  (-0.0530556   0.12811)
(R is the radius in km and D10 is the distance to the source in units of 10 kpc)
------------------------------------------------------------
#Fit statistic : Chi-Squared =          65.94 using 59 PHA bins.
# Reduced chi-squared =          1.157 for     57 degrees of freedom
# Null hypothesis probability =   1.952558e-01

Energy  Fluence     90% Error
[keV]   [erg/cm2]   [erg/cm2]
15- 25  4.500e-09   2.045e-09
25- 50  1.854e-08   8.119e-09
50-150  3.128e-08   1.447e-08
15-150  5.432e-08   2.186e-08
Thermal bremsstrahlung (OTTB)
Spectral model: thermal bremsstrahlung
------------------------------------------------------------
Parameters  : value         Lower 90%    Upper 90%
kT [keV]    : 199.363       (-101.983      -199.363)
Norm        : 3.52720       (-0.750392     0.750406)
------------------------------------------------------------
#Fit statistic : Chi-Squared =          65.97 using 59 PHA bins.
# Reduced chi-squared =          1.157 for     57 degrees of freedom
# Null hypothesis probability =   1.946010e-01

Energy  Fluence     90% Error
[keV]   [erg/cm2]   [erg/cm2]
15- 25  8.783e-09   5.260e-09
25- 50  1.690e-08   9.990e-09
50-150  3.706e-08   2.170e-08
15-150  6.273e-08   3.645e-08
Double BB
Spectral model: bbodyrad<1> + bbodyrad<2>
------------------------------------------------------------
Parameters  : value         Lower 90%    Upper 90%
kT1 [keV]   : 7.21485        (-7.20317      -7.20317)
R1^2/D10^2  : 0.586320        (-0.589671      -0.589671)
kT2 [keV]   : 21.6180        (-21.5925      -21.5925)
R2^2/D10^2  : 2.29716E-02    (-0.0230816   0.0936362)
------------------------------------------------------------
#Fit statistic : Chi-Squared =          63.47 using 59 PHA bins.
# Reduced chi-squared =          1.154 for     55 degrees of freedom
# Null hypothesis probability =   2.026915e-01

Energy  Fluence     90% Error
[keV]   [erg/cm2]   [erg/cm2]
15- 25  7.057e-09   4.467e-09
25- 50  1.781e-08   9.880e-09
50-150  3.792e-08   2.234e-08
15-150  6.279e-08   3.184e-08
Pre-slew spectrum (Pre-slew PHA with pre-slew DRM)
Power-law model
Spectral model in power-law:
------------------------------------------------------------
Parameters  : value       lower 90%   higher 90%
Photon index: 1.36395     ( -0.112236   0.111897 )
Norm@50keV  : 1.46132E-03    ( -8.96317e-05   8.95111e-05 )
------------------------------------------------------------
#Fit statistic : Chi-Squared =          57.76 using 59 PHA bins.
# Reduced chi-squared =          1.013 for     57 degrees of freedom
# Null hypothesis probability =   4.469763e-01

Photon flux (15-150 keV)    in 272.6 sec: 0.176561 ( -0.0111618  0.0111891 ) ph/cm2/s
Energy fluence (15-150 keV)             : 3.87866e-06 ( -2.644e-07  2.65945e-07 ) ergs/cm2
Cutoff power-law model
Spectral model in the cutoff power-law:
------------------------------------------------------------
Parameters  : value       lower 90%   higher 90%
Photon index: 1.28315     ( -0.420825   0.138367 )
Epeak [keV] : 438.421      ( -465.132 -465.132 )
Norm@50keV  : 1.59783E-03    ( -0.000217475   0.000902157 )
------------------------------------------------------------
#Fit statistic : Chi-Squared =          57.67 using 59 PHA bins.
# Reduced chi-squared =          1.030 for     56 degrees of freedom
# Null hypothesis probability =   4.133674e-01

Photon flux (15-150 keV)    in 272.6 sec: 0.175771 ( -0.011742  0.005887 ) ph/cm2/s
Energy fluence (15-150 keV)             : 3.85721e-06 ( -2.88329e-07  2.81378e-07 ) ergs/cm2
Band function

Spectral model in the Band function:
------------------------------------------------------------
Parameters  : value       lower 90%   higher 90%
alpha       : 4.95092   ( -4.95092   -4.95092 )
beta        : -1.40768    ( -0.123351   0.121027 )
Epeak [keV] : 23.3363      ( -23.3363 3.84613 )
Norm@50keV   : 190.957    ( -11.6179   572725 )
------------------------------------------------------------
#Fit statistic : Chi-Squared =          55.84 using 59 PHA bins.
# Reduced chi-squared =          1.015 for     55 degrees of freedom
# Null hypothesis probability =   4.429389e-01

Photon flux (15-150 keV)    in 272.6 sec: 0.175502 (    ) ph/cm2/s
Energy fluence (15-150 keV)             : 0 ( 0  0 ) ergs/cm2
S(25-50 keV) vs. S(50-100 keV) plot
S(25-50 keV)  = 8.94e-07
S(50-100 keV) = 1.39e-06
T90 vs. Hardness ratio plot
T90                                   = 202.899999976158 sec.
Hardness ratio (energy fluence ratio) = 1.55481
Color vs. Color plot
Count Ratio  (25-50 keV) / (15-25 keV) = 1.31974
Count Ratio (50-100 keV) / (15-25 keV) = 1.22031
Mask shadow pattern
IMX = 6.535952434727554E-01, IMY = 2.649658515032313E-01
TIME vs. PHA plot around the trigger time
Blue+Cyan dotted lines: Time interval of the scaled map
From 0.000000 to 4.096000
TIME vs. DetID plot around the trigger time
Blue+Cyan dotted lines: Time interval of the scaled map
From 0.000000 to 4.096000
100 us light curve (15-350 keV)
Blue+Cyan dotted lines: Time interval of the scaled map
From 0.000000 to 4.096000
Spacecraft aspect plot
Bright source in the pre-burst/pre-slew/post-slew images
Pre-burst image of 15-350 keV band
Time interval of the image:
-567.179400 -534.007000
-239.080000 -112.896000

# RAcent  DECcent POSerr Theta    Phi  PeakCts   SNR AngSep     Name
#  [deg]    [deg]    ['] [deg]  [deg]                   [']
 83.6398  22.0185    0.5  38.1  -42.6   6.5175  24.4    0.4	Crab
 47.0779  16.2959    2.7  43.2   11.7   1.1242   4.2 ------	UNKNOWN
151.0239  56.2087    2.6  44.0 -140.2   1.4681   4.5 ------	UNKNOWN
 83.4488   5.5931    2.5  54.0  -36.7   3.6626   4.7 ------	UNKNOWN
Pre-slew background subtracted image of 15-350 keV band
Time interval of the image:
-112.896000 159.752000

# RAcent  DECcent POSerr Theta    Phi  PeakCts   SNR AngSep     Name
#  [deg]    [deg]    ['] [deg]  [deg]                   [']
 83.7784  22.0950    5.3  38.0  -42.8  -1.0009  -2.2    9.4	Crab
 35.3829  36.8471    2.5  28.2   42.4   1.7955   4.6 ------	UNKNOWN
 70.0935  22.5246    0.7  35.2  -22.1   5.8720  15.7 ------	UNKNOWN
Post-slew image of 15-350 keV band
Time interval of the image:
401.320630 840.230000
840.920000 962.930000

# RAcent  DECcent POSerr Theta    Phi  PeakCts   SNR AngSep     Name
#  [deg]    [deg]    ['] [deg]  [deg]                   [']
204.4197  16.3666    3.0  39.9  104.0   5.2927   3.8 ------	UNKNOWN
202.3402  27.5570    2.8  32.1   89.9   2.7890   4.0 ------	UNKNOWN
170.4905  -8.5774    2.9  46.3  166.3   3.2588   4.0 ------	UNKNOWN
170.6734  72.4558    3.4  35.0   -4.9   1.3307   3.4 ------	UNKNOWN
164.4187  58.7021    2.8  21.2   -9.5   1.2895   4.2 ------	UNKNOWN
154.3779 -10.4042    2.7  49.2 -172.4   3.0908   4.3 ------	UNKNOWN
152.1693  87.4022    3.4  49.9   -8.2   2.2827   3.4 ------	UNKNOWN
143.5780 -15.4195    3.0  57.0 -161.5   6.2399   3.8 ------	UNKNOWN
100.9812  72.2983    2.1  46.9  -29.5   3.7649   5.6 ------	UNKNOWN
129.7740   1.9756    2.9  48.6 -135.7   5.4427   4.0 ------	UNKNOWN
Plot creation:
Sun May 31 03:33:40 EDT 2015