Special notes of this burst
Image
Pre-slew 15.0-350.0 keV image (Event data)
#   RAcent    DECcent   POSerr    Theta     Phi              Peak Cts       SNR   Name
  152.1152    10.0054   0.0253    47.1921  -145.7587         1.5176116      7.601 TRIG_00357498

Foreground time interval of the image:
-15.064  48.936 (delta_t =  64.000 [sec])
Background time interval of the image:
-239.064 -15.064 (delta_t = 224.000 [sec])
Lightcurves
Notes:
- 1) The mask-weighted light curves are using the flight position.
- 2) Multiple plots of different time binning/intervals are shown to cover all scenarios of short/long GRBs, rate/image triggers, and real/false positives.
- 3) For all the mask-weighted lightcurves, the y-axis units are counts/sec/det where a det is 0.4 x 0.4 = 0.16 sq cm.
- 4) The verticle lines correspond to following: green dotted lines are T50 interval, black dotted lines are T90 interval, blue solid line(s) is a spacecraft slew start time, and orange solid line(s) is a spacecraft slew end time.
- 5) Time of each bin is in the middle of the bin.
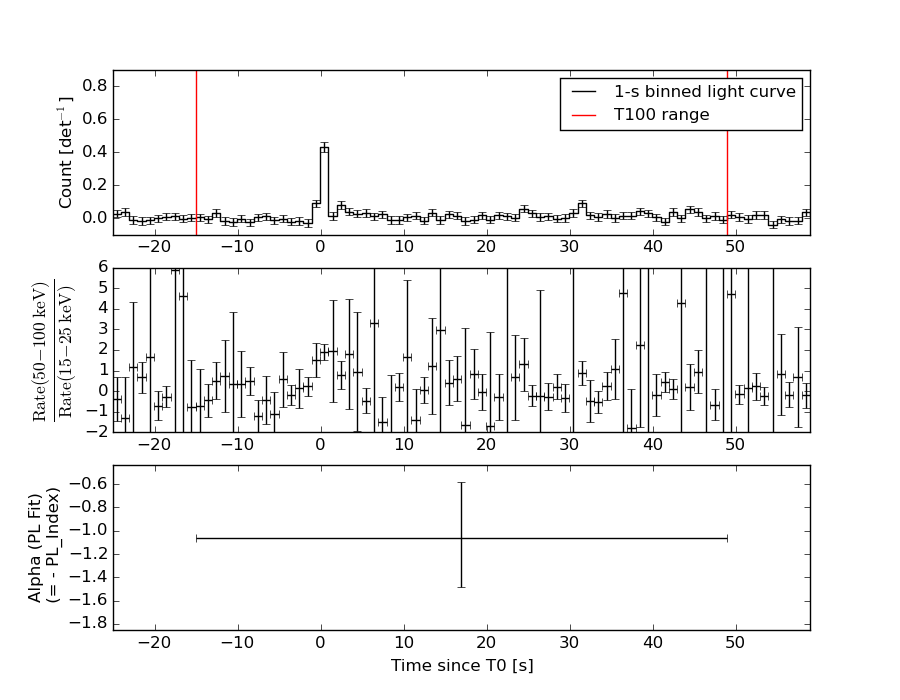
1 s binning
From T0-310 s to T0+310 s
From T100_start - 20 s to T100_end + 30 s
Full time interval
64 ms binning
Full time interval
From T100_start to T100_end
From T0-5 sec to T0+5 sec
16 ms binning
From T100_start-5 s to T100_start+5 s

Blue+Cyan dotted lines: Time interval of the scaled map
From 0.000000 to 0.256000
8 ms binning
From T100_start-3 s to T100_start+3 s

Blue+Cyan dotted lines: Time interval of the scaled map
From 0.000000 to 0.256000
2 ms binning
From T100_start-1 s to T100_start+1 s
Blue+Cyan dotted lines: Time interval of the scaled map
From 0.000000 to 0.256000
SN=5 or 10 sec. binning (whichever binning is satisfied first)
SN=5 or 10 sec. binning (T < 200 sec)
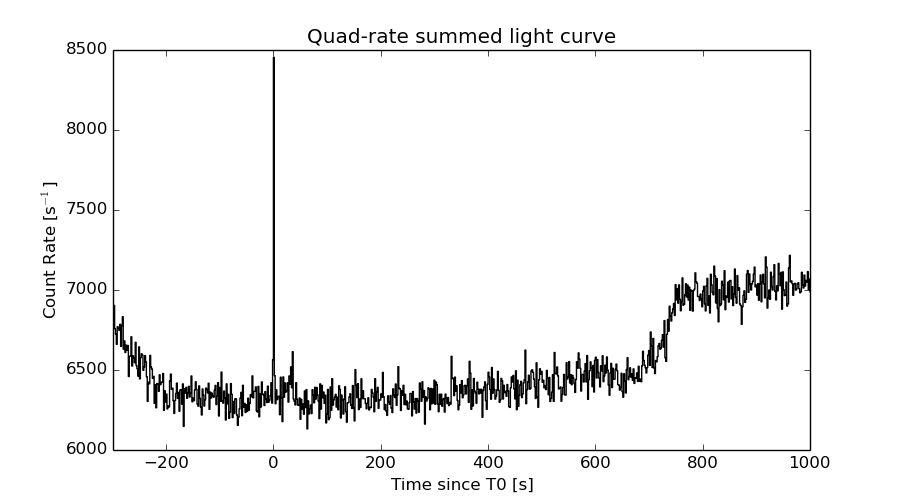
Quad-rate summed light curves (from T0-300s to T0+1000s)
Spectral Evolution
Spectra
Notes:
- 1) The fitting includes the systematic errors.
- 2) When the burst includes telescope slew time periods, the fitting uses an average response file made from multiple 5-s response files through out the slew time plus single time preiod for the non-slew times, and weighted by the total counts in the corresponding time period using addrmf. An average response file is needed becuase a spectral fit using the pre-slew DRM will introduce some errors in both a spectral shape and a normalization if the PHA file contains a lot of the slew/post-slew time interval.
- 3) For fits to more complicated models (e.g. a power-law over a cutoff power-law), the BAT team has decided to require a chi-square improvement of more than 6 for each extra dof.
Time averaged spectrum fit using the average DRM
Power-law model

Time interval is from  -15.064 sec. to   48.936 sec.

Spectral model in power-law:
------------------------------------------------------------
Parameters  : value       lower 90%   higher 90%
Photon index: 1.06084     ( -0.476325   0.420964 )
Norm@50keV  : 1.40789E-03    ( -0.000347816   0.000331335 )
------------------------------------------------------------
#Fit statistic : Chi-Squared =          57.78 using 59 PHA bins.
# Reduced chi-squared =          1.014 for     57 degrees of freedom
# Null hypothesis probability =   4.462443e-01

Photon flux (15-150 keV)    in 64 sec: 0.162740 ( -0.0408615  0.0414608 ) ph/cm2/s
Energy fluence (15-150 keV)             : 9.54214e-07 ( -2.18317e-07  2.18788e-07 ) ergs/cm2
Cutoff power-law model
Time interval is from  -15.064 sec. to   48.936 sec.
Spectral model in the cutoff power-law:
------------------------------------------------------------
Parameters  : value       lower 90%   higher 90%
Photon index: 1.07036     ( -0.688979   0.410269 )
Epeak [keV] : 9999.36      ( -9999.36 -9999.36 )
Norm@50keV  : 1.41982E-03    ( -0.000317316   0.00224127 )
------------------------------------------------------------
#Fit statistic : Chi-Squared =          57.79 using 59 PHA bins.
# Reduced chi-squared =          1.032 for     56 degrees of freedom
# Null hypothesis probability =   4.088032e-01

Photon flux (15-150 keV)    in 64 sec: 0.164100 ( -0.04168  0.039497 ) ph/cm2/s
Energy fluence (15-150 keV)             : 9.54278e-07 ( -1.10106e-07  2.15354e-07 ) ergs/cm2
Band function
Time interval is from  -15.064 sec. to   48.936 sec.

Spectral model in the Band function:
------------------------------------------------------------
Parameters  : value       lower 90%   higher 90%
alpha       : 4.96666   ( -4.96666   -4.96666 )
beta        : -1.13594    ( -0.53816   0.516988 )
Epeak [keV] : 30.0520      ( -30.052 47.2069 )
Norm@50keV   : 32.6334    ( -7.23024   521660 )
------------------------------------------------------------
#Fit statistic : Chi-Squared =          57.61 using 59 PHA bins.
# Reduced chi-squared =          1.047 for     55 degrees of freedom
# Null hypothesis probability =   3.790179e-01

Photon flux (15-150 keV)    in 64 sec:  (    ) ph/cm2/s
Energy fluence (15-150 keV)             : 0 ( 0  0 ) ergs/cm2
Single BB
Spectral model blackbody:
------------------------------------------------------------
Parameters  : value    Lower 90%  Upper 90%
kT [keV]    : 26.7350  (-8.67165  16.9901)
R^2/D10^2   : 2.96109E-03  (-0.002214   0.00736196)
(R is the radius in km and D10 is the distance to the source in units of 10 kpc)
------------------------------------------------------------
#Fit statistic : Chi-Squared =          64.79 using 59 PHA bins.
# Reduced chi-squared =          1.137 for     57 degrees of freedom
# Null hypothesis probability =   2.233316e-01

Energy  Fluence     90% Error
[keV]   [erg/cm2]   [erg/cm2]
15- 25  2.268e-08   1.256e-08
25- 50  1.330e-07   7.785e-08
50-150  6.960e-07   4.084e-07
15-150  8.517e-07   4.940e-07
Thermal bremsstrahlung (OTTB)
Spectral model: thermal bremsstrahlung
------------------------------------------------------------
Parameters  : value         Lower 90%    Upper 90%
kT [keV]    : 200.000       (      )
Norm        : 0.709361       (-0.164643     0.164597)
------------------------------------------------------------
#Fit statistic : Chi-Squared =          62.39 using 59 PHA bins.
# Reduced chi-squared =          1.095 for     57 degrees of freedom
# Null hypothesis probability =   2.906189e-01

Energy  Fluence     90% Error
[keV]   [erg/cm2]   [erg/cm2]
15- 25  1.131e-07   6.752e-08
25- 50  2.177e-07   1.251e-07
50-150  4.774e-07   2.780e-07
15-150  8.081e-07   4.669e-07
Double BB

Spectral model: bbodyrad<1> + bbodyrad<2>
------------------------------------------------------------
Parameters  : value         Lower 90%    Upper 90%
kT1 [keV]   : 8.19556        (-3.35871      5.80394)
R1^2/D10^2  : 0.102831        (-0.0861048      0.617026)
kT2 [keV]   : 57.3896        (-29.0766      -57.376)
R2^2/D10^2  : 3.16820E-04    (-0.00027485   0.00190214)
------------------------------------------------------------
#Fit statistic : Chi-Squared =          56.08 using 59 PHA bins.
# Reduced chi-squared =          1.020 for     55 degrees of freedom
# Null hypothesis probability =   4.340260e-01

Energy  Fluence     90% Error
[keV]   [erg/cm2]   [erg/cm2]
15- 25  8.787e-08   5.206e-08
25- 50  1.970e-07   1.215e-07
50-150  7.155e-07   3.811e-07
15-150  1.000e-06   5.146e-07
Peak spectrum fit
Power-law model
Time interval is from   -7.564 sec. to   -6.564 sec.

Spectral model in power-law:
------------------------------------------------------------
Parameters  : value       lower 90%   higher 90%
Photon index: 0.346917     ( -0.378549   -0.378549 )
Norm@50keV  : 1.65320E-03    ( -0.00166575   0.00236594 )
------------------------------------------------------------
#Fit statistic : Chi-Squared =          59.61 using 59 PHA bins.
# Reduced chi-squared =          1.046 for     57 degrees of freedom
# Null hypothesis probability =   3.807502e-01

Photon flux (15-150 keV)    in 1 sec: 0.202677 ( -0.203742  0.261892 ) ph/cm2/s
Energy fluence (15-150 keV)             : 2.40887e-08 ( -2.41004e-08  2.45879e-08 ) ergs/cm2
Cutoff power-law model
Time interval is from   -7.564 sec. to   -6.564 sec.
Spectral model in the cutoff power-law:
------------------------------------------------------------
Parameters  : value       lower 90%   higher 90%
Photon index: -9.99999     (     )
Epeak [keV] : 79.5068      ( -26.7849 120.085 )
Norm@50keV  : 5.20865    ( -5.08048   359.69 )
------------------------------------------------------------
#Fit statistic : Chi-Squared =          57.72 using 59 PHA bins.
# Reduced chi-squared =          1.031 for     56 degrees of freedom
# Null hypothesis probability =   4.114666e-01

Photon flux (15-150 keV)    in 1 sec: 0.204808 ( -0.204808  0.200506 ) ph/cm2/s
Energy fluence (15-150 keV)             : 2.36214e-08 ( -2.36214e-08  2.20771e-08 ) ergs/cm2
Band function
Time interval is from   -7.564 sec. to   -6.564 sec.

Spectral model in the Band function:
------------------------------------------------------------
Parameters  : value       lower 90%   higher 90%
alpha       : 4.17501   ( -0.650734   -0.650734 )
beta        : -10.00000    ( 10   10 )
Epeak [keV] : 83.9267      ( -35.2984 345.728 )
Norm@50keV   : 0.125058    ( -0.125058   0.272418 )
------------------------------------------------------------
#Fit statistic : Chi-Squared =          58.28 using 59 PHA bins.
# Reduced chi-squared =          1.060 for     55 degrees of freedom
# Null hypothesis probability =   3.555849e-01

Photon flux (15-150 keV)    in 1 sec:  (    ) ph/cm2/s
Energy fluence (15-150 keV)             : 0 ( 0  0 ) ergs/cm2
Single BB
Spectral model blackbody:
------------------------------------------------------------
Parameters  : value    Lower 90%  Upper 90%
kT [keV]    : 27.6835  (  )
R^2/D10^2   : 5.02667E-03  (-0.00523973   0.0587883)
(R is the radius in km and D10 is the distance to the source in units of 10 kpc)
------------------------------------------------------------
#Fit statistic : Chi-Squared =          58.92 using 59 PHA bins.
# Reduced chi-squared =          1.034 for     57 degrees of freedom
# Null hypothesis probability =   4.050108e-01

Energy  Fluence     90% Error
[keV]   [erg/cm2]   [erg/cm2]
15- 25  0.000e+00   0.000e+00
25- 50  0.000e+00   0.000e+00
50-150  0.000e+00   0.000e+00
15-150  0.000e+00   0.000e+00
Thermal bremsstrahlung (OTTB)
Spectral model: thermal bremsstrahlung
------------------------------------------------------------
Parameters  : value         Lower 90%    Upper 90%
kT [keV]    : 7.00000       (-7      -7)
Norm        : 0.0       (0     0)
------------------------------------------------------------
#Fit statistic : Chi-Squared =          62.23 using 59 PHA bins.
# Reduced chi-squared =          1.092 for     57 degrees of freedom
# Null hypothesis probability =   2.954673e-01

Energy  Fluence     90% Error
[keV]   [erg/cm2]   [erg/cm2]
15- 25  0.000e+00   0.000e+00
25- 50  0.000e+00   0.000e+00
50-150  0.000e+00   0.000e+00
15-150  0.000e+00   0.000e+00
Double BB

Spectral model: bbodyrad<1> + bbodyrad<2>
------------------------------------------------------------
Parameters  : value         Lower 90%    Upper 90%
kT1 [keV]   : 4.00000        (-4      -4)
R1^2/D10^2  : 0.0        (0      0)
kT2 [keV]   : 27.5452        (-16.2086      -27.5452)
R2^2/D10^2  : 5.19241E-03    (-0.00518107   0.0588072)
------------------------------------------------------------
#Fit statistic : Chi-Squared =          58.92 using 59 PHA bins.
# Reduced chi-squared =          1.071 for     55 degrees of freedom
# Null hypothesis probability =   3.341002e-01

Energy  Fluence     90% Error
[keV]   [erg/cm2]   [erg/cm2]
15- 25  0.000e+00   0.000e+00
25- 50  0.000e+00   0.000e+00
50-150  0.000e+00   0.000e+00
15-150  0.000e+00   0.000e+00
Pre-slew spectrum (Pre-slew PHA with pre-slew DRM)
Power-law model
Spectral model in power-law:
------------------------------------------------------------
Parameters  : value       lower 90%   higher 90%
Photon index: 1.06084     ( -0.476325   0.420964 )
Norm@50keV  : 1.40789E-03    ( -0.000347816   0.000331335 )
------------------------------------------------------------
#Fit statistic : Chi-Squared =          57.78 using 59 PHA bins.
# Reduced chi-squared =          1.014 for     57 degrees of freedom
# Null hypothesis probability =   4.462443e-01

Photon flux (15-150 keV)    in 64 sec: 0.162740 ( -0.0408615  0.0414608 ) ph/cm2/s
Energy fluence (15-150 keV)             : 9.54214e-07 ( -2.18317e-07  2.18788e-07 ) ergs/cm2
Cutoff power-law model

Spectral model in the cutoff power-law:
------------------------------------------------------------
Parameters  : value       lower 90%   higher 90%
Photon index: 1.07036     ( -0.688979   0.410269 )
Epeak [keV] : 9999.36      ( -9999.36 -9999.36 )
Norm@50keV  : 1.41982E-03    ( -0.000317316   0.00224127 )
------------------------------------------------------------
#Fit statistic : Chi-Squared =          57.79 using 59 PHA bins.
# Reduced chi-squared =          1.032 for     56 degrees of freedom
# Null hypothesis probability =   4.088032e-01

Photon flux (15-150 keV)    in 64 sec: 0.164100 ( -0.04168  0.039497 ) ph/cm2/s
Energy fluence (15-150 keV)             : 9.54278e-07 ( -1.10106e-07  2.15354e-07 ) ergs/cm2
Band function

Spectral model in the Band function:
------------------------------------------------------------
Parameters  : value       lower 90%   higher 90%
alpha       : 4.96666   ( -4.96666   -4.96666 )
beta        : -1.13594    ( -0.53816   0.516988 )
Epeak [keV] : 30.0520      ( -30.052 47.5441 )
Norm@50keV   : 32.6334    ( -7.23024   521660 )
------------------------------------------------------------
#Fit statistic : Chi-Squared =          57.61 using 59 PHA bins.
# Reduced chi-squared =          1.047 for     55 degrees of freedom
# Null hypothesis probability =   3.790179e-01

Photon flux (15-150 keV)    in 64 sec:  (    ) ph/cm2/s
Energy fluence (15-150 keV)             : 0 ( 0  0 ) ergs/cm2
S(25-50 keV) vs. S(50-100 keV) plot
S(25-50 keV)  = 1.84e-07
S(50-100 keV) = 3.52e-07
T90 vs. Hardness ratio plot
T90                                   = 64 sec.
Hardness ratio (energy fluence ratio) = 1.91304
Color vs. Color plot
Count Ratio  (25-50 keV) / (15-25 keV) = 2.10161
Count Ratio (50-100 keV) / (15-25 keV) = 1.88711
Mask shadow pattern
IMX = -8.924821866364759E-01, IMY = 6.074714549047846E-01
TIME vs. PHA plot around the trigger time
Blue+Cyan dotted lines: Time interval of the scaled map
From 0.000000 to 0.256000
TIME vs. DetID plot around the trigger time
Blue+Cyan dotted lines: Time interval of the scaled map
From 0.000000 to 0.256000
100 us light curve (15-350 keV)
Blue+Cyan dotted lines: Time interval of the scaled map
From 0.000000 to 0.256000
Spacecraft aspect plot
Bright source in the pre-burst/pre-slew/post-slew images
Pre-burst image of 15-350 keV band
Time interval of the image:
-239.064000 -15.064000

# RAcent  DECcent POSerr Theta    Phi  PeakCts   SNR AngSep     Name
#  [deg]    [deg]    ['] [deg]  [deg]                   [']
231.6069  79.6115    2.5  33.6    7.6   0.9387   4.7 ------	UNKNOWN
165.9848  12.9071    2.8  39.7 -162.9   0.9645   4.1 ------	UNKNOWN
163.2789  -3.9820    2.3  56.7 -165.0   3.5291   5.1 ------	UNKNOWN
 71.8706  66.8392    2.8  51.2  -35.3   2.4393   4.1 ------	UNKNOWN
144.1703  10.2623    3.8  50.6 -136.4   2.4078   3.0 ------	UNKNOWN
Pre-slew background subtracted image of 15-350 keV band
Time interval of the image:
-15.064000 48.936000

# RAcent  DECcent POSerr Theta    Phi  PeakCts   SNR AngSep     Name
#  [deg]    [deg]    ['] [deg]  [deg]                   [']
152.1151  10.0054    1.5  47.2 -145.8   1.5175   7.6 ------	UNKNOWN
149.1845  10.8201    2.0  47.7 -141.8   1.3409   5.9 ------	UNKNOWN
120.4759  43.3181    1.7  41.1  -82.5   2.3135   6.8 ------	UNKNOWN
Post-slew image of 15-350 keV band
Time interval of the image:
758.136600 962.996000

# RAcent  DECcent POSerr Theta    Phi  PeakCts   SNR AngSep     Name
#  [deg]    [deg]    ['] [deg]  [deg]                   [']
254.4723  35.3137    5.4   4.5  119.6   0.3988   2.2    1.9	Her X-1
299.5933  35.2016    0.4  36.5   32.4   8.0639  27.0    0.1	Cyg X-1
308.0981  40.9447    2.5  41.0   20.2   1.4787   4.6    0.7	Cyg X-3
326.1739  38.3991    5.5  54.8   16.5   2.2558   2.1    4.6	Cyg X-2
200.4556  11.3634    2.3  54.6 -155.9   3.2613   5.1 ------	UNKNOWN
Plot creation:
Sun May 31 03:31:20 EDT 2015