Click here for the BAT GCN circular template
Image
Pre-slew 15.0-350.0 keV image (Event data)
#   RAcent    DECcent   POSerr    Theta     Phi              Peak Cts       SNR   Name
  251.3375    44.8384   0.0030     5.3043   -66.3588         4.3165268     64.356 TRIG_00357512

Foreground time interval of the image:
-11.648  11.349 (delta_t =  22.997 [sec])
Background time interval of the image:
-239.552 -11.648 (delta_t = 227.904 [sec])
Lightcurves
Notes:
- 1) The mask-weighted light curves are using the flight position.
- 2) Multiple plots of different time binning/intervals are shown to cover all scenarios of short/long GRBs, rate/image triggers, and real/false positives.
- 3) For all the mask-weighted lightcurves, the y-axis units are counts/sec/det where a det is 0.4 x 0.4 = 0.16 sq cm.
- 4) The verticle lines correspond to following: green dotted lines are T50 interval, black dotted lines are T90 interval, blue solid line(s) is a spacecraft slew start time, and orange solid line(s) is a spacecraft slew end time.
- 5) Time of each bin is in the middle of the bin.
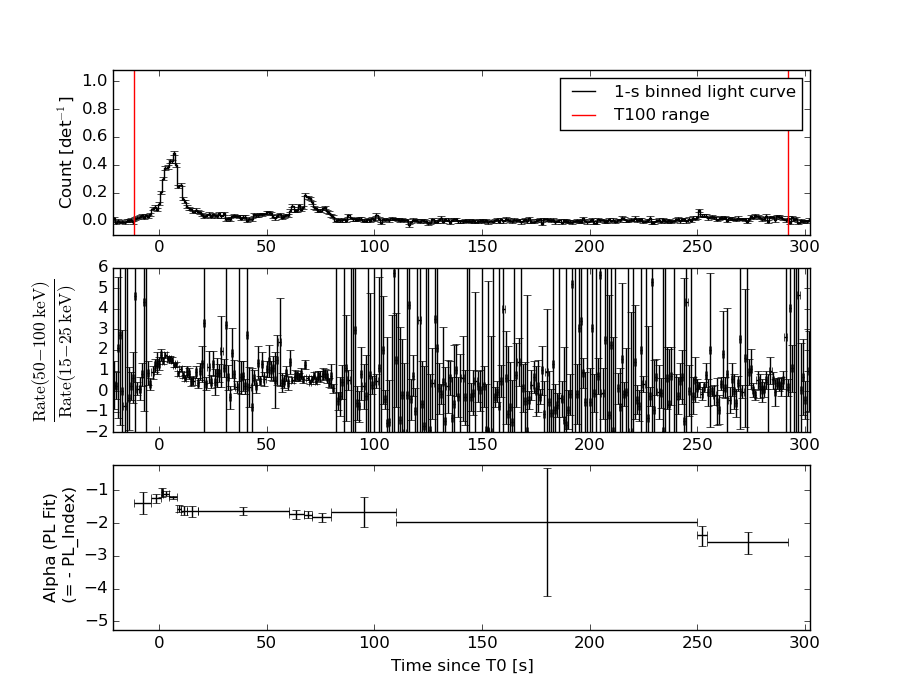
1 s binning
From T0-310 s to T0+310 s

From T100_start - 20 s to T100_end + 30 s
Full time interval

64 ms binning
Full time interval
From T100_start to T100_end
From T0-5 sec to T0+5 sec

16 ms binning
From T100_start-5 s to T100_start+5 s

Blue+Cyan dotted lines: Time interval of the scaled map
From 0.000000 to 1.024000
8 ms binning
From T100_start-3 s to T100_start+3 s
Blue+Cyan dotted lines: Time interval of the scaled map
From 0.000000 to 1.024000
2 ms binning
From T100_start-1 s to T100_start+1 s
Blue+Cyan dotted lines: Time interval of the scaled map
From 0.000000 to 1.024000
SN=5 or 10 sec. binning (whichever binning is satisfied first)
SN=5 or 10 sec. binning (T < 200 sec)
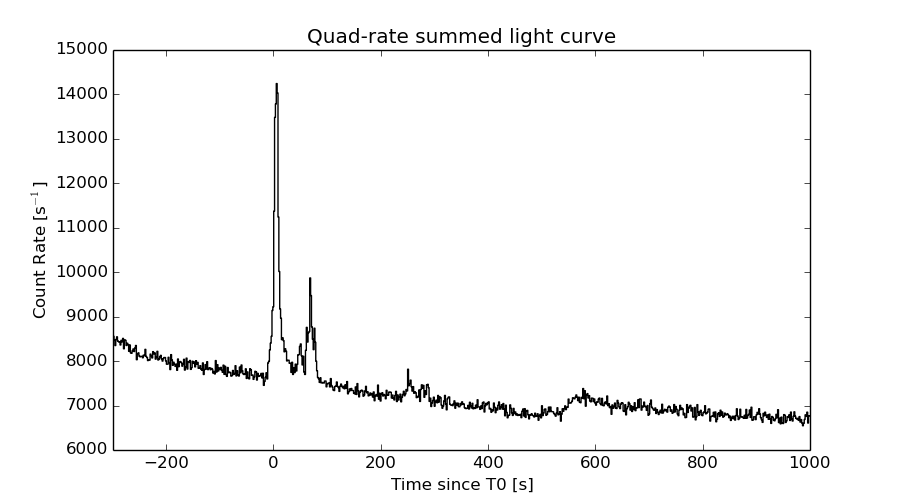
Quad-rate summed light curves (from T0-300s to T0+1000s)
Spectral Evolution
Spectra
Notes:
- 1) The fitting includes the systematic errors.
- 2) When the burst includes telescope slew time periods, the fitting uses an average response file made from multiple 5-s response files through out the slew time plus single time preiod for the non-slew times, and weighted by the total counts in the corresponding time period using addrmf. An average response file is needed becuase a spectral fit using the pre-slew DRM will introduce some errors in both a spectral shape and a normalization if the PHA file contains a lot of the slew/post-slew time interval.
- 3) For fits to more complicated models (e.g. a power-law over a cutoff power-law), the BAT team has decided to require a chi-square improvement of more than 6 for each extra dof.
Time averaged spectrum fit using the average DRM
Power-law model

Time interval is from  -11.648 sec. to  292.312 sec.

Spectral model in power-law:
------------------------------------------------------------
Parameters  : value       lower 90%   higher 90%
Photon index: 1.58334     ( -0.0653594   0.0656361 )
Norm@50keV  : 1.98167E-03    ( -6.63333e-05   6.61417e-05 )
------------------------------------------------------------
#Fit statistic : Chi-Squared =          55.91 using 59 PHA bins.
# Reduced chi-squared =         0.9809 for     57 degrees of freedom
# Null hypothesis probability =   5.160123e-01

Photon flux (15-150 keV)    in 304 sec: 0.253358 ( -0.00880401  0.00883842 ) ph/cm2/s
Energy fluence (15-150 keV)             : 5.64574e-06 ( -2.04179e-07  2.05056e-07 ) ergs/cm2
Cutoff power-law model

Time interval is from  -11.648 sec. to  292.312 sec.
Spectral model in the cutoff power-law:
------------------------------------------------------------
Parameters  : value       lower 90%   higher 90%
Photon index: 1.58391     ( -0.201044   0.0644453 )
Epeak [keV] : 9999.36      ( -9999.36 -9999.36 )
Norm@50keV  : 1.98392E-03    ( -6.43752e-05   0.000480303 )
------------------------------------------------------------
#Fit statistic : Chi-Squared =          55.93 using 59 PHA bins.
# Reduced chi-squared =         0.9987 for     56 degrees of freedom
# Null hypothesis probability =   4.775560e-01

Photon flux (15-150 keV)    in 304 sec: 0.253384 ( -0.008969  0.008676 ) ph/cm2/s
Energy fluence (15-150 keV)             : 5.62017e-06 ( -2.07146e-07  2.40038e-07 ) ergs/cm2
Band function
Time interval is from  -11.648 sec. to  292.312 sec.

Spectral model in the Band function:
------------------------------------------------------------
Parameters  : value       lower 90%   higher 90%
alpha       : 4.99675   ( -4.99675   -4.99675 )
beta        : -1.59480    ( -0.0696411   0.0670648 )
Epeak [keV] : 19.9816      ( -19.9816 3.58345 )
Norm@50keV   : 905.288    ( -29.4593   843928 )
------------------------------------------------------------
#Fit statistic : Chi-Squared =          55.21 using 59 PHA bins.
# Reduced chi-squared =          1.004 for     55 degrees of freedom
# Null hypothesis probability =   4.668544e-01

Photon flux (15-150 keV)    in 304 sec:  (    ) ph/cm2/s
Energy fluence (15-150 keV)             : 0 ( 0  0 ) ergs/cm2
Single BB

Spectral model blackbody:
------------------------------------------------------------
Parameters  : value    Lower 90%  Upper 90%
kT [keV]    : 14.6527  (  )
R^2/D10^2   : 2.88590E-02  (   )
(R is the radius in km and D10 is the distance to the source in units of 10 kpc)
------------------------------------------------------------
#Fit statistic : Chi-Squared =         282.35 using 59 PHA bins.
# Reduced chi-squared =         4.9535 for     57 degrees of freedom
# Null hypothesis probability =   1.385507e-31

Energy  Fluence     90% Error
[keV]   [erg/cm2]   [erg/cm2]
15- 25  3.958e-07   2.538e-08
25- 50  1.538e-06   6.019e-08
50-150  2.224e-06   1.517e-07
15-150  4.158e-06   1.672e-07
Thermal bremsstrahlung (OTTB)

Spectral model: thermal bremsstrahlung
------------------------------------------------------------
Parameters  : value         Lower 90%    Upper 90%
kT [keV]    : 200.000       (      )
Norm        : 1.01433       (-0.0330978     0.0330979)
------------------------------------------------------------
#Fit statistic : Chi-Squared =          61.78 using 59 PHA bins.
# Reduced chi-squared =          1.084 for     57 degrees of freedom
# Null hypothesis probability =   3.094389e-01

Energy  Fluence     90% Error
[keV]   [erg/cm2]   [erg/cm2]
15- 25  7.691e-07   3.040e-08
25- 50  1.479e-06   6.110e-08
50-150  3.239e-06   5.819e-07
15-150  5.487e-06   5.943e-07
Double BB
Spectral model: bbodyrad<1> + bbodyrad<2>
------------------------------------------------------------
Parameters  : value         Lower 90%    Upper 90%
kT1 [keV]   : 7.19553        (-0.819806      0.873029)
R1^2/D10^2  : 0.255697        (-0.0825012      0.137758)
kT2 [keV]   : 29.2370        (-3.91816      5.69256)
R2^2/D10^2  : 2.08924E-03    (-0.000926941   0.00136539)
------------------------------------------------------------
#Fit statistic : Chi-Squared =          63.32 using 59 PHA bins.
# Reduced chi-squared =          1.151 for     55 degrees of freedom
# Null hypothesis probability =   2.061904e-01

Energy  Fluence     90% Error
[keV]   [erg/cm2]   [erg/cm2]
15- 25  7.510e-07   8.056e-08
25- 50  1.486e-06   1.015e-07
50-150  3.386e-06   4.262e-07
15-150  5.623e-06   5.943e-07
Peak spectrum fit
Power-law model

Time interval is from    6.456 sec. to    7.456 sec.

Spectral model in power-law:
------------------------------------------------------------
Parameters  : value       lower 90%   higher 90%
Photon index: 1.30238     ( -0.0865943   0.0867113 )
Norm@50keV  : 3.14592E-02    ( -0.00152852   0.00152595 )
------------------------------------------------------------
#Fit statistic : Chi-Squared =          34.02 using 59 PHA bins.
# Reduced chi-squared =         0.5968 for     57 degrees of freedom
# Null hypothesis probability =   9.932992e-01

Photon flux (15-150 keV)    in 1 sec: 3.75481 ( -0.183655  0.18377 ) ph/cm2/s
Energy fluence (15-150 keV)             : 3.10695e-07 ( -1.72055e-08  1.72961e-08 ) ergs/cm2
Cutoff power-law model
Time interval is from    6.456 sec. to    7.456 sec.
Spectral model in the cutoff power-law:
------------------------------------------------------------
Parameters  : value       lower 90%   higher 90%
Photon index: 1.18235     ( -0.337398   0.164532 )
Epeak [keV] : 355.380      ( -355.426 -355.426 )
Norm@50keV  : 3.60124E-02    ( -0.0058292   0.0160748 )
------------------------------------------------------------
#Fit statistic : Chi-Squared =          33.60 using 59 PHA bins.
# Reduced chi-squared =         0.6001 for     56 degrees of freedom
# Null hypothesis probability =   9.923493e-01

Photon flux (15-150 keV)    in 1 sec: 3.73323 ( -0.19186  0.18983 ) ph/cm2/s
Energy fluence (15-150 keV)             : 3.08017e-07 ( -1.8916e-08  1.8778e-08 ) ergs/cm2
Band function

Time interval is from    6.456 sec. to    7.456 sec.

Spectral model in the Band function:
------------------------------------------------------------
Parameters  : value       lower 90%   higher 90%
alpha       : 1.86468   ( -3.96167   -3.96167 )
beta        : -1.36637    ( -0.107752   0.110012 )
Epeak [keV] : 31.0974      ( -27.2006 176.262 )
Norm@50keV   : 6.69471    ( -6.65386   826.296 )
------------------------------------------------------------
#Fit statistic : Chi-Squared =          31.24 using 59 PHA bins.
# Reduced chi-squared =         0.5680 for     55 degrees of freedom
# Null hypothesis probability =   9.959117e-01

Photon flux (15-150 keV)    in 1 sec:  (    ) ph/cm2/s
Energy fluence (15-150 keV)             : 0 ( 0  0 ) ergs/cm2
Single BB
Spectral model blackbody:
------------------------------------------------------------
Parameters  : value    Lower 90%  Upper 90%
kT [keV]    : 17.0808  (  )
R^2/D10^2   : 0.280378  (   )
(R is the radius in km and D10 is the distance to the source in units of 10 kpc)
------------------------------------------------------------
#Fit statistic : Chi-Squared =         129.81 using 59 PHA bins.
# Reduced chi-squared =         2.2773 for     57 degrees of freedom
# Null hypothesis probability =   1.328215e-07

Energy  Fluence     90% Error
[keV]   [erg/cm2]   [erg/cm2]
15- 25  1.664e-08   1.555e-09
25- 50  7.390e-08   5.040e-09
50-150  1.542e-07   1.360e-08
15-150  2.447e-07   1.580e-08
Thermal bremsstrahlung (OTTB)
Spectral model: thermal bremsstrahlung
------------------------------------------------------------
Parameters  : value         Lower 90%    Upper 90%
kT [keV]    : 200.000       (      )
Norm        : 15.2970       (-0.757555     0.757583)
------------------------------------------------------------
#Fit statistic : Chi-Squared =          56.36 using 59 PHA bins.
# Reduced chi-squared =         0.9888 for     57 degrees of freedom
# Null hypothesis probability =   4.989878e-01

Energy  Fluence     90% Error
[keV]   [erg/cm2]   [erg/cm2]
15- 25  3.839e-08   2.110e-09
25- 50  7.385e-08   4.090e-09
50-150  1.620e-07   1.135e-08
15-150  2.742e-07   2.100e-08
Double BB
Spectral model: bbodyrad<1> + bbodyrad<2>
------------------------------------------------------------
Parameters  : value         Lower 90%    Upper 90%
kT1 [keV]   : 7.42382        (-1.21161      1.43904)
R1^2/D10^2  : 2.86276        (-1.20984      2.32051)
kT2 [keV]   : 30.5440        (-4.89309      8.48388)
R2^2/D10^2  : 3.36188E-02    (-0.0182652   0.0274006)
------------------------------------------------------------
#Fit statistic : Chi-Squared =          33.42 using 59 PHA bins.
# Reduced chi-squared =         0.6076 for     55 degrees of freedom
# Null hypothesis probability =   9.905238e-01

Energy  Fluence     90% Error
[keV]   [erg/cm2]   [erg/cm2]
15- 25  3.169e-08   4.600e-09
25- 50  7.123e-08   1.015e-08
50-150  2.057e-07   4.530e-08
15-150  3.086e-07   5.095e-08
Pre-slew spectrum (Pre-slew PHA with pre-slew DRM)
Power-law model

Spectral model in power-law:
------------------------------------------------------------
Parameters  : value       lower 90%   higher 90%
Photon index: 1.26161     ( -0.0469182   0.046822 )
Norm@50keV  : 1.22159E-02    ( -0.000294531   0.000294429 )
------------------------------------------------------------
#Fit statistic : Chi-Squared =          40.21 using 59 PHA bins.
# Reduced chi-squared =         0.7054 for     57 degrees of freedom
# Null hypothesis probability =   9.551242e-01

Photon flux (15-150 keV)    in 23 sec: 1.44759 ( -0.0376208  0.0377427 ) ph/cm2/s
Energy fluence (15-150 keV)             : 2.8034e-06 ( -7.27794e-08  7.29705e-08 ) ergs/cm2
Cutoff power-law model
Spectral model in the cutoff power-law:
------------------------------------------------------------
Parameters  : value       lower 90%   higher 90%
Photon index: 1.18766     ( -0.189527   0.0642863 )
Epeak [keV] : 584.946      ( -982.977 -982.977 )
Norm@50keV  : 1.31672E-02    ( -0.000782417   0.00244977 )
------------------------------------------------------------
#Fit statistic : Chi-Squared =          40.34 using 59 PHA bins.
# Reduced chi-squared =         0.7203 for     56 degrees of freedom
# Null hypothesis probability =   9.430976e-01

Photon flux (15-150 keV)    in 23 sec: 1.44668 ( -0.04801  0.03935 ) ph/cm2/s
Energy fluence (15-150 keV)             : 2.79457e-06 ( -7.7418e-08  8.0385e-08 ) ergs/cm2
Band function
Spectral model in the Band function:
------------------------------------------------------------
Parameters  : value       lower 90%   higher 90%
alpha       : 0.150972   ( -1.17186   -1.17186 )
beta        : -1.28549    ( -0.0647367   0.0548783 )
Epeak [keV] : 42.1035      ( -32.7992 128.249 )
Norm@50keV   : 0.118367    ( -0.118214   477.993 )
------------------------------------------------------------
#Fit statistic : Chi-Squared =          38.29 using 59 PHA bins.
# Reduced chi-squared =         0.6961 for     55 degrees of freedom
# Null hypothesis probability =   9.578184e-01

Photon flux (15-150 keV)    in 23 sec:  (    ) ph/cm2/s
Energy fluence (15-150 keV)             : 0 ( 0  0 ) ergs/cm2
S(25-50 keV) vs. S(50-100 keV) plot
S(25-50 keV)  = 1.45e-06
S(50-100 keV) = 1.94e-06
T90 vs. Hardness ratio plot

T90                                   = 266.399999916553 sec.
Hardness ratio (energy fluence ratio) = 1.33793
Color vs. Color plot
Count Ratio  (25-50 keV) / (15-25 keV) = 1.21798
Count Ratio (50-100 keV) / (15-25 keV) = 0.858074
Mask shadow pattern

IMX = 3.723090554828558E-02, IMY = 8.505123562137634E-02
TIME vs. PHA plot around the trigger time

Blue+Cyan dotted lines: Time interval of the scaled map
From 0.000000 to 1.024000
TIME vs. DetID plot around the trigger time
Blue+Cyan dotted lines: Time interval of the scaled map
From 0.000000 to 1.024000
100 us light curve (15-350 keV)

Blue+Cyan dotted lines: Time interval of the scaled map
From 0.000000 to 1.024000
Spacecraft aspect plot
Bright source in the pre-burst/pre-slew/post-slew images
Pre-burst image of 15-350 keV band
Time interval of the image:
-239.552000 -11.648000

# RAcent  DECcent POSerr Theta    Phi  PeakCts   SNR AngSep     Name
#  [deg]    [deg]    ['] [deg]  [deg]                   [']
254.4236  35.5138    8.3   4.3  119.7   0.2851   1.4   10.4	Her X-1
299.5914  35.2086    0.5  36.5   32.3   7.6563  24.9    0.4	Cyg X-1
308.0852  40.9844    2.5  40.9   20.1   1.6297   4.7    2.2	Cyg X-3
326.1619  38.4147    2.7  54.8   16.5   4.6408   4.2    5.6	Cyg X-2
245.7439  -2.1866    3.6  42.6  141.6   1.8225   3.2 ------	UNKNOWN
194.1889  26.0966    4.6  50.6 -136.5   2.9885   2.5 ------	UNKNOWN
Pre-slew background subtracted image of 15-350 keV band
Time interval of the image:
-11.648000 11.348600

# RAcent  DECcent POSerr Theta    Phi  PeakCts   SNR AngSep     Name
#  [deg]    [deg]    ['] [deg]  [deg]                   [']
254.3117  35.2517    4.6   4.6  121.4   0.1664   2.5    9.0	Her X-1
299.7599  35.2461   20.3  36.6   32.2   0.0673   0.6    8.7	Cyg X-1
308.0752  41.0681    4.6  40.9   20.0  -0.3081  -2.5    7.1	Cyg X-3
326.3923  38.4176   13.2  55.0   16.4   0.3831   0.9   11.9	Cyg X-2
245.4130  -4.8718    2.3  45.3  141.5   1.1906   4.9 ------	UNKNOWN
232.6680  -7.7150    2.4  51.2  157.0   1.4431   4.8 ------	UNKNOWN
251.3375  44.8384    0.2   5.3  -66.4   4.3166  64.4 ------	UNKNOWN
339.8019  62.0467    2.2  54.0  -14.5   1.0474   5.2 ------	UNKNOWN
209.6817  35.0303    2.5  34.8 -133.5   0.4551   4.5 ------	UNKNOWN
Post-slew image of 15-350 keV band
Time interval of the image:
32.948600 489.348620

# RAcent  DECcent POSerr Theta    Phi  PeakCts   SNR AngSep     Name
#  [deg]    [deg]    ['] [deg]  [deg]                   [']
254.6063  35.4285    3.7   9.7  115.8   1.0915   3.1    8.9	Her X-1
299.5940  35.1905    0.4  37.6   39.3  16.8283  27.4    0.7	Cyg X-1
308.1345  40.9833    4.4  40.9   26.3   1.6363   2.6    2.1	Cyg X-3
251.3364  44.8292    0.9   0.0 -126.3   4.1303  12.7 ------	UNKNOWN
246.0242  46.1086    2.9   4.0 -117.5   1.3407   3.9 ------	UNKNOWN
226.0398  47.2807    2.5  17.7 -121.3   1.5712   4.6 ------	UNKNOWN
192.2835  19.0447    4.3  54.9 -146.1   8.0657   2.7 ------	UNKNOWN
Plot creation:
Sun May 31 03:29:24 EDT 2015