Special notes of this burst
Image
Pre-slew 15.0-350.0 keV image (Event data)
# RAcent DECcent POSerr Theta Phi Peak Cts SNR Name
248.6681 72.8655 0.0124 28.5121 -171.9119 1.7255312 15.475 TRIG_00358422
Foreground time interval of the image:
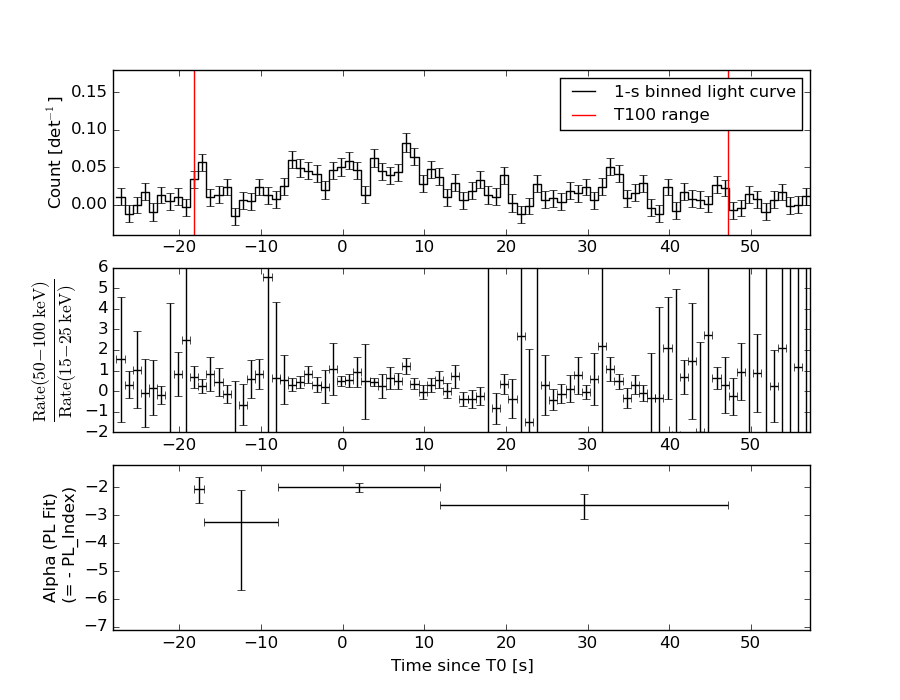
-18.192 47.244 (delta_t = 65.436 [sec])
Background time interval of the image:
-239.704 -18.192 (delta_t = 221.512 [sec])
Lightcurves
Notes:
- 1) The mask-weighted light curves are using the flight position.
- 2) Multiple plots of different time binning/intervals are shown to cover all scenarios of short/long GRBs, rate/image triggers, and real/false positives.
- 3) For all the mask-weighted lightcurves, the y-axis units are counts/sec/det where a det is 0.4 x 0.4 = 0.16 sq cm.
- 4) The verticle lines correspond to following: green dotted lines are T50 interval, black dotted lines are T90 interval, blue solid line(s) is a spacecraft slew start time, and orange solid line(s) is a spacecraft slew end time.
- 5) Time of each bin is in the middle of the bin.
1 s binning
From T0-310 s to T0+310 s
From T100_start - 20 s to T100_end + 30 s
Full time interval
64 ms binning
Full time interval
From T100_start to T100_end
From T0-5 sec to T0+5 sec
16 ms binning
From T100_start-5 s to T100_start+5 s
Blue+Cyan dotted lines: Time interval of the scaled map
From 0.000000 to 12.160000
8 ms binning
From T100_start-3 s to T100_start+3 s
Blue+Cyan dotted lines: Time interval of the scaled map
From 0.000000 to 12.160000
2 ms binning
From T100_start-1 s to T100_start+1 s
Blue+Cyan dotted lines: Time interval of the scaled map
From 0.000000 to 12.160000
SN=5 or 10 sec. binning (whichever binning is satisfied first)
SN=5 or 10 sec. binning (T < 200 sec)
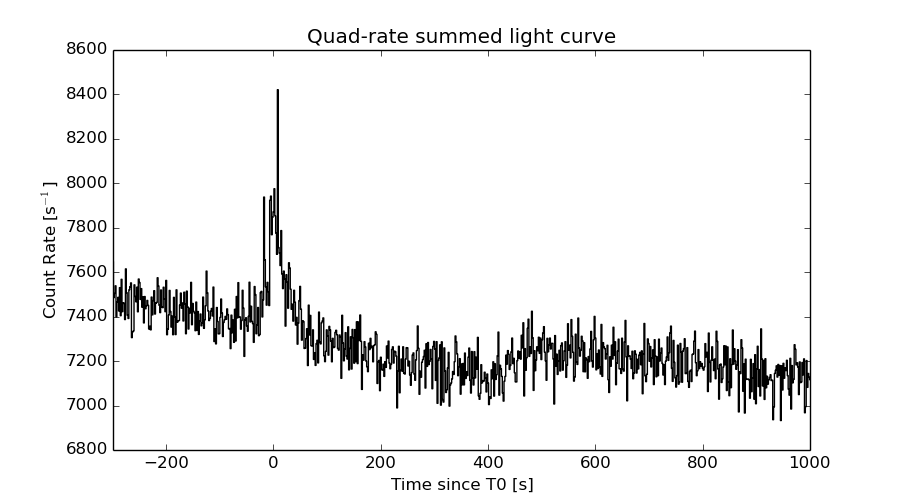
Quad-rate summed light curves (from T0-300s to T0+1000s)
Spectral Evolution
Spectra
Notes:
- 1) The fitting includes the systematic errors.
- 2) When the burst includes telescope slew time periods, the fitting uses an average response file made from multiple 5-s response files through out the slew time plus single time preiod for the non-slew times, and weighted by the total counts in the corresponding time period using addrmf. An average response file is needed becuase a spectral fit using the pre-slew DRM will introduce some errors in both a spectral shape and a normalization if the PHA file contains a lot of the slew/post-slew time interval.
- 3) For fits to more complicated models (e.g. a power-law over a cutoff power-law), the BAT team has decided to require a chi-square improvement of more than 6 for each extra dof.
Time averaged spectrum fit using the average DRM
Power-law model

Time interval is from  -18.192 sec. to   47.244 sec.

Spectral model in power-law:
------------------------------------------------------------
Parameters  : value       lower 90%   higher 90%
Photon index: 2.28768     ( -0.18418   0.196456 )
Norm@50keV  : 1.26004E-03    ( -0.000172481   0.000170153 )
------------------------------------------------------------
#Fit statistic : Chi-Squared =          56.88 using 59 PHA bins.
# Reduced chi-squared =         0.9979 for     57 degrees of freedom
# Null hypothesis probability =   4.794585e-01

Photon flux (15-150 keV)    in 65.44 sec: 0.218705 ( -0.0196662  0.019667 ) ph/cm2/s
Energy fluence (15-150 keV)             : 7.86209e-07 ( -8.73918e-08  8.99506e-08 ) ergs/cm2
Cutoff power-law model

Time interval is from  -18.192 sec. to   47.244 sec.
Spectral model in the cutoff power-law:
------------------------------------------------------------
Parameters  : value       lower 90%   higher 90%
Photon index: 1.30247     ( -1.00145   0.816589 )
Epeak [keV] : 26.8835      (   )
Norm@50keV  : 5.00502E-03    (     )
------------------------------------------------------------
#Fit statistic : Chi-Squared =          52.39 using 59 PHA bins.
# Reduced chi-squared =         0.9355 for     56 degrees of freedom
# Null hypothesis probability =   6.123665e-01

Photon flux (15-150 keV)    in 65.44 sec: 0.210714 ( -0.020422  0.020515 ) ph/cm2/s
Energy fluence (15-150 keV)             : 7.13931e-07 ( -9.09564e-08  1.01681e-07 ) ergs/cm2
Band function

Time interval is from  -18.192 sec. to   47.244 sec.

Spectral model in the Band function:
------------------------------------------------------------
Parameters  : value       lower 90%   higher 90%
alpha       : -1.28289   ( 1.98706   1.98706 )
beta        : -9.37167    ( 9.37159   19.3716 )
Epeak [keV] : 27.6943      ( -17.8669 9.59 )
Norm@50keV   : 5.04944E-03    ( -0.00157792   0.0157339 )
------------------------------------------------------------
#Fit statistic : Chi-Squared =          52.41 using 59 PHA bins.
# Reduced chi-squared =         0.9530 for     55 degrees of freedom
# Null hypothesis probability =   5.740906e-01

Photon flux (15-150 keV)    in 65.44 sec: 0.211908 (    ) ph/cm2/s
Energy fluence (15-150 keV)             : 0 ( 0  0 ) ergs/cm2
Single BB
Spectral model blackbody:
------------------------------------------------------------
Parameters  : value    Lower 90%  Upper 90%
kT [keV]    : 8.54806  (-0.84765  0.931646)
R^2/D10^2   : 0.181450  (-0.0614414   0.0944608)
(R is the radius in km and D10 is the distance to the source in units of 10 kpc)
------------------------------------------------------------
#Fit statistic : Chi-Squared =          68.23 using 59 PHA bins.
# Reduced chi-squared =          1.197 for     57 degrees of freedom
# Null hypothesis probability =   1.466644e-01

Energy  Fluence     90% Error
[keV]   [erg/cm2]   [erg/cm2]
15- 25  1.641e-07   2.470e-08
25- 50  3.212e-07   3.733e-08
50-150  1.044e-07   2.932e-08
15-150  5.896e-07   7.061e-08
Thermal bremsstrahlung (OTTB)
Spectral model: thermal bremsstrahlung
------------------------------------------------------------
Parameters  : value         Lower 90%    Upper 90%
kT [keV]    : 41.8848       (-8.87729      12.6605)
Norm        : 1.36738       (-0.223744     0.279537)
------------------------------------------------------------
#Fit statistic : Chi-Squared =          52.44 using 59 PHA bins.
# Reduced chi-squared =         0.9199 for     57 degrees of freedom
# Null hypothesis probability =   6.467304e-01

Energy  Fluence     90% Error
[keV]   [erg/cm2]   [erg/cm2]
15- 25  2.086e-07   2.346e-08
25- 50  2.798e-07   3.216e-08
50-150  2.275e-07   7.038e-08
15-150  7.158e-07   8.913e-08
Double BB
Spectral model: bbodyrad<1> + bbodyrad<2>
------------------------------------------------------------
Parameters  : value         Lower 90%    Upper 90%
kT1 [keV]   : 3.35008        (-1.0696      1.5053)
R1^2/D10^2  : 5.23505        (-4.21048      41.4017)
kT2 [keV]   : 11.2105        (-1.74129      2.82073)
R2^2/D10^2  : 5.11361E-02    (-0.0330683   0.0565831)
------------------------------------------------------------
#Fit statistic : Chi-Squared =          50.60 using 59 PHA bins.
# Reduced chi-squared =         0.9199 for     55 degrees of freedom
# Null hypothesis probability =   6.434315e-01

Energy  Fluence     90% Error
[keV]   [erg/cm2]   [erg/cm2]
15- 25  2.113e-07   9.908e-08
25- 50  2.814e-07   9.237e-08
50-150  1.841e-07   7.884e-08
15-150  6.768e-07   3.137e-07
Peak spectrum fit
Power-law model

Time interval is from    7.660 sec. to    8.660 sec.

Spectral model in power-law:
------------------------------------------------------------
Parameters  : value       lower 90%   higher 90%
Photon index: 1.79112     ( -0.313207   0.333885 )
Norm@50keV  : 5.76548E-03    ( -0.00134129   0.00131337 )
------------------------------------------------------------
#Fit statistic : Chi-Squared =          69.94 using 59 PHA bins.
# Reduced chi-squared =          1.227 for     57 degrees of freedom
# Null hypothesis probability =   1.165512e-01

Photon flux (15-150 keV)    in 1 sec: 0.791754 ( -0.154858  0.154858 ) ph/cm2/s
Energy fluence (15-150 keV)             : 5.30893e-08 ( -1.22949e-08  1.27962e-08 ) ergs/cm2
Cutoff power-law model
Time interval is from    7.660 sec. to    8.660 sec.
Spectral model in the cutoff power-law:
------------------------------------------------------------
Parameters  : value       lower 90%   higher 90%
Photon index: -1.61943     ( -4.1396   2.18689 )
Epeak [keV] : 40.3176      ( -6.42231 10.97 )
Norm@50keV  : 0.670035    ( -0.7589   259.789 )
------------------------------------------------------------
#Fit statistic : Chi-Squared =          61.81 using 59 PHA bins.
# Reduced chi-squared =          1.104 for     56 degrees of freedom
# Null hypothesis probability =   2.765004e-01

Photon flux (15-150 keV)    in 1 sec: 0.731170 ( -0.150206  0.15291 ) ph/cm2/s
Energy fluence (15-150 keV)             : 4.04929e-08 ( -9.2399e-09  1.15877e-08 ) ergs/cm2
Band function
Time interval is from    7.660 sec. to    8.660 sec.

Spectral model in the Band function:
------------------------------------------------------------
Parameters  : value       lower 90%   higher 90%
alpha       : 4.42278   ( -4.63493   -4.42278 )
beta        : -3.03890    ( -2.72138   0.850461 )
Epeak [keV] : 34.7302      ( -6.88567 5.57711 )
Norm@50keV   : 55.0301    ( -55.0301   420.474 )
------------------------------------------------------------
#Fit statistic : Chi-Squared =          61.01 using 59 PHA bins.
# Reduced chi-squared =          1.109 for     55 degrees of freedom
# Null hypothesis probability =   2.687771e-01

Photon flux (15-150 keV)    in 1 sec:  (    ) ph/cm2/s
Energy fluence (15-150 keV)             : 4.55582e-08 ( -4.55512e-08  -1.29389e-08 ) ergs/cm2
Single BB
Spectral model blackbody:
------------------------------------------------------------
Parameters  : value    Lower 90%  Upper 90%
kT [keV]    : 10.3544  (-1.64539  2.02564)
R^2/D10^2   : 0.362860  (-0.180407   0.332343)
(R is the radius in km and D10 is the distance to the source in units of 10 kpc)
------------------------------------------------------------
#Fit statistic : Chi-Squared =          61.89 using 59 PHA bins.
# Reduced chi-squared =          1.086 for     57 degrees of freedom
# Null hypothesis probability =   3.059921e-01

Energy  Fluence     90% Error
[keV]   [erg/cm2]   [erg/cm2]
15- 25  8.010e-09   2.922e-09
25- 50  2.090e-08   5.745e-09
50-150  1.206e-08   5.310e-09
15-150  4.097e-08   1.162e-08
Thermal bremsstrahlung (OTTB)
Spectral model: thermal bremsstrahlung
------------------------------------------------------------
Parameters  : value         Lower 90%    Upper 90%
kT [keV]    : 80.5120       (-34.7279      103.812)
Norm        : 3.79931       (-0.923327     1.19999)
------------------------------------------------------------
#Fit statistic : Chi-Squared =          67.12 using 59 PHA bins.
# Reduced chi-squared =          1.178 for     57 degrees of freedom
# Null hypothesis probability =   1.688955e-01

Energy  Fluence     90% Error
[keV]   [erg/cm2]   [erg/cm2]
15- 25  9.863e-09   2.937e-09
25- 50  1.626e-08   5.431e-09
50-150  2.305e-08   1.761e-08
15-150  4.918e-08   2.144e-08
Double BB
------------------------------------------------------------
Parameters  : value         Lower 90%    Upper 90%
kT1 [keV]   : 199.351        (      )
R1^2/D10^2  : 2.65841E-05        (-2.65841e-05      0.653336)
kT2 [keV]   : 9.97311        (-1.71512      2.17593)
R2^2/D10^2  : 0.405056    (-0.183903   5.82588)
------------------------------------------------------------
#Fit statistic : Chi-Squared =          61.87 using 59 PHA bins.
#Fit statistic : Chi-Squared =          61.39 using 59 PHA bins.
# Reduced chi-squared =          1.125 for     55 degrees of freedom
# Reduced chi-squared =          1.116 for     55 degrees of freedom
# Null hypothesis probability =   2.443388e-01
# Null hypothesis probability =   2.577895e-01

Energy  Fluence     90% Error
[keV]   [erg/cm2]   [erg/cm2]
15- 25  8.107e-09   1.211e-06
25- 50  2.071e-08   6.930e-06
50-150  1.274e-08   1.113e-04
15-150  4.155e-08   1.054e-04
Pre-slew spectrum (Pre-slew PHA with pre-slew DRM)
Power-law model
Spectral model in power-law:
------------------------------------------------------------
Parameters  : value       lower 90%   higher 90%
Photon index: 2.28768     ( -0.18418   0.196456 )
Norm@50keV  : 1.26004E-03    ( -0.000172481   0.000170153 )
------------------------------------------------------------
#Fit statistic : Chi-Squared =          56.88 using 59 PHA bins.
# Reduced chi-squared =         0.9979 for     57 degrees of freedom
# Null hypothesis probability =   4.794585e-01

Photon flux (15-150 keV)    in 65.44 sec: 0.218705 ( -0.0196662  0.019667 ) ph/cm2/s
Energy fluence (15-150 keV)             : 7.86209e-07 ( -8.73918e-08  8.99506e-08 ) ergs/cm2
Cutoff power-law model

Spectral model in the cutoff power-law:
------------------------------------------------------------
Parameters  : value       lower 90%   higher 90%
Photon index: 1.30247     ( -1.00145   0.816589 )
Epeak [keV] : 26.8835      (   )
Norm@50keV  : 5.00502E-03    (     )
------------------------------------------------------------
#Fit statistic : Chi-Squared =          52.39 using 59 PHA bins.
# Reduced chi-squared =         0.9355 for     56 degrees of freedom
# Null hypothesis probability =   6.123665e-01

Photon flux (15-150 keV)    in 65.44 sec: 0.210714 ( -0.020422  0.020515 ) ph/cm2/s
Energy fluence (15-150 keV)             : 7.13931e-07 ( -9.09564e-08  1.01681e-07 ) ergs/cm2
Band function
Spectral model in the Band function:
------------------------------------------------------------
Parameters  : value       lower 90%   higher 90%
alpha       : -1.28289   ( 1.98706   1.98706 )
beta        : -9.37167    ( 9.37159   19.3716 )
Epeak [keV] : 27.6943      ( -17.8669 9.59 )
Norm@50keV   : 5.04944E-03    ( -0.00157792   0.0157339 )
------------------------------------------------------------
#Fit statistic : Chi-Squared =          52.41 using 59 PHA bins.
# Reduced chi-squared =         0.9530 for     55 degrees of freedom
# Null hypothesis probability =   5.740906e-01

Photon flux (15-150 keV)    in 65.44 sec: 0.211908 (    ) ph/cm2/s
Energy fluence (15-150 keV)             : 0 ( 0  0 ) ergs/cm2
S(25-50 keV) vs. S(50-100 keV) plot
S(25-50 keV)  = 2.53e-07
S(50-100 keV) = 2.08e-07
T90 vs. Hardness ratio plot
T90                                   = 56.6759999394417 sec.
Hardness ratio (energy fluence ratio) = 0.822134
Color vs. Color plot
Count Ratio  (25-50 keV) / (15-25 keV) = 0.89632
Count Ratio (50-100 keV) / (15-25 keV) = 0.329066
Mask shadow pattern
IMX = -5.378266925416157E-01, IMY = 7.642997650182753E-02
TIME vs. PHA plot around the trigger time
Blue+Cyan dotted lines: Time interval of the scaled map
From 0.000000 to 12.160000
TIME vs. DetID plot around the trigger time
Blue+Cyan dotted lines: Time interval of the scaled map
From 0.000000 to 12.160000
100 us light curve (15-350 keV)
Blue+Cyan dotted lines: Time interval of the scaled map
From 0.000000 to 12.160000
Spacecraft aspect plot
Bright source in the pre-burst/pre-slew/post-slew images
Pre-burst image of 15-350 keV band
Time interval of the image:
-239.704000 -18.192000

# RAcent  DECcent POSerr Theta    Phi  PeakCts   SNR AngSep     Name
#  [deg]    [deg]    ['] [deg]  [deg]                   [']
325.9915  38.2038    4.0  39.9   92.1  -2.1039  -2.9   11.0	Cyg X-2
169.6959  59.4686    2.8  46.7 -127.7   2.9144   4.1 ------	UNKNOWN
Pre-slew background subtracted image of 15-350 keV band
Time interval of the image:
-18.192000 47.244000

# RAcent  DECcent POSerr Theta    Phi  PeakCts   SNR AngSep     Name
#  [deg]    [deg]    ['] [deg]  [deg]                   [']
325.9943  38.2364    6.5  39.9   92.1   0.7507   1.8    9.8	Cyg X-2
 25.7155  45.0097    2.4  30.0   11.6   0.5565   4.9 ------	UNKNOWN
248.6680  72.8654    0.7  28.5 -171.9   1.7257  15.5 ------	UNKNOWN
 55.0272  31.0986    2.1  49.3  -18.3   1.1346   5.5 ------	UNKNOWN
 54.3301  22.2860    2.4  57.6  -14.6   2.3473   4.9 ------	UNKNOWN
Post-slew image of 15-350 keV band
Time interval of the image:
474.596640 962.317100

# RAcent  DECcent POSerr Theta    Phi  PeakCts   SNR AngSep     Name
#  [deg]    [deg]    ['] [deg]  [deg]                   [']
178.5766  71.4714    3.3  17.9   33.9   1.0979   3.5 ------	UNKNOWN
Plot creation:
Sun May 31 03:27:09 EDT 2015