Special notes of this burst
Image
Pre-slew 15.0-350.0 keV image (Event data)

#   RAcent    DECcent   POSerr    Theta     Phi              Peak Cts       SNR   Name
   29.6413    41.6360   0.0167    46.3187   -15.2023         1.7781422     11.608 TRIG_00358574

Foreground time interval of the image:
-15.912  37.789 (delta_t =  53.701 [sec])
Background time interval of the image:
-239.912 -15.912 (delta_t = 224.000 [sec])
Lightcurves
Notes:
- 1) The mask-weighted light curves are using the flight position.
- 2) Multiple plots of different time binning/intervals are shown to cover all scenarios of short/long GRBs, rate/image triggers, and real/false positives.
- 3) For all the mask-weighted lightcurves, the y-axis units are counts/sec/det where a det is 0.4 x 0.4 = 0.16 sq cm.
- 4) The verticle lines correspond to following: green dotted lines are T50 interval, black dotted lines are T90 interval, blue solid line(s) is a spacecraft slew start time, and orange solid line(s) is a spacecraft slew end time.
- 5) Time of each bin is in the middle of the bin.
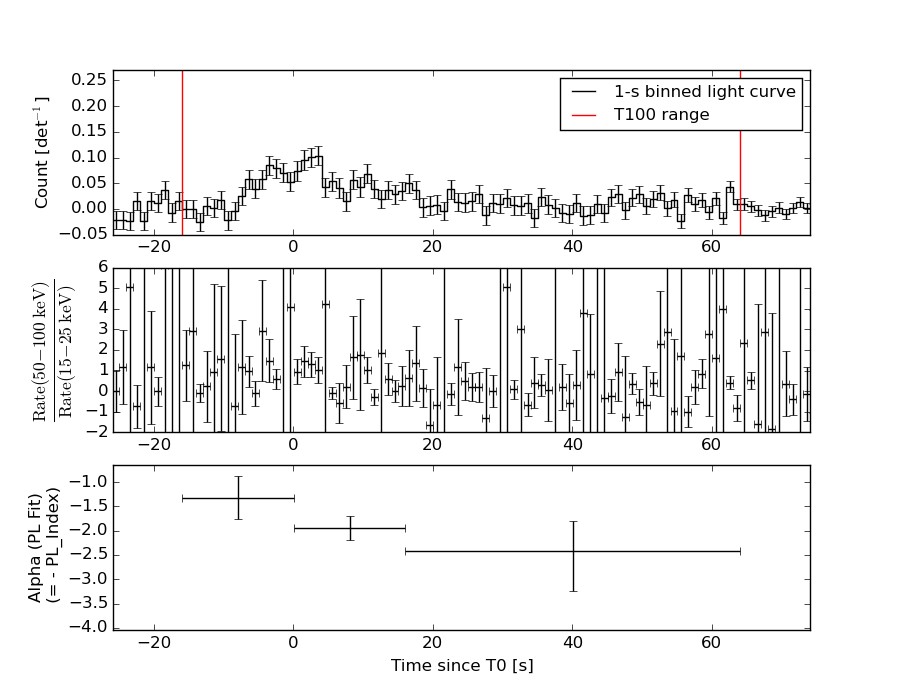
1 s binning
From T0-310 s to T0+310 s

From T100_start - 20 s to T100_end + 30 s

Full time interval
64 ms binning
Full time interval
From T100_start to T100_end

From T0-5 sec to T0+5 sec
16 ms binning
From T100_start-5 s to T100_start+5 s
Blue+Cyan dotted lines: Time interval of the scaled map
From 0.000000 to 4.096000
8 ms binning
From T100_start-3 s to T100_start+3 s

Blue+Cyan dotted lines: Time interval of the scaled map
From 0.000000 to 4.096000
2 ms binning
From T100_start-1 s to T100_start+1 s
Blue+Cyan dotted lines: Time interval of the scaled map
From 0.000000 to 4.096000
SN=5 or 10 sec. binning (whichever binning is satisfied first)
SN=5 or 10 sec. binning (T < 200 sec)

Quad-rate summed light curves (from T0-300s to T0+1000s)

Spectral Evolution
Spectra
Notes:
- 1) The fitting includes the systematic errors.
- 2) When the burst includes telescope slew time periods, the fitting uses an average response file made from multiple 5-s response files through out the slew time plus single time preiod for the non-slew times, and weighted by the total counts in the corresponding time period using addrmf. An average response file is needed becuase a spectral fit using the pre-slew DRM will introduce some errors in both a spectral shape and a normalization if the PHA file contains a lot of the slew/post-slew time interval.
- 3) For fits to more complicated models (e.g. a power-law over a cutoff power-law), the BAT team has decided to require a chi-square improvement of more than 6 for each extra dof.
Time averaged spectrum fit using the average DRM
Power-law model

Time interval is from  -15.912 sec. to   64.088 sec.

Spectral model in power-law:
------------------------------------------------------------
Parameters  : value       lower 90%   higher 90%
Photon index: 1.92237     ( -0.243484   0.259919 )
Norm@50keV  : 1.48135E-03    ( -0.000241629   0.000234608 )
------------------------------------------------------------
#Fit statistic : Chi-Squared =          56.74 using 59 PHA bins.
# Reduced chi-squared =         0.9955 for     57 degrees of freedom
# Null hypothesis probability =   4.847326e-01

Photon flux (15-150 keV)    in 80 sec: 0.214637 ( -0.0295287  0.0295606 ) ph/cm2/s
Energy fluence (15-150 keV)             : 1.08986e-06 ( -1.70589e-07  1.7353e-07 ) ergs/cm2
Cutoff power-law model

Time interval is from  -15.912 sec. to   64.088 sec.
Spectral model in the cutoff power-law:
------------------------------------------------------------
Parameters  : value       lower 90%   higher 90%
Photon index: 1.55581     ( -1.03588   0.636783 )
Epeak [keV] : 55.8001      ( -55.7478 -55.8 )
Norm@50keV  : 2.34152E-03    ( -0.00129842   0.00601809 )
------------------------------------------------------------
#Fit statistic : Chi-Squared =          56.22 using 59 PHA bins.
# Reduced chi-squared =          1.004 for     56 degrees of freedom
# Null hypothesis probability =   4.666552e-01

Photon flux (15-150 keV)    in 80 sec: 0.211642 ( -0.030378  0.030339 ) ph/cm2/s
Energy fluence (15-150 keV)             : 1.0622e-06 ( -1.81928e-07  1.85216e-07 ) ergs/cm2
Band function

Time interval is from  -15.912 sec. to   64.088 sec.

Spectral model in the Band function:
------------------------------------------------------------
Parameters  : value       lower 90%   higher 90%
alpha       : -1.55665   ( 1.70204   1.17462 )
beta        : -10.0000    ( 10   20 )
Epeak [keV] : 55.8178      ( -40.4608 -55.8178 )
Norm@50keV   : 2.33856E-03    ( -0.00106187   0.0060432 )
------------------------------------------------------------
#Fit statistic : Chi-Squared =          56.22 using 59 PHA bins.
# Reduced chi-squared =          1.022 for     55 degrees of freedom
# Null hypothesis probability =   4.290190e-01

Photon flux (15-150 keV)    in 80 sec: 0.210981 ( 6.78902  -0.028726 ) ph/cm2/s
Energy fluence (15-150 keV)             : 1.06226e-06 ( 0  0 ) ergs/cm2
Single BB
Spectral model blackbody:
------------------------------------------------------------
Parameters  : value    Lower 90%  Upper 90%
kT [keV]    : 11.6643  (-1.95521  2.29139)
R^2/D10^2   : 5.55545E-02  (-0.0270012   0.0547143)
(R is the radius in km and D10 is the distance to the source in units of 10 kpc)
------------------------------------------------------------
#Fit statistic : Chi-Squared =          71.02 using 59 PHA bins.
# Reduced chi-squared =          1.246 for     57 degrees of freedom
# Null hypothesis probability =   1.002789e-01

Energy  Fluence     90% Error
[keV]   [erg/cm2]   [erg/cm2]
15- 25  1.275e-07   3.994e-08
25- 50  3.880e-07   7.640e-08
50-150  3.113e-07   1.013e-07
15-150  8.268e-07   1.554e-07
Thermal bremsstrahlung (OTTB)

Spectral model: thermal bremsstrahlung
------------------------------------------------------------
Parameters  : value         Lower 90%    Upper 90%
kT [keV]    : 83.1246       (-29.6992      62.0203)
Norm        : 0.992430       (-0.188609     0.246274)
------------------------------------------------------------
#Fit statistic : Chi-Squared =          56.44 using 59 PHA bins.
# Reduced chi-squared =         0.9902 for     57 degrees of freedom
# Null hypothesis probability =   4.959650e-01

Energy  Fluence     90% Error
[keV]   [erg/cm2]   [erg/cm2]
15- 25  2.065e-07   3.900e-08
25- 50  3.430e-07   5.584e-08
50-150  4.966e-07   2.646e-07
15-150  1.046e-06   3.091e-07
Double BB
Spectral model: bbodyrad<1> + bbodyrad<2>
------------------------------------------------------------
Parameters  : value         Lower 90%    Upper 90%
kT1 [keV]   : 4.42331        (-1.35726      2.07775)
R1^2/D10^2  : 1.56802        (-1.23594      7.43415)
kT2 [keV]   : 17.6519        (-4.06359      7.29248)
R2^2/D10^2  : 9.62908E-03    (-0.0071772   0.0174499)
------------------------------------------------------------
#Fit statistic : Chi-Squared =          54.93 using 59 PHA bins.
# Reduced chi-squared =         0.9987 for     55 degrees of freedom
# Null hypothesis probability =   4.773262e-01

Energy  Fluence     90% Error
[keV]   [erg/cm2]   [erg/cm2]
15- 25  2.303e-07   1.303e-07
25- 50  3.071e-07   1.391e-07
50-150  4.976e-07   2.926e-07
15-150  1.035e-06   4.621e-07
Peak spectrum fit
Power-law model
Time interval is from    7.588 sec. to    8.588 sec.

Spectral model in power-law:
------------------------------------------------------------
Parameters  : value       lower 90%   higher 90%
Photon index: 2.72465     ( -2.72465   -2.72465 )
Norm@50keV  : 1.10113E-03    ( -0.00110113   0.00230534 )
------------------------------------------------------------
#Fit statistic : Chi-Squared =          67.92 using 59 PHA bins.
# Reduced chi-squared =          1.192 for     57 degrees of freedom
# Null hypothesis probability =   1.525725e-01

Photon flux (15-150 keV)    in 1 sec: 0.249818 ( -0.249818  0.273504 ) ph/cm2/s
Energy fluence (15-150 keV)             : 1.18167e-08 ( -1.18167e-08  1.96916e-08 ) ergs/cm2
Cutoff power-law model
Time interval is from    7.588 sec. to    8.588 sec.
Spectral model in the cutoff power-law:
------------------------------------------------------------
Parameters  : value       lower 90%   higher 90%
Photon index: 1.87721     (     )
Epeak [keV] : 4.75197      (   )
Norm@50keV  : 4.02746E-03    (     )
------------------------------------------------------------
#Fit statistic : Chi-Squared =          67.94 using 59 PHA bins.
# Reduced chi-squared =          1.213 for     56 degrees of freedom
# Null hypothesis probability =   1.316334e-01

Photon flux (15-150 keV)    in 1 sec: 0.249167 ( -0.249167  0.273644 ) ph/cm2/s
Energy fluence (15-150 keV)             : 1.16651e-08 ( -1.16651e-08  1.96522e-08 ) ergs/cm2
Band function

Time interval is from    7.588 sec. to    8.588 sec.

Spectral model in the Band function:
------------------------------------------------------------
Parameters  : value       lower 90%   higher 90%
alpha       : -1.91988   (     )
beta        : -9.37166    (     )
Epeak [keV] : 3.74286      (   )
Norm@50keV   : 3.46752E-03    (     )
------------------------------------------------------------
#Fit statistic : Chi-Squared =          67.94 using 59 PHA bins.
# Reduced chi-squared =          1.235 for     55 degrees of freedom
# Null hypothesis probability =   1.129637e-01

Photon flux (15-150 keV)    in 1 sec:  (    ) ph/cm2/s
Energy fluence (15-150 keV)             : 0 ( 0  0 ) ergs/cm2
Single BB
Spectral model blackbody:
------------------------------------------------------------
Parameters  : value    Lower 90%  Upper 90%
kT [keV]    : 3.97162  (-3.97153  -3.97153)
R^2/D10^2   : 6.10031  (-6.10095   -6.10095)
(R is the radius in km and D10 is the distance to the source in units of 10 kpc)
------------------------------------------------------------
#Fit statistic : Chi-Squared =          68.05 using 59 PHA bins.
# Reduced chi-squared =          1.194 for     57 degrees of freedom
# Null hypothesis probability =   1.501197e-01

Energy  Fluence     90% Error
[keV]   [erg/cm2]   [erg/cm2]
15- 25  5.359e-09   3.607e-09
25- 50  1.896e-09   1.661e-09
50-150  2.207e-11   4.295e-11
15-150  7.278e-09   5.145e-09
Thermal bremsstrahlung (OTTB)
Spectral model: thermal bremsstrahlung
------------------------------------------------------------
Parameters  : value         Lower 90%    Upper 90%
kT [keV]    : 22.8080       (-22.9529      -22.9529)
Norm        : 2.57772       (-2.55608     -2.55608)
------------------------------------------------------------
#Fit statistic : Chi-Squared =          67.97 using 59 PHA bins.
# Reduced chi-squared =          1.192 for     57 degrees of freedom
# Null hypothesis probability =   1.516145e-01

Energy  Fluence     90% Error
[keV]   [erg/cm2]   [erg/cm2]
15- 25  4.433e-09   3.209e-09
25- 50  4.273e-09   3.517e-09
50-150  1.582e-09   2.225e-09
15-150  1.029e-08   9.100e-09
Double BB

Spectral model: bbodyrad<1> + bbodyrad<2>
------------------------------------------------------------
Parameters  : value         Lower 90%    Upper 90%
kT1 [keV]   : 3.45767        (-3.39675      -3.39675)
R1^2/D10^2  : 9.89982        (-10.3695      -10.3695)
kT2 [keV]   : 13.6313        (-13.4964      -13.4964)
R2^2/D10^2  : 1.82606E-02    (-0.0188514   -0.0188514)
------------------------------------------------------------
#Fit statistic : Chi-Squared =          67.68 using 59 PHA bins.
# Reduced chi-squared =          1.231 for     55 degrees of freedom
# Null hypothesis probability =   1.170942e-01

Energy  Fluence     90% Error
[keV]   [erg/cm2]   [erg/cm2]
15- 25  4.962e-09   2.607e-09
25- 50  3.591e-09   3.223e-09
50-150  3.142e-09   2.661e-09
15-150  1.169e-08   9.910e-09
Pre-slew spectrum (Pre-slew PHA with pre-slew DRM)
Power-law model
Spectral model in power-law:
------------------------------------------------------------
Parameters  : value       lower 90%   higher 90%
Photon index: 1.85004     ( -0.23398   0.247235 )
Norm@50keV  : 2.00333E-03    ( -0.000304939   0.000297516 )
------------------------------------------------------------
#Fit statistic : Chi-Squared =          59.48 using 59 PHA bins.
# Reduced chi-squared =          1.043 for     57 degrees of freedom
# Null hypothesis probability =   3.854573e-01

Photon flux (15-150 keV)    in 53.7 sec: 0.281593 ( -0.0378859  0.0379423 ) ph/cm2/s
Energy fluence (15-150 keV)             : 9.8917e-07 ( -1.48789e-07  1.50924e-07 ) ergs/cm2
Cutoff power-law model

Spectral model in the cutoff power-law:
------------------------------------------------------------
Parameters  : value       lower 90%   higher 90%
Photon index: 1.46217     ( -1.02261   0.769181 )
Epeak [keV] : 65.7158      ( -65.6482 -65.7158 )
Norm@50keV  : 3.21774E-03    ( -0.00321774   0.00773816 )
------------------------------------------------------------
#Fit statistic : Chi-Squared =          58.89 using 59 PHA bins.
# Reduced chi-squared =          1.052 for     56 degrees of freedom
# Null hypothesis probability =   3.703453e-01

Photon flux (15-150 keV)    in 53.7 sec: 0.277244 ( -0.039156  0.039078 ) ph/cm2/s
Energy fluence (15-150 keV)             : 9.64302e-07 ( -1.58571e-07  1.60654e-07 ) ergs/cm2
Band function
Spectral model in the Band function:
------------------------------------------------------------
Parameters  : value       lower 90%   higher 90%
alpha       : -1.46105   ( -4.44063   1.11534 )
beta        : -10.0000    ( 10   20 )
Epeak [keV] : 65.5962      ( -38.1981 -65.5982 )
Norm@50keV   : 3.22258E-03    ( -0.00140016   0.00773541 )
------------------------------------------------------------
#Fit statistic : Chi-Squared =          58.89 using 59 PHA bins.
# Reduced chi-squared =          1.071 for     55 degrees of freedom
# Null hypothesis probability =   3.352751e-01

Photon flux (15-150 keV)    in 53.7 sec: 0.276159 ( 6.72384  -0.036652 ) ph/cm2/s
Energy fluence (15-150 keV)             : 9.63518e-07 ( 0  0 ) ergs/cm2
S(25-50 keV) vs. S(50-100 keV) plot
S(25-50 keV)  = 3.20e-07
S(50-100 keV) = 3.38e-07
T90 vs. Hardness ratio plot

T90                                   = 64 sec.
Hardness ratio (energy fluence ratio) = 1.05625
Color vs. Color plot
Count Ratio  (25-50 keV) / (15-25 keV) = 1.01233
Count Ratio (50-100 keV) / (15-25 keV) = 0.668562
Mask shadow pattern
IMX = 1.010480728020026E+00, IMY = 2.745854694665011E-01
TIME vs. PHA plot around the trigger time
Blue+Cyan dotted lines: Time interval of the scaled map
From 0.000000 to 4.096000
TIME vs. DetID plot around the trigger time

Blue+Cyan dotted lines: Time interval of the scaled map
From 0.000000 to 4.096000
100 us light curve (15-350 keV)

Blue+Cyan dotted lines: Time interval of the scaled map
From 0.000000 to 4.096000
Spacecraft aspect plot
Bright source in the pre-burst/pre-slew/post-slew images
Pre-burst image of 15-350 keV band
Time interval of the image:
-239.912000 -15.912000

# RAcent  DECcent POSerr Theta    Phi  PeakCts   SNR AngSep     Name
#  [deg]    [deg]    ['] [deg]  [deg]                   [']
254.4666  35.3864    3.2  46.4  163.6   1.8631   3.6    2.7	Her X-1
299.5904  35.1892    0.4  31.3  108.4  11.3838  30.0    0.7	Cyg X-1
308.0421  41.0875    3.1  24.3   96.7   1.0216   3.7    8.7	Cyg X-3
326.2648  38.2769    5.0  27.3   64.2   0.6346   2.3    5.1	Cyg X-2
269.3530  69.9605    2.6  18.1 -151.3   0.8522   4.5 ------	UNKNOWN
 30.1512  62.5480    2.8  31.0  -38.5   1.0133   4.2 ------	UNKNOWN
214.5007  40.0997    3.8  58.7 -159.2   5.6279   3.1 ------	UNKNOWN
Pre-slew background subtracted image of 15-350 keV band
Time interval of the image:
-15.912000 37.788600

# RAcent  DECcent POSerr Theta    Phi  PeakCts   SNR AngSep     Name
#  [deg]    [deg]    ['] [deg]  [deg]                   [']
254.4948  35.3142    4.8  46.5  163.5  -0.4499  -2.4    2.5	Her X-1
299.4941  35.2184    5.9  31.3  108.5  -0.2842  -2.0    4.8	Cyg X-1
307.9268  40.8076    0.0  24.5   96.8   0.1995   1.7   12.0	Cyg X-3
326.1626  38.4747    9.7  27.1   64.3   0.1362   1.2    9.2	Cyg X-2
263.0012  25.8870    2.5  51.3  149.0   1.9504   4.5 ------	UNKNOWN
 29.6413  41.6359    1.0  46.3  -15.2   1.7786  11.6 ------	UNKNOWN
215.5360  45.9595    2.1  53.3 -156.4   1.2711   5.4 ------	UNKNOWN
Post-slew image of 15-350 keV band
Time interval of the image:
99.788600 962.193500

# RAcent  DECcent POSerr Theta    Phi  PeakCts   SNR AngSep     Name
#  [deg]    [deg]    ['] [deg]  [deg]                   [']
323.9581  46.4829    4.1  46.1  139.2   5.1845   2.8 ------	UNKNOWN
248.7138  78.5284    3.2  57.6 -168.8   9.3524   3.7 ------	UNKNOWN
 97.8304  61.3920    4.2  44.2 -120.7   5.8946   2.8 ------	UNKNOWN
Plot creation:
Sun May 31 03:22:56 EDT 2015