Click here for the BAT GCN circular template
Image
Pre-slew 15-350 keV image (Event data; bkg subtracted)

#   RAcent  DECcent POSerr  Theta    Phi     Peak Cts     SNR  Name
  189.6933 -15.3632 0.0349   10.5 -170.9       0.0129     5.5  TRIG_00358760
------------------------------------------

Foreground time interval of the image:
  0.000   0.064 (delta_t =   0.064 [sec])
Background time interval of the image:
-60.804  -3.804 (delta_t =  57.000 [sec])
Lightcurves
Notes:
- 1) All plots contain as much data as has been downloaded to date.
- 2) Multiple plots of different time binning/intervals are shown to cover all scenarios of short/long GRBs, rate/image triggers, and real/false positives.
- 3) For all the mask-weighted lightcurves, the y-axis units are counts/sec/det where a det is 0.4 x 0.4 = 0.16 sq cm.
- 4) The verticle lines correspond to following: green dotted lines are T50 interval, black dotted lines are T90 interval, blue solid line(s) is a spacecraft slew start time, and orange solid line(s) is a spacecraft slew end time.
- 5) Time of each bin is in the middle of the bin.
1 s binning
From T0-310 s to T0+310 s

From T100_start - 20 s to T100_end + 30 s

Full time interval

64 ms binning
Full time interval

From T100_start to T100_end

From T0-5 sec to T0+5 sec

16 ms binning
From T100_start-5 s to T100_start+5 s

Blue+Cyan dotted lines: Time interval of the scaled map
From 0.000000 to 0.064000
8 ms binning
From T100_start-3 s to T100_start+3 s

Blue+Cyan dotted lines: Time interval of the scaled map
From 0.000000 to 0.064000
2 ms binning
From T100_start-1 s to T100_start+1 s

Blue+Cyan dotted lines: Time interval of the scaled map
From 0.000000 to 0.064000
SN=5 or 10 sec. binning (whichever binning is satisfied first)

SN=5 or 10 sec. binning (T < 200 sec)

Flight mask-tagged light curves
Caution: Mask-weight map is always using the same on-axis map


Quad-rate summed light curves (from T0-300 to T0+1000)

Spectra
Notes:
- 1) The fitting includes the systematic errors.
- 2) For long bursts, a spectral fit of the pre-slew DRM will introduce some errors in both a spectral shape and a normalization if the PHA file contains a lot of the slew/post-slew time interval.
- 3) For fits to more complicated models (e.g. a power-law over a cutoff power-law), the BAT team has decided to require a chi-square improvement of more than 6 for each extra dof.
- 4) For short bursts (T90<1sec), the specrtum is also fit with Blackbody, OTTB, and Double Blackbody.
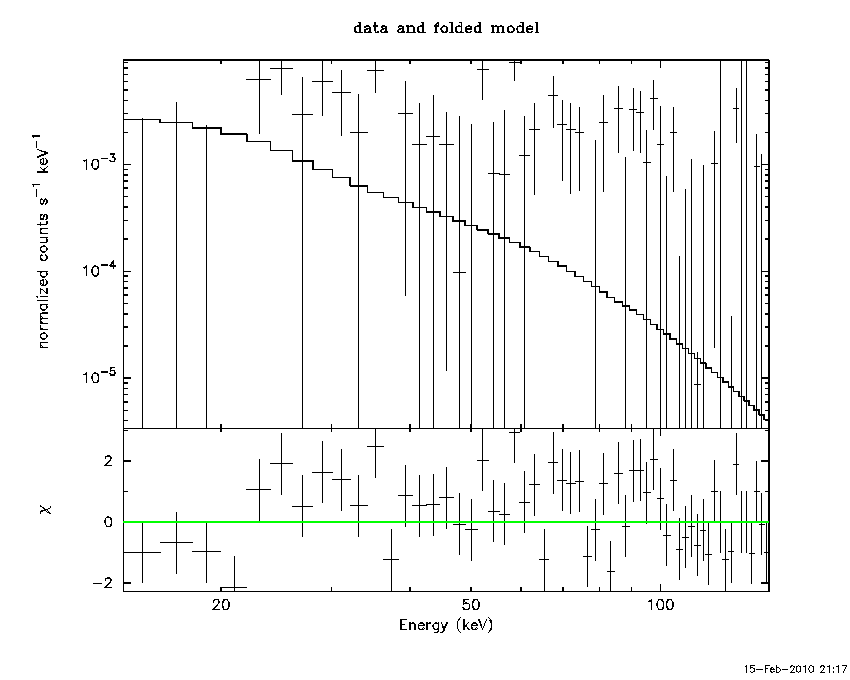
Time averaged spectrum fit using the pre-slew DRM
Power-law model

Time interval is from    0.000 sec. to    0.064 sec.

Spectral model in power-law:
------------------------------------------------------------
Parameters  : value       lower 90%   higher 90%
Photon index: 2.51495     ( -1.13729   0.738109 )
Norm@50keV  : 1.75680E-03    ( -0.00176253   0.00128113 )
------------------------------------------------------------
# Chi-Squared =          86.28 using 59 PHA bins.
# Reduced chi-squared =          1.514 for     57 degrees of freedom
# Null hypothesis probability =   7.396719e-03

Photon flux (15-150 keV)    in 0.064 sec: 0.353825 ( -0.29428  0.317046 ) ph/cm2/s
Energy fluence (15-150 keV)             : 1.141e-09 ( -8.7031e-10  8.88019e-10 ) ergs/cm2
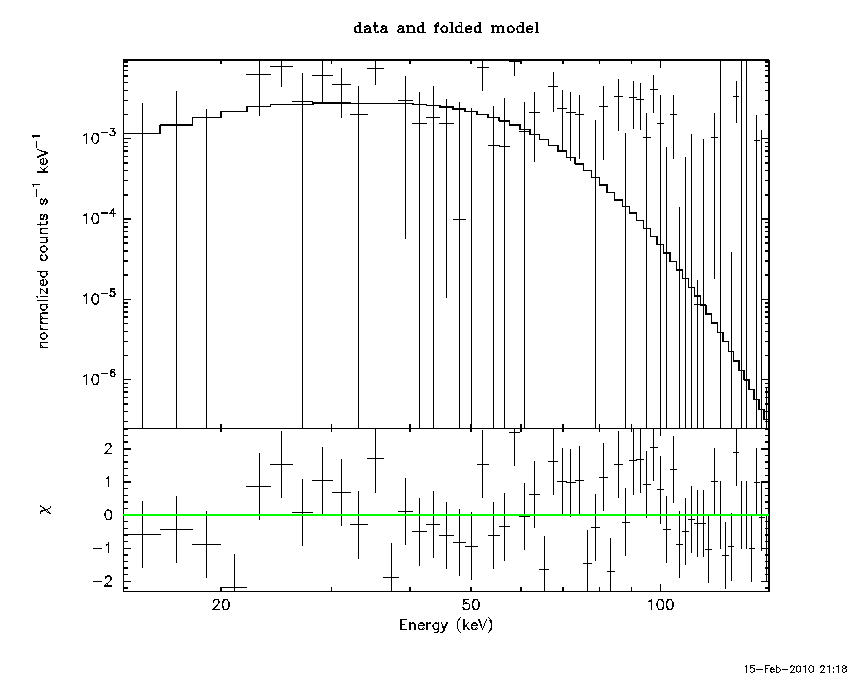
Cutoff power-law model

Time interval is from    0.000 sec. to    0.064 sec.
Spectral model in the cutoff power-law:
------------------------------------------------------------
Parameters  : value       lower 90%   higher 90%
Photon index: -3.89600     ( 3.90364   2.66052 )
Epeak [keV] : 50.8720      ( -9.48428 7.41621 )
Norm@50keV  : 4.82983    ( -4.86376   6.35185 )
------------------------------------------------------------
# Chi-Squared =          71.72 using 59 PHA bins.
# Reduced chi-squared =          1.281 for     56 degrees of freedom
# Null hypothesis probability =   7.681618e-02

Photon flux (15-150 keV)    in 0.064 sec: 0.914070 ( -0.358776  0.35871 ) ph/cm2/s
Energy fluence (15-150 keV)             : 0 ( 0  0 ) ergs/cm2
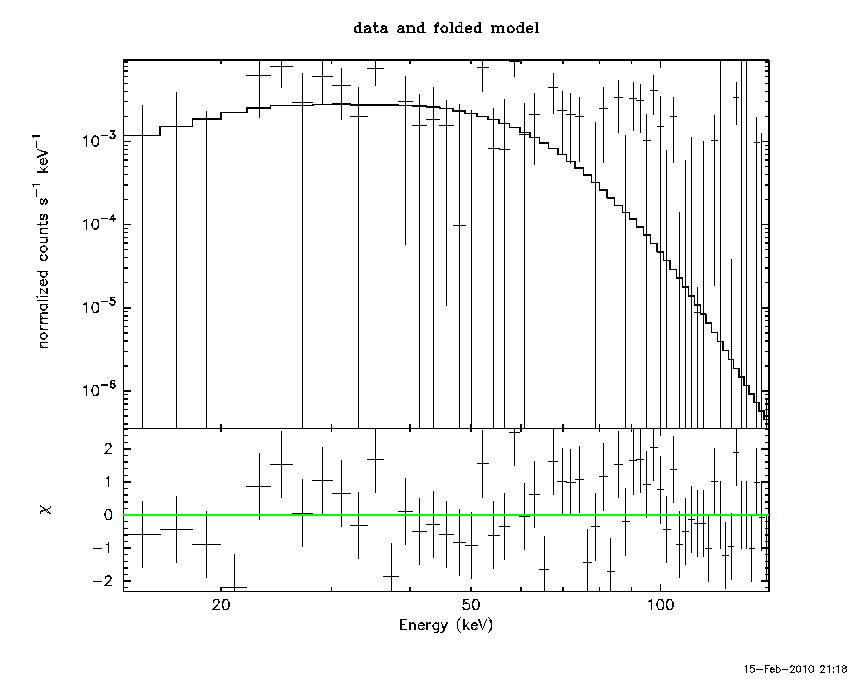
Band function

Time interval is from    0.000 sec. to    0.064 sec.

Spectral model in the Band function:
------------------------------------------------------------
Parameters  : value       lower 90%   higher 90%
alpha       : 3.86610   ( -4.22999   -5.51227 )
beta        : -9.99601    ( 792.088   802.08 )
Epeak [keV] : 50.6238      ( -10.5791 6.76528 )
Norm@50keV   : 4.82872    ( -4.81022   6.44754 )
------------------------------------------------------------
# Chi-Squared =          71.73 using 59 PHA bins.
# Reduced chi-squared =          1.304 for     55 degrees of freedom
# Null hypothesis probability =   6.437978e-02

Photon flux (15-150 keV)    in 0.064 sec:  (    ) ph/cm2/s
Energy fluence (15-150 keV)             : 0 ( 0  0 ) ergs/cm2
Peak spectrum fit
Power-law model
Time interval is from    0.000 sec. to    0.064 sec.

Spectral model in power-law:
------------------------------------------------------------
Parameters  : value       lower 90%   higher 90%
Photon index: 2.51397     ( -1.13118   0.735517 )
Norm@50keV  : 1.75745E-03    ( -0.00176319   0.0012792 )
------------------------------------------------------------
# Chi-Squared =          86.84 using 59 PHA bins.
# Reduced chi-squared =          1.523 for     57 degrees of freedom
# Null hypothesis probability =   6.627810e-03

Photon flux (15-150 keV)    in 0.064 sec: 0.353737 ( -0.293688  0.316402 ) ph/cm2/s
Energy fluence (15-150 keV)             : 1.14109e-09 ( -8.68646e-10  8.86445e-10 ) ergs/cm2
Cutoff power-law model

Time interval is from    0.000 sec. to    0.064 sec.
Spectral model in the cutoff power-law:
------------------------------------------------------------
Parameters  : value       lower 90%   higher 90%
Photon index: -3.91224     ( 3.91948   2.65635 )
Epeak [keV] : 50.9068      ( -9.43566 7.36607 )
Norm@50keV  : 4.90584    ( -4.93845   6.26903 )
------------------------------------------------------------
# Chi-Squared =          72.15 using 59 PHA bins.
# Reduced chi-squared =          1.288 for     56 degrees of freedom
# Null hypothesis probability =   7.197175e-02

Photon flux (15-150 keV)    in 0.064 sec: 0.915417 ( -0.358063  0.357763 ) ph/cm2/s
Energy fluence (15-150 keV)             : 0 ( 0  0 ) ergs/cm2
Band function

Time interval is from    0.000 sec. to    0.064 sec.

Spectral model in the Band function:
------------------------------------------------------------
Parameters  : value       lower 90%   higher 90%
alpha       : 3.89624   ( -3.73497   -5.04115 )
beta        : -9.99580    ( 752.597   762.588 )
Epeak [keV] : 50.6983      ( -10.012 6.90706 )
Norm@50keV   : 4.96008    ( -4.93658   6.32929 )
------------------------------------------------------------
# Chi-Squared =          72.16 using 59 PHA bins.
# Reduced chi-squared =          1.312 for     55 degrees of freedom
# Null hypothesis probability =   6.016939e-02

Photon flux (15-150 keV)    in 0.064 sec:  (    ) ph/cm2/s
Energy fluence (15-150 keV)             : 0 ( 0  0 ) ergs/cm2
Pre-slew spectrum (Pre-slew PHA with pre-slew DRM)
Power-law model

Spectral model in power-law:
------------------------------------------------------------
Parameters  : value       lower 90%   higher 90%
Photon index: 2.51495     ( -1.13729   0.738109 )
Norm@50keV  : 1.75680E-03    ( -0.00176253   0.00128113 )
------------------------------------------------------------
# Chi-Squared =          86.28 using 59 PHA bins.
# Reduced chi-squared =          1.514 for     57 degrees of freedom
# Null hypothesis probability =   7.396719e-03

Photon flux (15-150 keV)    in 0.064 sec: 0.353825 ( -0.29428  0.317046 ) ph/cm2/s
Energy fluence (15-150 keV)             : 1.141e-09 ( -8.7031e-10  8.88019e-10 ) ergs/cm2
Cutoff power-law model
Spectral model in the cutoff power-law:
------------------------------------------------------------
Parameters  : value       lower 90%   higher 90%
Photon index: -3.89600     ( 3.90364   2.66052 )
Epeak [keV] : 50.8720      ( -9.48428 7.41621 )
Norm@50keV  : 4.82983    ( -4.86376   6.35185 )
------------------------------------------------------------
# Chi-Squared =          71.72 using 59 PHA bins.
# Reduced chi-squared =          1.281 for     56 degrees of freedom
# Null hypothesis probability =   7.681618e-02

Photon flux (15-150 keV)    in 0.064 sec: 0.914070 ( -0.358776  0.35871 ) ph/cm2/s
Energy fluence (15-150 keV)             : 0 ( 0  0 ) ergs/cm2
Band function
Spectral model in the Band function:
------------------------------------------------------------
Parameters  : value       lower 90%   higher 90%
alpha       : 3.86610   ( -4.23679   -5.51227 )
beta        : -9.99601    ( 792.088   802.08 )
Epeak [keV] : 50.6238      ( -10.5791 6.76528 )
Norm@50keV   : 4.82872    ( -4.81022   6.44754 )
------------------------------------------------------------
# Chi-Squared =          71.73 using 59 PHA bins.
# Reduced chi-squared =          1.304 for     55 degrees of freedom
# Null hypothesis probability =   6.437978e-02

Photon flux (15-150 keV)    in 0.064 sec:  (    ) ph/cm2/s
Energy fluence (15-150 keV)             : 0 ( 0  0 ) ergs/cm2
S(25-50 keV) vs. S(50-100 keV) plot

S(25-50 keV)  = 3.79506e-10
S(50-100 keV) = 2.62931e-10
T90 vs. Hardness ratio plot

T90                                   = 0.0639999508857727 sec.
Hardness ratio (energy fluence ratio) = 0.692824
Color vs. Color plot

Count Ratio  (25-50 keV) / (15-25 keV) = 97.9268
Count Ratio (50-100 keV) / (15-25 keV) = 163.439
Mask shadow pattern

IMX = 0, IMY = 0
TIME vs. PHA plot around the trigger time
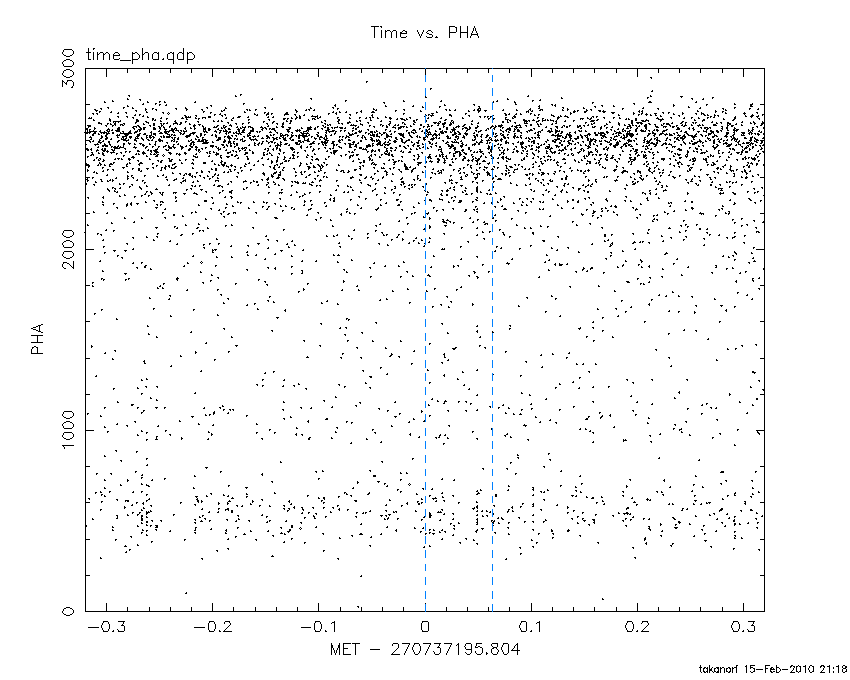
Blue+Cyan dotted lines: Time interval of the scaled map
From 0.000000 to 0.064000
TIME vs. DetID plot around the trigger time

Blue+Cyan dotted lines: Time interval of the scaled map
From 0.000000 to 0.064000
100 us light curve (15-350 keV)

Blue+Cyan dotted lines: Time interval of the scaled map
From 0.000000 to 0.064000
Spacecraft aspect plot

Bright source in the pre-burst/pre-slew/post-slew images
Pre-burst image of 15-350 keV band
Time interval of the image:
-60.804000 -3.804000

# RAcent  DECcent POSerr Theta    Phi  PeakCts   SNR AngSep     Name
#  [deg]    [deg]    ['] [deg]  [deg]                   [']
208.0945 -20.1355    2.4  19.9  123.5   0.3838   4.8 ------	UNKNOWN
Pre-slew background subtracted image of 15-350 keV band
Time interval of the image:
0.000000 0.064000

# RAcent  DECcent POSerr Theta    Phi  PeakCts   SNR AngSep     Name
#  [deg]    [deg]    ['] [deg]  [deg]                   [']
220.8702   1.4311    1.9  27.8   61.6   0.0232   6.0 ------	UNKNOWN
Post-slew image of 15-350 keV band
Time interval of the image:
47.496600 302.286000

# RAcent  DECcent POSerr Theta    Phi  PeakCts   SNR AngSep     Name
#  [deg]    [deg]    ['] [deg]  [deg]                   [']
135.6098 -40.6371    9.7  53.0 -157.4  -0.6934  -1.2    6.2	Vela X-1
170.3030 -60.4848    8.8  47.2  165.2   0.6420   1.3    8.3	Cen X-3
186.7342 -62.7734    4.3  47.4  154.1   1.4941   2.7    2.1	GX 301-2
232.5630  12.1018    2.4  50.5   31.7   4.2954   4.9 ------	UNKNOWN
207.2586 -44.4833    2.9  32.7  128.8   1.1447   4.0 ------	UNKNOWN
212.7123 -16.8501    3.1  22.1   69.2   0.7415   3.7 ------	UNKNOWN
202.3984  -9.9099    2.4  13.5   39.9   0.8565   4.8 ------	UNKNOWN
214.6963  24.4812    4.1  46.7    4.1   0.9531   2.8 ------	UNKNOWN
158.8947   2.8796    2.7  35.5  -89.4   1.8234   4.2 ------	UNKNOWN
131.7798 -31.7313    3.9  54.9 -146.0   4.3029   3.0 ------	UNKNOWN
Plot creation:
Mon Feb 15 21:18:56 EST 2010