Click here for the BAT GCN circular template
Image
Pre-slew 15.0-350.0 keV image (Event data)

#   RAcent    DECcent   POSerr    Theta     Phi              Peak Cts       SNR   Name
  273.7406    10.2796   0.0149    31.8565    18.6253         2.2916948     12.932 TRIG_00359378

Foreground time interval of the image:
 -9.452  73.501 (delta_t =  82.953 [sec])
Background time interval of the image:
-239.000  -9.452 (delta_t = 229.548 [sec])
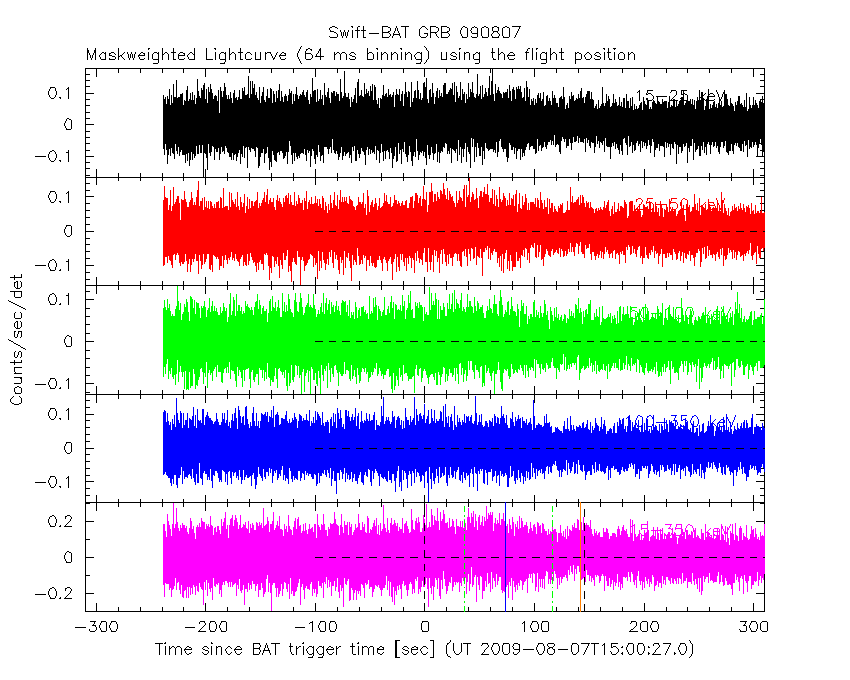
Lightcurves
Notes:
- 1) The mask-weighted light curves are using the flight position.
- 2) Multiple plots of different time binning/intervals are shown to cover all scenarios of short/long GRBs, rate/image triggers, and real/false positives.
- 3) For all the mask-weighted lightcurves, the y-axis units are counts/sec/det where a det is 0.4 x 0.4 = 0.16 sq cm.
- 4) The verticle lines correspond to following: green dotted lines are T50 interval, black dotted lines are T90 interval, blue solid line(s) is a spacecraft slew start time, and orange solid line(s) is a spacecraft slew end time.
- 5) Time of each bin is in the middle of the bin.
1 s binning
From T0-310 s to T0+310 s

From T100_start - 20 s to T100_end + 30 s

Full time interval

64 ms binning
Full time interval
From T100_start to T100_end

From T0-5 sec to T0+5 sec

16 ms binning
From T100_start-5 s to T100_start+5 s

8 ms binning
From T100_start-3 s to T100_start+3 s

2 ms binning
From T100_start-1 s to T100_start+1 s

SN=5 or 10 sec. binning (whichever binning is satisfied first)

SN=5 or 10 sec. binning (T < 200 sec)

Quad-rate summed light curves (from T0-300s to T0+1000s)

Spectral Evolution

Spectra
Notes:
- 1) The fitting includes the systematic errors.
- 2) When the burst includes telescope slew time periods, the fitting uses an average response file made from multiple 5-s response files through out the slew time plus single time preiod for the non-slew times, and weighted by the total counts in the corresponding time period using addrmf. An average response file is needed becuase a spectral fit using the pre-slew DRM will introduce some errors in both a spectral shape and a normalization if the PHA file contains a lot of the slew/post-slew time interval.
- 3) For fits to more complicated models (e.g. a power-law over a cutoff power-law), the BAT team has decided to require a chi-square improvement of more than 6 for each extra dof.
Time averaged spectrum fit using the average DRM
Power-law model

Time interval is from   -9.452 sec. to  151.488 sec.

Spectral model in power-law:
------------------------------------------------------------
Parameters  : value       lower 90%   higher 90%
Photon index: 2.22046     ( -0.140353   0.145502 )
Norm@50keV  : 1.43908E-03    ( -0.00013652   0.00013494 )
------------------------------------------------------------
#Fit statistic : Chi-Squared =          76.97 using 59 PHA bins.
# Reduced chi-squared =          1.350 for     57 degrees of freedom
# Null hypothesis probability =   4.017857e-02

Photon flux (15-150 keV)    in 160.9 sec: 0.240837 ( -0.016699  0.0167137 ) ph/cm2/s
Energy fluence (15-150 keV)             : 2.18351e-06 ( -1.75542e-07  1.78741e-07 ) ergs/cm2
Cutoff power-law model

Time interval is from   -9.452 sec. to  151.488 sec.
Spectral model in the cutoff power-law:
------------------------------------------------------------
Parameters  : value       lower 90%   higher 90%
Photon index: 1.47772     ( -0.738567   0.539303 )
Epeak [keV] : 26.9622      ( -24.7658 8.77595 )
Norm@50keV  : 4.02493E-03    ( -0.00215974   0.00732451 )
------------------------------------------------------------
#Fit statistic : Chi-Squared =          72.46 using 59 PHA bins.
# Reduced chi-squared =          1.294 for     56 degrees of freedom
# Null hypothesis probability =   6.857728e-02

Photon flux (15-150 keV)    in 160.9 sec: 0.232023 ( -0.017984  0.018034 ) ph/cm2/s
Energy fluence (15-150 keV)             : 1.99798e-06 ( -2.09331e-07  2.25517e-07 ) ergs/cm2
Band function

Time interval is from   -9.452 sec. to  151.488 sec.

Spectral model in the Band function:
------------------------------------------------------------
Parameters  : value       lower 90%   higher 90%
alpha       : -1.47858   ( -0.34737   0.56754 )
beta        : -10.0000    ( 10   20 )
Epeak [keV] : 26.9622      ( -8.37287 8.76824 )
Norm@50keV   : 4.01772E-03    ( -0.00214482   0.00733416 )
------------------------------------------------------------
#Fit statistic : Chi-Squared =          72.46 using 59 PHA bins.
# Reduced chi-squared =          1.317 for     55 degrees of freedom
# Null hypothesis probability =   5.732865e-02

Photon flux (15-150 keV)    in 160.9 sec: 0.232700 (    ) ph/cm2/s
Energy fluence (15-150 keV)             : 2.04839e-06 ( -2.04726e-06  -1.99419e-07 ) ergs/cm2
Single BB

Spectral model blackbody:
------------------------------------------------------------
Parameters  : value    Lower 90%  Upper 90%
kT [keV]    : 8.44740  (-0.650409  0.71844)
R^2/D10^2   : 0.204990  (-0.0582087   0.0801298)
(R is the radius in km and D10 is the distance to the source in units of 10 kpc)
------------------------------------------------------------
#Fit statistic : Chi-Squared =         100.10 using 59 PHA bins.
# Reduced chi-squared =         1.7561 for     57 degrees of freedom
# Null hypothesis probability =   3.676413e-04

Energy  Fluence     90% Error
[keV]   [erg/cm2]   [erg/cm2]
15- 25  4.418e-07   5.028e-08
25- 50  8.481e-07   6.951e-08
50-150  2.655e-07   5.672e-08
15-150  1.555e-06   1.273e-07
Thermal bremsstrahlung (OTTB)

Spectral model: thermal bremsstrahlung
------------------------------------------------------------
Parameters  : value         Lower 90%    Upper 90%
kT [keV]    : 45.4855       (-7.96707      10.9508)
Norm        : 1.41816       (-0.186691     0.222924)
------------------------------------------------------------
#Fit statistic : Chi-Squared =          72.53 using 59 PHA bins.
# Reduced chi-squared =          1.272 for     57 degrees of freedom
# Null hypothesis probability =   8.059115e-02

Energy  Fluence     90% Error
[keV]   [erg/cm2]   [erg/cm2]
15- 25  5.449e-07   5.310e-08
25- 50  7.555e-07   5.680e-08
50-150  6.689e-07   1.408e-07
15-150  1.969e-06   1.907e-07
Double BB

Spectral model: bbodyrad<1> + bbodyrad<2>
------------------------------------------------------------
Parameters  : value         Lower 90%    Upper 90%
kT1 [keV]   : 5.99182        (-1.00715      0.512856)
R1^2/D10^2  : 0.632514        (-0.26391      0.590748)
kT2 [keV]   : 19.1124        (-4.89938      8.76996)
R2^2/D10^2  : 4.74096E-03    (-0.0036402   0.0121785)
------------------------------------------------------------
#Fit statistic : Chi-Squared =          69.43 using 59 PHA bins.
# Reduced chi-squared =          1.262 for     55 degrees of freedom
# Null hypothesis probability =   9.122261e-02

Energy  Fluence     90% Error
[keV]   [erg/cm2]   [erg/cm2]
15- 25  5.392e-07   1.413e-07
25- 50  7.457e-07   1.755e-07
50-150  7.533e-07   3.952e-07
15-150  2.038e-06   6.932e-07
Peak spectrum fit
Power-law model

Time interval is from   41.948 sec. to   42.948 sec.

Spectral model in power-law:
------------------------------------------------------------
Parameters  : value       lower 90%   higher 90%
Photon index: 1.83044     ( -0.603265   0.662951 )
Norm@50keV  : 5.15587E-03    ( -0.00193015   0.00176566 )
------------------------------------------------------------
#Fit statistic : Chi-Squared =          47.99 using 59 PHA bins.
# Reduced chi-squared =         0.8419 for     57 degrees of freedom
# Null hypothesis probability =   7.966765e-01

Photon flux (15-150 keV)    in 1 sec: 0.719026 ( -0.208266  0.208725 ) ph/cm2/s
Energy fluence (15-150 keV)             : 4.74233e-08 ( -1.6494e-08  1.76907e-08 ) ergs/cm2
Cutoff power-law model

Time interval is from   41.948 sec. to   42.948 sec.
Spectral model in the cutoff power-law:
------------------------------------------------------------
Parameters  : value       lower 90%   higher 90%
Photon index: 1.82530     ( -1.11279   0.671078 )
Epeak [keV] : 9999.07      (   )
Norm@50keV  : 5.17605E-03    (     )
------------------------------------------------------------
#Fit statistic : Chi-Squared =          47.99 using 59 PHA bins.
# Reduced chi-squared =         0.8569 for     56 degrees of freedom
# Null hypothesis probability =   7.680894e-01

Photon flux (15-150 keV)    in 1 sec: 0.718887 ( -0.20768  0.208392 ) ph/cm2/s
Energy fluence (15-150 keV)             : 4.71267e-08 ( -1.65149e-08  1.71575e-08 ) ergs/cm2
Band function

Time interval is from   41.948 sec. to   42.948 sec.

Spectral model in the Band function:
------------------------------------------------------------
Parameters  : value       lower 90%   higher 90%
alpha       : -1.40921   ( 1.41063   1.41063 )
beta        : -1.83005    ( 1.83118   0.603273 )
Epeak [keV] : 27.1786      ( -26.5577 -26.5577 )
Norm@50keV   : 1.17186E-02    ( -0.0117996   1.41798e+06 )
------------------------------------------------------------
#Fit statistic : Chi-Squared =          47.98 using 59 PHA bins.
# Reduced chi-squared =         0.8724 for     55 degrees of freedom
# Null hypothesis probability =   7.374232e-01

Photon flux (15-150 keV)    in 1 sec:  (    ) ph/cm2/s
Energy fluence (15-150 keV)             : 0 ( 0  0 ) ergs/cm2
Single BB

Spectral model blackbody:
------------------------------------------------------------
Parameters  : value    Lower 90%  Upper 90%
kT [keV]    : 8.29201  (-2.41032  4.95013)
R^2/D10^2   : 0.652428  (-0.650215   1.95658)
(R is the radius in km and D10 is the distance to the source in units of 10 kpc)
------------------------------------------------------------
#Fit statistic : Chi-Squared =          52.61 using 59 PHA bins.
# Reduced chi-squared =         0.9230 for     57 degrees of freedom
# Null hypothesis probability =   6.402856e-01

Energy  Fluence     90% Error
[keV]   [erg/cm2]   [erg/cm2]
15- 25  8.320e-09   5.040e-09
25- 50  1.548e-08   9.765e-09
50-150  4.568e-09   3.440e-09
15-150  2.837e-08   1.765e-08
Thermal bremsstrahlung (OTTB)

Spectral model: thermal bremsstrahlung
------------------------------------------------------------
Parameters  : value         Lower 90%    Upper 90%
kT [keV]    : 100.084       (-101.097      -101.097)
Norm        : 3.11283       (-1.0785     2.4613)
------------------------------------------------------------
#Fit statistic : Chi-Squared =          48.83 using 59 PHA bins.
# Reduced chi-squared =         0.8567 for     57 degrees of freedom
# Null hypothesis probability =   7.708731e-01

Energy  Fluence     90% Error
[keV]   [erg/cm2]   [erg/cm2]
15- 25  8.136e-09   4.957e-09
25- 50  1.407e-08   8.825e-09
50-150  2.281e-08   1.798e-08
15-150  4.502e-08   3.010e-08
Double BB

Spectral model: bbodyrad<1> + bbodyrad<2>
------------------------------------------------------------
Parameters  : value         Lower 90%    Upper 90%
kT1 [keV]   : 6.47300        (-2.37162      2.98149)
R1^2/D10^2  : 1.49511        (-1.15931      2.45266)
kT2 [keV]   : 51.8196        (-33.605      -52.4694)
R2^2/D10^2  : 1.18979E-03    (-0.00111486   0.0201386)
------------------------------------------------------------
#Fit statistic : Chi-Squared =          46.04 using 59 PHA bins.
# Reduced chi-squared =         0.8370 for     55 degrees of freedom
# Null hypothesis probability =   7.999414e-01

Energy  Fluence     90% Error
[keV]   [erg/cm2]   [erg/cm2]
15- 25  9.549e-09   5.780e-09
25- 50  1.326e-08   7.610e-09
50-150  3.258e-08   1.926e-08
15-150  5.539e-08   2.760e-08
Pre-slew spectrum (Pre-slew PHA with pre-slew DRM)
Power-law model

Spectral model in power-law:
------------------------------------------------------------
Parameters  : value       lower 90%   higher 90%
Photon index: 2.13677     ( -0.172512   0.180755 )
Norm@50keV  : 1.66622E-03    ( -0.000202966   0.000200213 )
------------------------------------------------------------
#Fit statistic : Chi-Squared =          67.99 using 59 PHA bins.
# Reduced chi-squared =          1.193 for     57 degrees of freedom
# Null hypothesis probability =   1.512660e-01

Photon flux (15-150 keV)    in 82.95 sec: 0.267000 ( -0.0242939  0.0243036 ) ph/cm2/s
Energy fluence (15-150 keV)             : 1.2891e-06 ( -1.38604e-07  1.41882e-07 ) ergs/cm2
Cutoff power-law model

Spectral model in the cutoff power-law:
------------------------------------------------------------
Parameters  : value       lower 90%   higher 90%
Photon index: 0.783199     ( -1.16086   0.899353 )
Epeak [keV] : 33.8534      ( -10.4916 7.00497 )
Norm@50keV  : 1.11318E-02    ( -0.0111373   0.0481588 )
------------------------------------------------------------
#Fit statistic : Chi-Squared =          60.58 using 59 PHA bins.
# Reduced chi-squared =          1.082 for     56 degrees of freedom
# Null hypothesis probability =   3.141500e-01

Photon flux (15-150 keV)    in 82.95 sec: 0.253111 ( -0.025391  0.025563 ) ph/cm2/s
Energy fluence (15-150 keV)             : 1.11574e-06 ( -1.45892e-07  1.66555e-07 ) ergs/cm2
Band function

Spectral model in the Band function:
------------------------------------------------------------
Parameters  : value       lower 90%   higher 90%
alpha       : 1.34893   ( -2.74749   -1.36082 )
beta        : -2.62204    ( 2.62041   0.380639 )
Epeak [keV] : 28.8297      ( -4.96207 9.3449 )
Norm@50keV   : 0.395239    ( -0.428064   89.076 )
------------------------------------------------------------
#Fit statistic : Chi-Squared =          59.03 using 59 PHA bins.
# Reduced chi-squared =          1.073 for     55 degrees of freedom
# Null hypothesis probability =   3.304054e-01

Photon flux (15-150 keV)    in 82.95 sec:  (    ) ph/cm2/s
Energy fluence (15-150 keV)             : 1.18883e-06 ( -1.18825e-06  -1.64822e-07 ) ergs/cm2
S(25-50 keV) vs. S(50-100 keV) plot

S(25-50 keV)  = 6.95e-07
S(50-100 keV) = 5.96e-07
T90 vs. Hardness ratio plot

T90                                   = 146.351999938488 sec.
Hardness ratio (energy fluence ratio) = 0.857554
Color vs. Color plot

Count Ratio  (25-50 keV) / (15-25 keV) = 1.03862
Count Ratio (50-100 keV) / (15-25 keV) = 0.414584
Mask shadow pattern

IMX = 5.888474441801412E-01, IMY = -1.984581321168578E-01
TIME vs. PHA plot around the trigger time

TIME vs. DetID plot around the trigger time

100 us light curve (15-350 keV)

Spacecraft aspect plot

Bright source in the pre-burst/pre-slew/post-slew images
Pre-burst image of 15-350 keV band
Time interval of the image:
-239.000000 -9.452000

# RAcent  DECcent POSerr Theta    Phi  PeakCts   SNR AngSep     Name
#  [deg]    [deg]    ['] [deg]  [deg]                   [']
244.9788 -15.6320    0.2  24.1  -69.5  16.1379  48.2    0.5	Sco X-1
255.9616 -37.8415    0.9  20.3 -136.4   3.5255  12.6    1.2	4U 1700-377
256.2347 -36.2851    0.0  19.0 -133.9   0.0021   0.0   12.7	GX 349+2
263.0900 -24.5843    6.4   6.9 -108.6   0.4720   1.8   10.6	GX 1+4
264.9264 -44.5842    7.9  23.6 -160.6   0.4409   1.5   11.2	4U 1735-44
268.3818  -1.4441    2.1  19.9    7.3   1.4172   5.6    1.0	SW J1753.5-0127
270.3120 -25.0154    4.5   3.7 -178.2   0.6716   2.6    4.1	GX 5-1
270.3058 -25.6706   17.5   4.4 -176.7   0.1751   0.7    4.4	GRS 1758-258
274.0407 -14.1191    4.1   8.3   41.8   0.6895   2.8    5.4	GX 17+2
275.8482 -30.2713    4.2  10.5  160.3   0.6935   2.7    7.0	H1820-303
284.9964 -24.7785    9.7  14.5  117.7  -0.3665  -1.2    8.8	HT1900.1-2455
288.7024  10.9605   64.2  37.3   42.9   0.0992   0.2    5.7	GRS 1915+105
262.8087 -33.8274    5.0  13.9 -144.7   0.6088   2.3    9.0	GX 354-0
319.0591 -41.7480    3.2  46.0  139.1   4.0070   3.6 ------	UNKNOWN
267.8301  29.3873    2.5  50.7    8.9   3.8157   4.7 ------	UNKNOWN
255.0755 -41.6871    1.9  23.8 -141.2   1.6555   6.0 ------	UNKNOWN
219.3857 -69.8322    3.4  56.9 -150.6   5.1784   3.4 ------	UNKNOWN
Pre-slew background subtracted image of 15-350 keV band
Time interval of the image:
-9.452000 73.500590

# RAcent  DECcent POSerr Theta    Phi  PeakCts   SNR AngSep     Name
#  [deg]    [deg]    ['] [deg]  [deg]                   [']
244.8263 -15.6864    4.6  24.2  -69.8  -0.4150  -2.5    9.3	Sco X-1
256.1661 -37.8046    4.0  20.2 -136.7   0.4186   2.9    8.8	4U 1700-377
256.6366 -36.5608    0.0  19.0 -135.2   0.1338   0.9   12.7	GX 349+2
263.0367 -24.8417   11.4   7.0 -110.3  -0.1341  -1.0    6.0	GX 1+4
264.5646 -44.5301    7.2  23.6 -159.9  -0.2258  -1.6    9.0	4U 1735-44
268.2694  -1.5664  113.9  19.8    6.9  -0.0133  -0.1    9.0	SW J1753.5-0127
270.3896 -24.9470    6.7   3.7 -179.5  -0.2308  -1.7    9.8	GX 5-1
270.4737 -25.7518   10.4   4.5 -178.5   0.1491   1.1    9.3	GRS 1758-258
274.1003 -14.1556   17.3   8.3   42.3   0.0865   0.7    9.0	GX 17+2
275.8677 -30.4921    8.2  10.7  160.9  -0.1794  -1.4    8.1	H1820-303
285.0118 -24.7740    4.0  14.5  117.7   0.3971   2.9    8.9	HT1900.1-2455
288.8991  10.9752    4.4  37.4   43.2   0.7062   2.6    6.2	GRS 1915+105
262.8051 -33.8079    3.9  13.9 -144.6  -0.3840  -3.0    9.3	GX 354-0
273.7406  10.2796    0.9  31.9   18.6   2.2968  13.0 ------	UNKNOWN
Post-slew image of 15-350 keV band
Time interval of the image:
141.700600 963.056700

# RAcent  DECcent POSerr Theta    Phi  PeakCts   SNR AngSep     Name
#  [deg]    [deg]    ['] [deg]  [deg]                   [']
244.9759 -15.6391    0.2  38.5 -162.6  50.5121  49.0    0.2	Sco X-1
254.5541  35.1728    0.0  30.4  -62.8  -2.0877  -1.6   11.2	Her X-1
255.9784 -37.8603    1.8  50.9  167.4  16.0810   6.3    1.0	4U 1700-377
256.4493 -36.2574    0.0  49.3  167.7   3.6671   1.7   10.0	GX 349+2
262.9751 -24.7683    3.3  36.6  165.9   4.0602   3.5    2.3	GX 1+4
268.4063  -1.5062    2.6  12.9  173.9   3.5822   4.5    4.0	SW J1753.5-0127
270.2828 -25.0647  103.7  35.5  154.7   0.1440   0.1    0.9	GX 5-1
270.3018 -25.7433   11.7  36.2  154.6   1.3872   1.0    0.0	GRS 1758-258
273.9966 -14.0301   29.1  24.3  148.7   0.3235   0.4    0.7	GX 17+2
276.0861 -30.3936    5.6  40.7  146.2   4.2770   2.1    8.5	H1820-303
285.0325 -24.9117  291.5  36.9  132.1   0.0624   0.0    0.6	HT1900.1-2455
288.8275  11.0099    2.0  14.8   55.1   4.1300   5.9    4.2	GRS 1915+105
299.6042  35.1915    0.4  34.3    8.6  30.8167  32.4    0.9	Cyg X-1
308.0660  40.9818    2.7  43.1    7.8   5.3790   4.3    2.7	Cyg X-3
263.0626 -33.9342    8.2  45.4  161.8   2.8038   1.4    7.0	GX 354-0
314.1584  24.9741    2.4  41.0   32.8   6.9121   4.9 ------	UNKNOWN
298.3734  35.3348    2.7  33.6    7.2   3.7380   4.3 ------	UNKNOWN
263.4135  18.9568    2.4  13.2  -78.6   3.5766   4.8 ------	UNKNOWN
227.1498  -4.1733    4.2  48.6 -135.7   9.9836   2.8 ------	UNKNOWN
Plot creation:
Sun May 31 03:16:02 EDT 2015