Click here for the BAT GCN circular template
Image
Pre-slew 15.0-350.0 keV image (Event data)
#   RAcent    DECcent   POSerr    Theta     Phi              Peak Cts       SNR   Name
  239.6059    25.5856   0.0182    30.2294    73.4195         1.8617064     10.570 TRIG_00359951

Foreground time interval of the image:
-14.400  72.928 (delta_t =  87.328 [sec])
Background time interval of the image:
-239.000 -14.400 (delta_t = 224.600 [sec])
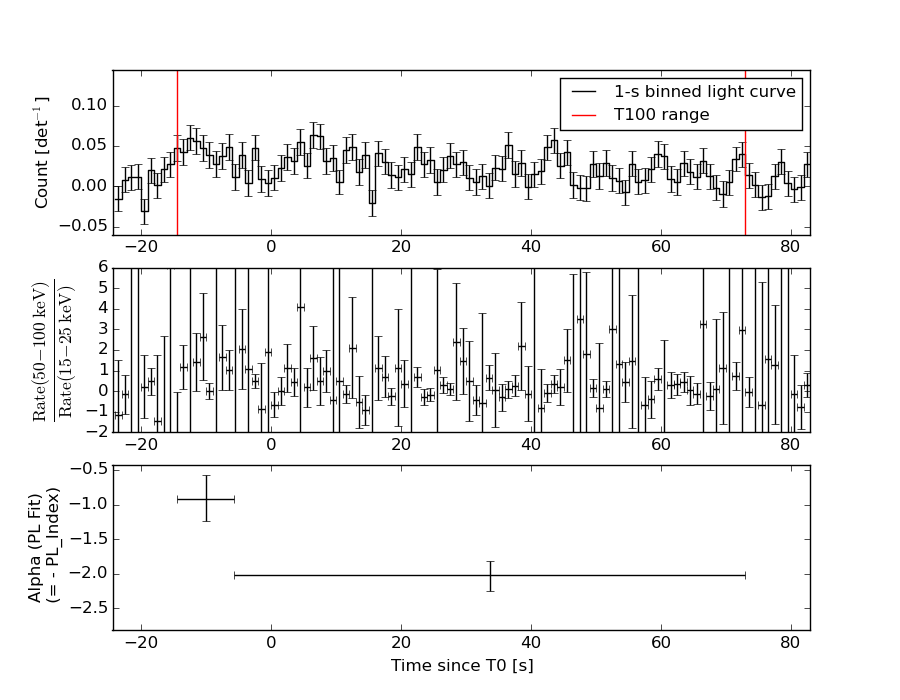
Lightcurves
Notes:
- 1) The mask-weighted light curves are using the flight position.
- 2) Multiple plots of different time binning/intervals are shown to cover all scenarios of short/long GRBs, rate/image triggers, and real/false positives.
- 3) For all the mask-weighted lightcurves, the y-axis units are counts/sec/det where a det is 0.4 x 0.4 = 0.16 sq cm.
- 4) The verticle lines correspond to following: green dotted lines are T50 interval, black dotted lines are T90 interval, blue solid line(s) is a spacecraft slew start time, and orange solid line(s) is a spacecraft slew end time.
- 5) Time of each bin is in the middle of the bin.
1 s binning
From T0-310 s to T0+310 s
From T100_start - 20 s to T100_end + 30 s
Full time interval
64 ms binning
Full time interval
From T100_start to T100_end
From T0-5 sec to T0+5 sec
16 ms binning
From T100_start-5 s to T100_start+5 s
8 ms binning
From T100_start-3 s to T100_start+3 s
2 ms binning
From T100_start-1 s to T100_start+1 s

SN=5 or 10 sec. binning (whichever binning is satisfied first)
SN=5 or 10 sec. binning (T < 200 sec)

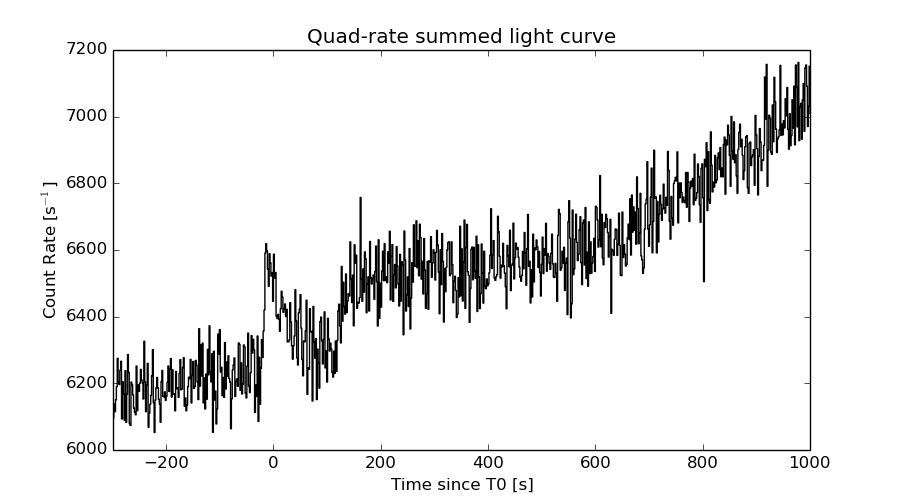
Quad-rate summed light curves (from T0-300s to T0+1000s)
Spectral Evolution
Spectra
Notes:
- 1) The fitting includes the systematic errors.
- 2) When the burst includes telescope slew time periods, the fitting uses an average response file made from multiple 5-s response files through out the slew time plus single time preiod for the non-slew times, and weighted by the total counts in the corresponding time period using addrmf. An average response file is needed becuase a spectral fit using the pre-slew DRM will introduce some errors in both a spectral shape and a normalization if the PHA file contains a lot of the slew/post-slew time interval.
- 3) For fits to more complicated models (e.g. a power-law over a cutoff power-law), the BAT team has decided to require a chi-square improvement of more than 6 for each extra dof.
Time averaged spectrum fit using the average DRM
Power-law model
Time interval is from  -14.400 sec. to   72.928 sec.

Spectral model in power-law:
------------------------------------------------------------
Parameters  : value       lower 90%   higher 90%
Photon index: 1.84191     ( -0.186148   0.194949 )
Norm@50keV  : 1.55808E-03    ( -0.000196969   0.000193094 )
------------------------------------------------------------
#Fit statistic : Chi-Squared =          45.35 using 59 PHA bins.
# Reduced chi-squared =         0.7956 for     57 degrees of freedom
# Null hypothesis probability =   8.670292e-01

Photon flux (15-150 keV)    in 87.33 sec: 0.218288 ( -0.0230744  0.0230802 ) ph/cm2/s
Energy fluence (15-150 keV)             : 1.25127e-06 ( -1.57067e-07  1.60096e-07 ) ergs/cm2
Cutoff power-law model
Time interval is from  -14.400 sec. to   72.928 sec.
Spectral model in the cutoff power-law:
------------------------------------------------------------
Parameters  : value       lower 90%   higher 90%
Photon index: 1.01905     ( -0.933421   0.772677 )
Epeak [keV] : 52.4353      ( -12.563 95.0647 )
Norm@50keV  : 4.47493E-03    ( -0.00277359   0.0101533 )
------------------------------------------------------------
#Fit statistic : Chi-Squared =          42.01 using 59 PHA bins.
# Reduced chi-squared =         0.7501 for     56 degrees of freedom
# Null hypothesis probability =   9.173514e-01

Photon flux (15-150 keV)    in 87.33 sec: 0.211678 ( -0.023852  0.023859 ) ph/cm2/s
Energy fluence (15-150 keV)             : 1.16436e-06 ( -1.67385e-07  1.76896e-07 ) ergs/cm2
Band function

Time interval is from  -14.400 sec. to   72.928 sec.

Spectral model in the Band function:
------------------------------------------------------------
Parameters  : value       lower 90%   higher 90%
alpha       : -1.03148   ( -0.71135   0.820962 )
beta        : -9.37087    ( 9.3715   19.3715 )
Epeak [keV] : 52.6872      ( -12.5732 77.7254 )
Norm@50keV   : 4.39709E-03    ( -0.00269156   0.00167058 )
------------------------------------------------------------
#Fit statistic : Chi-Squared =          42.01 using 59 PHA bins.
# Reduced chi-squared =         0.7638 for     55 degrees of freedom
# Null hypothesis probability =   9.010460e-01

Photon flux (15-150 keV)    in 87.33 sec: 0.211905 (    ) ph/cm2/s
Energy fluence (15-150 keV)             : 1.16588e-06 ( 0  0 ) ergs/cm2
Single BB
Spectral model blackbody:
------------------------------------------------------------
Parameters  : value    Lower 90%  Upper 90%
kT [keV]    : 11.6190  (-1.38179  1.55887)
R^2/D10^2   : 5.95996E-02  (-0.0222682   0.0357122)
(R is the radius in km and D10 is the distance to the source in units of 10 kpc)
------------------------------------------------------------
#Fit statistic : Chi-Squared =          56.39 using 59 PHA bins.
# Reduced chi-squared =         0.9894 for     57 degrees of freedom
# Null hypothesis probability =   4.977682e-01

Energy  Fluence     90% Error
[keV]   [erg/cm2]   [erg/cm2]
15- 25  1.481e-07   2.878e-08
25- 50  4.485e-07   6.510e-08
50-150  3.561e-07   9.091e-08
15-150  9.528e-07   1.351e-07
Thermal bremsstrahlung (OTTB)
Spectral model: thermal bremsstrahlung
------------------------------------------------------------
Parameters  : value         Lower 90%    Upper 90%
kT [keV]    : 87.8542       (-26.2485      48.3717)
Norm        : 1.00228       (-0.143261     0.174013)
------------------------------------------------------------
#Fit statistic : Chi-Squared =          42.36 using 59 PHA bins.
# Reduced chi-squared =         0.7431 for     57 degrees of freedom
# Null hypothesis probability =   9.260015e-01

Energy  Fluence     90% Error
[keV]   [erg/cm2]   [erg/cm2]
15- 25  2.282e-07   3.498e-08
25- 50  3.839e-07   4.314e-08
50-150  5.759e-07   2.409e-07
15-150  1.188e-06   2.677e-07
Double BB
Spectral model: bbodyrad<1> + bbodyrad<2>
------------------------------------------------------------
Parameters  : value         Lower 90%    Upper 90%
kT1 [keV]   : 4.36866        (-1.36858      1.96849)
R1^2/D10^2  : 1.30399        (-0.992095      6.24177)
kT2 [keV]   : 15.6449        (-2.71555      4.37297)
R2^2/D10^2  : 1.65279E-02    (-0.0106497   0.0173661)
------------------------------------------------------------
#Fit statistic : Chi-Squared =          40.18 using 59 PHA bins.
# Reduced chi-squared =         0.7305 for     55 degrees of freedom
# Null hypothesis probability =   9.331195e-01

Energy  Fluence     90% Error
[keV]   [erg/cm2]   [erg/cm2]
15- 25  2.297e-07   1.124e-07
25- 50  3.749e-07   1.512e-07
50-150  5.151e-07   2.848e-07
15-150  1.120e-06   5.201e-07
Peak spectrum fit
Power-law model

Time interval is from    5.892 sec. to    6.892 sec.

Spectral model in power-law:
------------------------------------------------------------
Parameters  : value       lower 90%   higher 90%
Photon index: 1.41322     ( -0.709947   0.705999 )
Norm@50keV  : 4.39175E-03    ( -0.00172617   0.00168586 )
------------------------------------------------------------
#Fit statistic : Chi-Squared =          63.04 using 59 PHA bins.
# Reduced chi-squared =          1.106 for     57 degrees of freedom
# Null hypothesis probability =   2.712414e-01

Photon flux (15-150 keV)    in 1 sec: 0.536461 ( -0.205602  0.206805 ) ph/cm2/s
Energy fluence (15-150 keV)             : 4.23226e-08 ( -1.77521e-08  1.85825e-08 ) ergs/cm2
Cutoff power-law model

Time interval is from    5.892 sec. to    6.892 sec.
Spectral model in the cutoff power-law:
------------------------------------------------------------
Parameters  : value       lower 90%   higher 90%
Photon index: 1.00035     ( -7.01079   6.08418 )
Epeak [keV] : 115.049      ( -117.316 -117.316 )
Norm@50keV  : 7.25642E-03    ( -0.00444959   46.4648 )
------------------------------------------------------------
#Fit statistic : Chi-Squared =          62.99 using 59 PHA bins.
# Reduced chi-squared =          1.125 for     56 degrees of freedom
# Null hypothesis probability =   2.427890e-01

Photon flux (15-150 keV)    in 1 sec: 0.527436 ( -0.226647  0.213209 ) ph/cm2/s
Energy fluence (15-150 keV)             : 4.06723e-08 ( -2.08989e-08  1.99507e-08 ) ergs/cm2
Band function
Time interval is from    5.892 sec. to    6.892 sec.

Spectral model in the Band function:
------------------------------------------------------------
Parameters  : value       lower 90%   higher 90%
alpha       : -9.78487E-02   ( 0.79502   0.79502 )
beta        : -1.75164    ( 1.61908   0.888777 )
Epeak [keV] : 57.9440      ( -57.5023 190.817 )
Norm@50keV   : 2.50757E-02    ( -0.0269698   1152.05 )
------------------------------------------------------------
#Fit statistic : Chi-Squared =          62.77 using 59 PHA bins.
# Reduced chi-squared =          1.141 for     55 degrees of freedom
# Null hypothesis probability =   2.201066e-01

Photon flux (15-150 keV)    in 1 sec:  (    ) ph/cm2/s
Energy fluence (15-150 keV)             : 0 ( 0  0 ) ergs/cm2
Single BB
Spectral model blackbody:
------------------------------------------------------------
Parameters  : value    Lower 90%  Upper 90%
kT [keV]    : 13.9438  (-5.00014  10.3244)
R^2/D10^2   : 7.99741E-02  (-0.0798661   0.306533)
(R is the radius in km and D10 is the distance to the source in units of 10 kpc)
------------------------------------------------------------
#Fit statistic : Chi-Squared =          63.83 using 59 PHA bins.
# Reduced chi-squared =          1.120 for     57 degrees of freedom
# Null hypothesis probability =   2.489724e-01

Energy  Fluence     90% Error
[keV]   [erg/cm2]   [erg/cm2]
15- 25  3.286e-09   2.127e-09
25- 50  1.217e-08   7.755e-09
50-150  1.555e-08   1.115e-08
15-150  3.101e-08   1.946e-08
Thermal bremsstrahlung (OTTB)
Spectral model: thermal bremsstrahlung
------------------------------------------------------------
Parameters  : value         Lower 90%    Upper 90%
kT [keV]    : 199.363       (-199.363      -199.363)
Norm        : 2.20932       (-0.834998     0.835249)
------------------------------------------------------------
#Fit statistic : Chi-Squared =          63.09 using 59 PHA bins.
# Reduced chi-squared =          1.107 for     57 degrees of freedom
# Null hypothesis probability =   2.698721e-01

Energy  Fluence     90% Error
[keV]   [erg/cm2]   [erg/cm2]
15- 25  5.501e-09   3.614e-09
25- 50  1.058e-08   6.660e-09
50-150  2.321e-08   1.463e-08
15-150  3.929e-08   2.515e-08
Double BB

R1^2/D10^2  : 0.155852        (      )
kT2 [keV]   : 200.000        (      )
R2^2/D10^2  : 6.56822E-05    (-6.57136e-05   -6.57136e-05)
------------------------------------------------------------
#Fit statistic : Chi-Squared =          62.46 using 59 PHA bins.
#Fit statistic : Chi-Squared =          62.43 using 59 PHA bins.
#Fit statistic : Chi-Squared =          62.36 using 59 PHA bins.
# Reduced chi-squared =          1.136 for     55 degrees of freedom
# Reduced chi-squared =          1.135 for     55 degrees of freedom
# Reduced chi-squared =          1.134 for     55 degrees of freedom
# Null hypothesis probability =   2.283820e-01
# Null hypothesis probability =   2.291602e-01
# Null hypothesis probability =   2.309570e-01

Energy  Fluence     90% Error
[keV]   [erg/cm2]   [erg/cm2]
15- 25  4.193e-09   2.719e-09
25- 50  1.200e-08   8.335e-09
50-150  2.566e-08   1.149e-08
15-150  4.186e-08   2.201e-08
Pre-slew spectrum (Pre-slew PHA with pre-slew DRM)
Power-law model

Spectral model in power-law:
------------------------------------------------------------
Parameters  : value       lower 90%   higher 90%
Photon index: 1.84191     ( -0.186148   0.194949 )
Norm@50keV  : 1.55808E-03    ( -0.000196969   0.000193094 )
------------------------------------------------------------
#Fit statistic : Chi-Squared =          45.35 using 59 PHA bins.
# Reduced chi-squared =         0.7956 for     57 degrees of freedom
# Null hypothesis probability =   8.670292e-01

Photon flux (15-150 keV)    in 87.33 sec: 0.218288 ( -0.0230744  0.0230802 ) ph/cm2/s
Energy fluence (15-150 keV)             : 1.25127e-06 ( -1.57067e-07  1.60096e-07 ) ergs/cm2
Cutoff power-law model
Spectral model in the cutoff power-law:
------------------------------------------------------------
Parameters  : value       lower 90%   higher 90%
Photon index: 1.01905     ( -0.933421   0.772677 )
Epeak [keV] : 52.4353      ( -12.563 95.0647 )
Norm@50keV  : 4.47493E-03    ( -0.00277359   0.0101533 )
------------------------------------------------------------
#Fit statistic : Chi-Squared =          42.01 using 59 PHA bins.
# Reduced chi-squared =         0.7501 for     56 degrees of freedom
# Null hypothesis probability =   9.173514e-01

Photon flux (15-150 keV)    in 87.33 sec: 0.211678 ( -0.023852  0.023859 ) ph/cm2/s
Energy fluence (15-150 keV)             : 1.16436e-06 ( -1.67385e-07  1.76896e-07 ) ergs/cm2
Band function

Spectral model in the Band function:
------------------------------------------------------------
Parameters  : value       lower 90%   higher 90%
alpha       : -1.03148   ( -0.71135   0.820962 )
beta        : -9.37087    ( 9.3715   19.3715 )
Epeak [keV] : 52.6872      ( -12.5732 77.6844 )
Norm@50keV   : 4.39709E-03    ( -0.00269156   0.00167058 )
------------------------------------------------------------
#Fit statistic : Chi-Squared =          42.01 using 59 PHA bins.
# Reduced chi-squared =         0.7638 for     55 degrees of freedom
# Null hypothesis probability =   9.010460e-01

Photon flux (15-150 keV)    in 87.33 sec: 0.211905 (    ) ph/cm2/s
Energy fluence (15-150 keV)             : 1.16588e-06 ( 0  0 ) ergs/cm2
S(25-50 keV) vs. S(50-100 keV) plot

S(25-50 keV)  = 3.58e-07
S(50-100 keV) = 3.99e-07
T90 vs. Hardness ratio plot
T90                                   = 78.0640000104904 sec.
Hardness ratio (energy fluence ratio) = 1.11453
Color vs. Color plot
Count Ratio  (25-50 keV) / (15-25 keV) = 1.14824
Count Ratio (50-100 keV) / (15-25 keV) = 0.660695
Mask shadow pattern

IMX = 1.662802453038599E-01, IMY = -5.584711544197322E-01
TIME vs. PHA plot around the trigger time

TIME vs. DetID plot around the trigger time
100 us light curve (15-350 keV)
Spacecraft aspect plot
Bright source in the pre-burst/pre-slew/post-slew images
Pre-burst image of 15-350 keV band
Time interval of the image:
-239.000000 -14.400000

# RAcent  DECcent POSerr Theta    Phi  PeakCts   SNR AngSep     Name
#  [deg]    [deg]    ['] [deg]  [deg]                   [']
254.6591  35.3577    0.0  42.6   55.5   0.8802   1.5    9.9	Her X-1
183.5191  75.1946    3.4  50.8  -16.5   1.3712   3.4 ------	UNKNOWN
182.1965 -23.3680    2.3  54.2 -162.1   2.5775   5.0 ------	UNKNOWN
177.4738 -26.2201    3.1  58.7 -159.2   4.5053   3.7 ------	UNKNOWN
170.0696 -16.7091    3.0  54.9 -146.0   4.8513   3.8 ------	UNKNOWN
Pre-slew background subtracted image of 15-350 keV band
Time interval of the image:
-14.400000 72.928000

# RAcent  DECcent POSerr Theta    Phi  PeakCts   SNR AngSep     Name
#  [deg]    [deg]    ['] [deg]  [deg]                   [']
254.5518  35.3555    4.7  42.5   55.5   1.0049   2.4    4.7	Her X-1
262.7037  55.4267    2.7  50.4   28.7   1.9568   4.3 ------	UNKNOWN
239.6057  25.5856    1.1  30.2   73.4   1.8632  10.6 ------	UNKNOWN
234.3036  16.6878    2.1  27.8   93.9   0.8840   5.5 ------	UNKNOWN
221.9050  13.5727    2.1  19.2  116.7   0.6253   5.4 ------	UNKNOWN
Post-slew image of 15-350 keV band
Time interval of the image:
148.700640 963.070700

# RAcent  DECcent POSerr Theta    Phi  PeakCts   SNR AngSep     Name
#  [deg]    [deg]    ['] [deg]  [deg]                   [']
244.9784 -15.6520    0.4  41.6  156.9  38.2260  32.5    0.7	Sco X-1
254.5019  35.4152    2.6  16.1   33.8   2.5451   4.4    4.9	Her X-1
268.3011  -1.5009    4.9  38.8  114.7   3.7091   2.3    5.0	SW J1753.5-0127
297.7510  44.2309    4.8  50.0   37.3   5.8171   2.5 ------	UNKNOWN
275.8821  62.6643    3.2  44.1    7.7   3.2265   3.7 ------	UNKNOWN
294.2235  72.6949    3.6  55.4    1.9   6.4758   3.2 ------	UNKNOWN
251.8230  59.6612    3.3  35.1   -4.5   2.5643   3.5 ------	UNKNOWN
221.3571 -19.8927    2.4  48.8 -172.3   6.1307   4.9 ------	UNKNOWN
197.9786  -4.5161    3.6  50.4 -136.0  10.8632   3.2 ------	UNKNOWN
Plot creation:
Sun May 31 03:09:09 EDT 2015