Special notes of this burst
Image
Pre-slew 25.0-100.0 keV image (Event data)

#RAcent DECcent POSerr Theta  Phi  Peak_Cts  SNR Name
108.278 -25.100 0.000 23.376 -39.373 0.160 8.547 TRIG_00361489

Image time interval: 0.000 to 5.504 [sec]
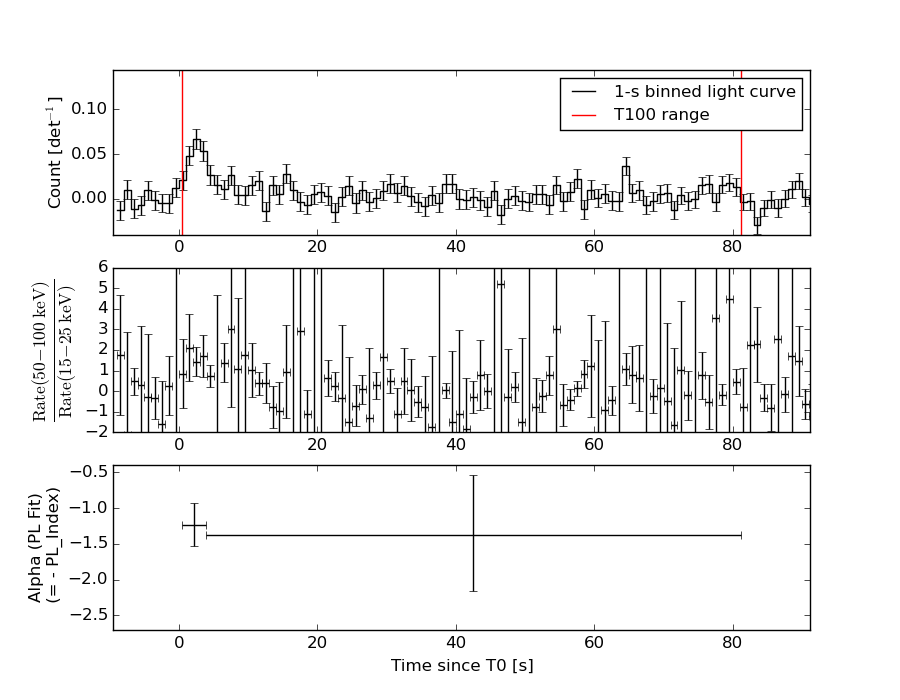
Lightcurves
Notes:
- 1) The mask-weighted light curves are using the flight position.
- 2) Multiple plots of different time binning/intervals are shown to cover all scenarios of short/long GRBs, rate/image triggers, and real/false positives.
- 3) For all the mask-weighted lightcurves, the y-axis units are counts/sec/det where a det is 0.4 x 0.4 = 0.16 sq cm.
- 4) The verticle lines correspond to following: green dotted lines are T50 interval, black dotted lines are T90 interval, blue solid line(s) is a spacecraft slew start time, and orange solid line(s) is a spacecraft slew end time.
- 5) Time of each bin is in the middle of the bin.
1 s binning
From T0-310 s to T0+310 s

From T100_start - 20 s to T100_end + 30 s

Full time interval

64 ms binning
Full time interval

From T100_start to T100_end

From T0-5 sec to T0+5 sec

16 ms binning
From T100_start-5 s to T100_start+5 s

Blue+Cyan dotted lines: Time interval of the scaled map
From 0.000000 to 5.504000
8 ms binning
From T100_start-3 s to T100_start+3 s

Blue+Cyan dotted lines: Time interval of the scaled map
From 0.000000 to 5.504000
2 ms binning
From T100_start-1 s to T100_start+1 s

Blue+Cyan dotted lines: Time interval of the scaled map
From 0.000000 to 5.504000
SN=5 or 10 sec. binning (whichever binning is satisfied first)

SN=5 or 10 sec. binning (T < 200 sec)

Quad-rate summed light curves (from T0-300s to T0+1000s)

Spectral Evolution
Spectra
Notes:
- 1) The fitting includes the systematic errors.
- 2) When the burst includes telescope slew time periods, the fitting uses an average response file made from multiple 5-s response files through out the slew time plus single time preiod for the non-slew times, and weighted by the total counts in the corresponding time period using addrmf. An average response file is needed becuase a spectral fit using the pre-slew DRM will introduce some errors in both a spectral shape and a normalization if the PHA file contains a lot of the slew/post-slew time interval.
- 3) For fits to more complicated models (e.g. a power-law over a cutoff power-law), the BAT team has decided to require a chi-square improvement of more than 6 for each extra dof.
Time averaged spectrum fit using the average DRM
Power-law model

Time interval is from    0.408 sec. to   81.176 sec.

Spectral model in power-law:
------------------------------------------------------------
Parameters  : value       lower 90%   higher 90%
Photon index: 1.31130     ( -0.518873   0.495123 )
Norm@50keV  : 4.77831E-04    ( -0.00012434   0.00012331 )
------------------------------------------------------------
#Fit statistic : Chi-Squared =          59.36 using 59 PHA bins.
# Reduced chi-squared =          1.041 for     57 degrees of freedom
# Null hypothesis probability =   3.895380e-01

Photon flux (15-150 keV)    in 80.77 sec: 5.71261E-02 ( -0.0150066  0.0150376 ) ph/cm2/s
Energy fluence (15-150 keV)             : 3.80343e-07 ( -1.11247e-07  1.14132e-07 ) ergs/cm2
Cutoff power-law model

Time interval is from    0.408 sec. to   81.176 sec.
Spectral model in the cutoff power-law:
------------------------------------------------------------
Parameters  : value       lower 90%   higher 90%
Photon index: 1.32983     ( -0.650855   0.481424 )
Epeak [keV] : 9999.36      ( -9999.36 -9999.36 )
Norm@50keV  : 4.75610E-04    ( -0.000123567   0.00116803 )
------------------------------------------------------------
#Fit statistic : Chi-Squared =          59.38 using 59 PHA bins.
# Reduced chi-squared =          1.060 for     56 degrees of freedom
# Null hypothesis probability =   3.536285e-01

Photon flux (15-150 keV)    in 80.77 sec: 5.73496E-02 ( -0.0152209  0.014841 ) ph/cm2/s
Energy fluence (15-150 keV)             : 3.79517e-07 ( -1.10426e-07  1.11173e-07 ) ergs/cm2
Band function

Time interval is from    0.408 sec. to   81.176 sec.

Spectral model in the Band function:
------------------------------------------------------------
Parameters  : value       lower 90%   higher 90%
alpha       : 4.13093   ( 0.930744   0.930744 )
beta        : -1.36154    ( 1.32351   0.528707 )
Epeak [keV] : 23.5914      ( -66.7726 -66.7726 )
Norm@50keV   : 13.2753    ( -13.2765   42303.9 )
------------------------------------------------------------
#Fit statistic : Chi-Squared =          59.26 using 59 PHA bins.
# Reduced chi-squared =          1.077 for     55 degrees of freedom
# Null hypothesis probability =   3.229110e-01

Photon flux (15-150 keV)    in 80.77 sec:  (    ) ph/cm2/s
Energy fluence (15-150 keV)             : 0 ( 0  0 ) ergs/cm2
Single BB

Spectral model blackbody:
------------------------------------------------------------
Parameters  : value    Lower 90%  Upper 90%
kT [keV]    : 16.2401  (-6.85144  16.3592)
R^2/D10^2   : 4.74837E-03  (-0.00455433   0.0263615)
(R is the radius in km and D10 is the distance to the source in units of 10 kpc)
------------------------------------------------------------
#Fit statistic : Chi-Squared =          66.98 using 59 PHA bins.
# Reduced chi-squared =          1.175 for     57 degrees of freedom
# Null hypothesis probability =   1.718554e-01

Energy  Fluence     90% Error
[keV]   [erg/cm2]   [erg/cm2]
15- 25  2.084e-08   1.370e-08
25- 50  8.882e-08   5.258e-08
50-150  1.647e-07   1.083e-07
15-150  2.743e-07   1.762e-07
Thermal bremsstrahlung (OTTB)

Spectral model: thermal bremsstrahlung
------------------------------------------------------------
Parameters  : value         Lower 90%    Upper 90%
kT [keV]    : 199.362       (-111.497      -199.363)
Norm        : 0.234415       (-0.0609904     0.0609895)
------------------------------------------------------------
#Fit statistic : Chi-Squared =          60.53 using 59 PHA bins.
# Reduced chi-squared =          1.062 for     57 degrees of freedom
# Null hypothesis probability =   3.496929e-01

Energy  Fluence     90% Error
[keV]   [erg/cm2]   [erg/cm2]
15- 25  4.715e-08   2.869e-08
25- 50  9.070e-08   5.468e-08
50-150  1.989e-07   1.201e-07
15-150  3.367e-07   1.998e-07
Double BB

Spectral model: bbodyrad<1> + bbodyrad<2>
------------------------------------------------------------
Parameters  : value         Lower 90%    Upper 90%
kT1 [keV]   : 7.45955        (-3.08425      2.96607)
R1^2/D10^2  : 5.73119E-02        (-0.0470825      0.366917)
kT2 [keV]   : 62.4505        (-58.0747      -62.4505)
R2^2/D10^2  : 8.44743E-05    (-7.25731e-05   0.000855189)
------------------------------------------------------------
#Fit statistic : Chi-Squared =          57.62 using 59 PHA bins.
# Reduced chi-squared =          1.048 for     55 degrees of freedom
# Null hypothesis probability =   3.784142e-01

Energy  Fluence     90% Error
[keV]   [erg/cm2]   [erg/cm2]
15- 25  4.643e-08   2.805e-08
25- 50  8.632e-08   5.266e-08
50-150  2.864e-07   1.575e-07
15-150  4.191e-07   2.140e-07
Peak spectrum fit
Power-law model

Time interval is from    1.924 sec. to    2.924 sec.

Spectral model in power-law:
------------------------------------------------------------
Parameters  : value       lower 90%   higher 90%
Photon index: 1.18024     ( -0.496432   0.459058 )
Norm@50keV  : 4.65709E-03    ( -0.00115817   0.00115718 )
------------------------------------------------------------
#Fit statistic : Chi-Squared =          39.53 using 59 PHA bins.
# Reduced chi-squared =         0.6935 for     57 degrees of freedom
# Null hypothesis probability =   9.622621e-01

Photon flux (15-150 keV)    in 1 sec: 0.545170 ( -0.140492  0.140971 ) ph/cm2/s
Energy fluence (15-150 keV)             : 4.75161e-08 ( -1.30501e-08  1.32773e-08 ) ergs/cm2
Cutoff power-law model

Time interval is from    1.924 sec. to    2.924 sec.
Spectral model in the cutoff power-law:
------------------------------------------------------------
Parameters  : value       lower 90%   higher 90%
Photon index: 2.77687     (     )
Epeak [keV] : 229.822      (   )
Norm@50keV  : 5.46734E-04    (     )
------------------------------------------------------------
#Fit statistic : Chi-Squared =          39.36 using 59 PHA bins.
# Reduced chi-squared =         0.7029 for     56 degrees of freedom
# Null hypothesis probability =   9.551550e-01

Photon flux (15-150 keV)    in 1 sec: 0.547391 ( -0.142488  0.138808 ) ph/cm2/s
Energy fluence (15-150 keV)             : 4.74882e-08 ( -7.0063e-09  1.30033e-08 ) ergs/cm2
Band function

Time interval is from    1.924 sec. to    2.924 sec.

Spectral model in the Band function:
------------------------------------------------------------
Parameters  : value       lower 90%   higher 90%
alpha       : 4.94403   ( -4.94403   -4.94403 )
beta        : -1.24545    ( -0.548722   0.52624 )
Epeak [keV] : 23.9946      ( -23.9946 63.1594 )
Norm@50keV   : 442.403    ( -109.468   2.11801e+06 )
------------------------------------------------------------
#Fit statistic : Chi-Squared =          39.18 using 59 PHA bins.
# Reduced chi-squared =         0.7123 for     55 degrees of freedom
# Null hypothesis probability =   9.472263e-01

Photon flux (15-150 keV)    in 1 sec:  (    ) ph/cm2/s
Energy fluence (15-150 keV)             : 0 ( 0  0 ) ergs/cm2
Single BB

Spectral model blackbody:
------------------------------------------------------------
Parameters  : value    Lower 90%  Upper 90%
kT [keV]    : 16.4647  (-6.08004  15.7375)
R^2/D10^2   : 4.51001E-02  (-0.0385353   0.171057)
(R is the radius in km and D10 is the distance to the source in units of 10 kpc)
------------------------------------------------------------
#Fit statistic : Chi-Squared =          46.60 using 59 PHA bins.
# Reduced chi-squared =         0.8176 for     57 degrees of freedom
# Null hypothesis probability =   8.357011e-01

Energy  Fluence     90% Error
[keV]   [erg/cm2]   [erg/cm2]
15- 25  2.511e-09   1.547e-09
25- 50  1.082e-08   5.886e-09
50-150  2.073e-08   1.338e-08
15-150  3.406e-08   2.046e-08
Thermal bremsstrahlung (OTTB)

Spectral model: thermal bremsstrahlung
------------------------------------------------------------
Parameters  : value         Lower 90%    Upper 90%
kT [keV]    : 199.363       (-95.8168      -199.363)
Norm        : 2.25460       (-0.574453     0.574475)
------------------------------------------------------------
#Fit statistic : Chi-Squared =          41.69 using 59 PHA bins.
# Reduced chi-squared =         0.7314 for     57 degrees of freedom
# Null hypothesis probability =   9.361043e-01

Energy  Fluence     90% Error
[keV]   [erg/cm2]   [erg/cm2]
15- 25  5.614e-09   3.380e-09
25- 50  1.080e-08   6.525e-09
50-150  2.368e-08   1.430e-08
15-150  4.010e-08   2.384e-08
Double BB

------------------------------------------------------------
Parameters  : value         Lower 90%    Upper 90%
kT1 [keV]   : 9.38167        (-2.95671      4.38581)
R1^2/D10^2  : 0.253283        (-0.211624      0.850823)
kT2 [keV]   : 200.000        (-166.56      -200)
R2^2/D10^2  : 1.11952E-04    (-4.86313e-05   0.000568247)
------------------------------------------------------------
#Fit statistic : Chi-Squared =          36.76 using 59 PHA bins.
#Fit statistic : Chi-Squared =          36.62 using 59 PHA bins.
# Reduced chi-squared =         0.6683 for     55 degrees of freedom
# Reduced chi-squared =         0.6658 for     55 degrees of freedom
# Null hypothesis probability =   9.722602e-01
# Null hypothesis probability =   9.733350e-01

Energy  Fluence     90% Error
[keV]   [erg/cm2]   [erg/cm2]
15- 25  4.649e-09   2.855e-09
25- 50  1.108e-08   6.855e-09
50-150  3.479e-08   2.210e-08
15-150  5.052e-08   2.678e-08
Pre-slew spectrum (Pre-slew PHA with pre-slew DRM)
Power-law model

Spectral model in power-law:
------------------------------------------------------------
Parameters  : value       lower 90%   higher 90%
Photon index: 1.28424     ( -0.540401   0.520203 )
Norm@50keV  : 5.78047E-04    ( -0.000154564   0.000153968 )
------------------------------------------------------------
#Fit statistic : Chi-Squared =          49.62 using 59 PHA bins.
# Reduced chi-squared =         0.8706 for     57 degrees of freedom
# Null hypothesis probability =   7.454133e-01

Photon flux (15-150 keV)    in 54.12 sec: 6.87666E-02 ( -0.0188063  0.0188577 ) ph/cm2/s
Energy fluence (15-150 keV)             : 3.1035e-07 ( -9.3363e-08  9.54579e-08 ) ergs/cm2
Cutoff power-law model

Spectral model in the cutoff power-law:
------------------------------------------------------------
Parameters  : value       lower 90%   higher 90%
Photon index: 1.29591     ( -0.55879   0.509539 )
Epeak [keV] : 9999.36      ( -9999.36 -9999.36 )
Norm@50keV  : 5.76860E-04    ( -0.000155167   0.00161678 )
------------------------------------------------------------
#Fit statistic : Chi-Squared =          49.63 using 59 PHA bins.
# Reduced chi-squared =         0.8863 for     56 degrees of freedom
# Null hypothesis probability =   7.131526e-01

Photon flux (15-150 keV)    in 54.12 sec: 6.90512E-02 ( -0.0190577  0.0185875 ) ph/cm2/s
Energy fluence (15-150 keV)             : 3.10261e-07 ( -9.3239e-08  9.33841e-08 ) ergs/cm2
Band function

Spectral model in the Band function:
------------------------------------------------------------
Parameters  : value       lower 90%   higher 90%
alpha       : -0.995886   ( 0.996839   0.996839 )
beta        : -1.28453    ( 1.28424   0.540286 )
Epeak [keV] : 56.5733      ( -56.1208 -56.1208 )
Norm@50keV   : 1.06695E-03    ( -0.000642803   0.0984223 )
------------------------------------------------------------
#Fit statistic : Chi-Squared =          49.62 using 59 PHA bins.
# Reduced chi-squared =         0.9022 for     55 degrees of freedom
# Null hypothesis probability =   6.795356e-01

Photon flux (15-150 keV)    in 54.12 sec:  (    ) ph/cm2/s
Energy fluence (15-150 keV)             : 0 ( 0  0 ) ergs/cm2
S(25-50 keV) vs. S(50-100 keV) plot

S(25-50 keV)  = 8.52e-08
S(50-100 keV) = 1.37e-07
T90 vs. Hardness ratio plot

T90                                   = 77.9520000219345 sec.
Hardness ratio (energy fluence ratio) = 1.60798
Color vs. Color plot

Count Ratio  (25-50 keV) / (15-25 keV) = 1.04994
Count Ratio (50-100 keV) / (15-25 keV) = 0.847935
Mask shadow pattern

IMX = 0.334132621021, IMY = 0.274198475222
TIME vs. PHA plot around the trigger time

Blue+Cyan dotted lines: Time interval of the scaled map
From 0.000000 to 5.504000
TIME vs. DetID plot around the trigger time

Blue+Cyan dotted lines: Time interval of the scaled map
From 0.000000 to 5.504000
100 us light curve (15-350 keV)

Blue+Cyan dotted lines: Time interval of the scaled map
From 0.000000 to 5.504000
Spacecraft aspect plot

Bright source in the pre-burst/pre-slew/post-slew images
Pre-burst image of 15-350 keV band
Time interval of the image:
-239.976000 0.408000

# RAcent  DECcent POSerr Theta    Phi  PeakCts   SNR AngSep     Name
#  [deg]    [deg]    ['] [deg]  [deg]                   [']
 83.6448  22.0147    0.3  32.8  179.4   9.7479  39.6    0.6	Crab
135.5127 -40.5983    2.2  50.8  -36.2   4.1535   5.3    2.7	Vela X-1
 96.2037   1.5188    3.1  13.8 -140.2   0.6907   3.8 ------	UNKNOWN
135.9203 -27.3662    3.2  47.1  -53.1   3.4014   3.7 ------	UNKNOWN
Pre-slew background subtracted image of 15-350 keV band
Time interval of the image:
0.408000 54.524600

# RAcent  DECcent POSerr Theta    Phi  PeakCts   SNR AngSep     Name
#  [deg]    [deg]    ['] [deg]  [deg]                   [']
 83.5060  21.9544    8.2  32.8  179.2   0.1361   1.4    7.9	Crab
135.6260 -40.3996    6.3  50.8  -36.5   0.5570   1.8   10.3	Vela X-1
 50.7460  14.5348    2.6  45.5  131.4   1.5700   4.4 ------	UNKNOWN
 52.0311 -47.2824    2.1  48.4   42.1   1.9772   5.5 ------	UNKNOWN
 70.0226  31.2833    2.6  45.5  165.8   0.8001   4.5 ------	UNKNOWN
108.3298 -25.1560    1.9  23.4  -39.3   0.5489   6.0 ------	UNKNOWN
Post-slew image of 15-350 keV band
Time interval of the image:
101.524580 962.066100

# RAcent  DECcent POSerr Theta    Phi  PeakCts   SNR AngSep     Name
#  [deg]    [deg]    ['] [deg]  [deg]                   [']
 83.6390  22.0182    0.6  52.8  177.8  32.6171  19.0    0.4	Crab
135.5204 -40.5576    0.3  27.4  -22.2  16.6772  34.4    0.4	Vela X-1
170.3666 -60.6540   12.6  54.7   -5.2  -1.2820  -0.9    2.4	Cen X-3
 62.8100 -28.1591    3.7  40.5  102.1   6.0871   3.2 ------	UNKNOWN
 72.4185 -41.0040    2.5  33.7   79.7   4.3278   4.6 ------	UNKNOWN
 78.7116  22.8248    2.8  55.9  173.5  11.4031   4.2 ------	UNKNOWN
173.6351 -63.7362    2.9  56.8   -1.9   9.9465   4.0 ------	UNKNOWN
139.0214 -53.2853    2.7  36.4   -4.2   3.2061   4.3 ------	UNKNOWN
176.6833 -57.4672    2.7  57.5   -9.5   9.2828   4.3 ------	UNKNOWN
100.8424  26.8958    3.6  52.5 -161.6   4.8308   3.2 ------	UNKNOWN
161.0139 -42.5269    3.5  46.3  -27.4   2.9311   3.3 ------	UNKNOWN
165.7237 -40.8739    2.2  49.7  -29.8   6.1525   5.2 ------	UNKNOWN
160.3025 -23.9089    3.2  47.0  -53.1   9.1808   3.7 ------	UNKNOWN
Plot creation:
Thu Oct  8 20:29:23 EDT 2015