Special notes of this burst
Image
Pre-slew 15.0-350.0 keV image (Event data)

#   RAcent    DECcent   POSerr    Theta     Phi              Peak Cts       SNR   Name
  126.5818    25.9413   0.0264    48.1543   -11.2567         1.3361193      7.275 TRIG_00362818

Foreground time interval of the image:
 -0.040  68.520 (delta_t =  68.560 [sec])
Background time interval of the image:
-228.115  -0.040 (delta_t = 228.075 [sec])
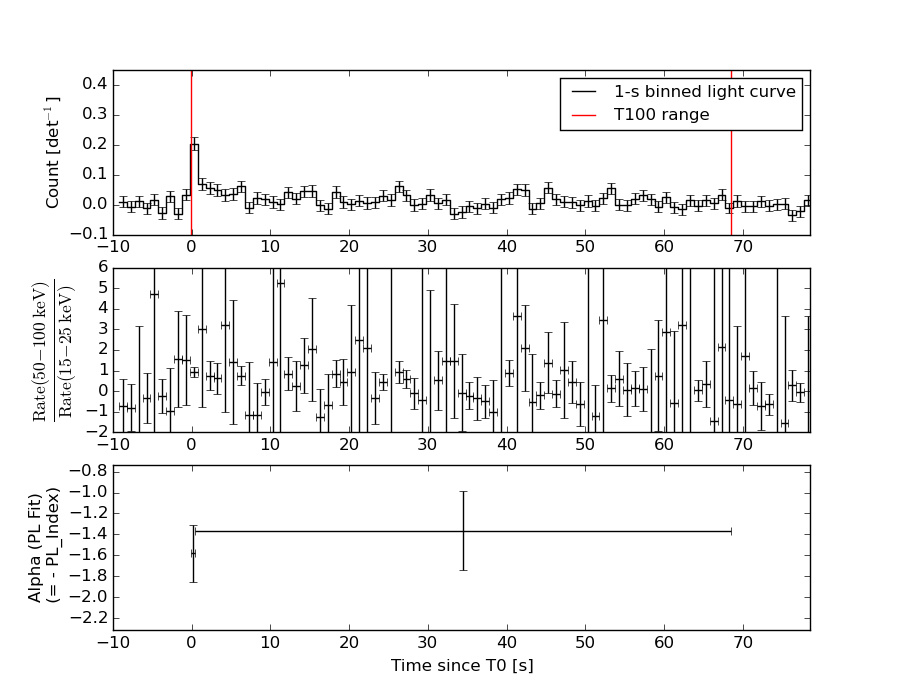
Lightcurves
Notes:
- 1) The mask-weighted light curves are using the flight position.
- 2) Multiple plots of different time binning/intervals are shown to cover all scenarios of short/long GRBs, rate/image triggers, and real/false positives.
- 3) For all the mask-weighted lightcurves, the y-axis units are counts/sec/det where a det is 0.4 x 0.4 = 0.16 sq cm.
- 4) The verticle lines correspond to following: green dotted lines are T50 interval, black dotted lines are T90 interval, blue solid line(s) is a spacecraft slew start time, and orange solid line(s) is a spacecraft slew end time.
- 5) Time of each bin is in the middle of the bin.
1 s binning
From T0-310 s to T0+310 s

From T100_start - 20 s to T100_end + 30 s

Full time interval

64 ms binning
Full time interval

From T100_start to T100_end

From T0-5 sec to T0+5 sec

16 ms binning
From T100_start-5 s to T100_start+5 s

Blue+Cyan dotted lines: Time interval of the scaled map
From 0.000000 to 0.256000
8 ms binning
From T100_start-3 s to T100_start+3 s

Blue+Cyan dotted lines: Time interval of the scaled map
From 0.000000 to 0.256000
2 ms binning
From T100_start-1 s to T100_start+1 s

Blue+Cyan dotted lines: Time interval of the scaled map
From 0.000000 to 0.256000
SN=5 or 10 sec. binning (whichever binning is satisfied first)

SN=5 or 10 sec. binning (T < 200 sec)

Quad-rate summed light curves (from T0-300s to T0+1000s)

Spectral Evolution
Spectra
Notes:
- 1) The fitting includes the systematic errors.
- 2) When the burst includes telescope slew time periods, the fitting uses an average response file made from multiple 5-s response files through out the slew time plus single time preiod for the non-slew times, and weighted by the total counts in the corresponding time period using addrmf. An average response file is needed becuase a spectral fit using the pre-slew DRM will introduce some errors in both a spectral shape and a normalization if the PHA file contains a lot of the slew/post-slew time interval.
- 3) For fits to more complicated models (e.g. a power-law over a cutoff power-law), the BAT team has decided to require a chi-square improvement of more than 6 for each extra dof.
Time averaged spectrum fit using the average DRM
Power-law model

Time interval is from   -0.040 sec. to   68.520 sec.

Spectral model in power-law:
------------------------------------------------------------
Parameters  : value       lower 90%   higher 90%
Photon index: 1.38111     ( -0.33223   0.326937 )
Norm@50keV  : 1.41099E-03    ( -0.000258271   0.000258265 )
------------------------------------------------------------
#Fit statistic : Chi-Squared =          53.57 using 59 PHA bins.
# Reduced chi-squared =         0.9398 for     57 degrees of freedom
# Null hypothesis probability =   6.046438e-01

Photon flux (15-150 keV)    in 68.56 sec: 0.171110 ( -0.0335244  0.0337686 ) ph/cm2/s
Energy fluence (15-150 keV)             : 9.38429e-07 ( -1.82369e-07  1.83436e-07 ) ergs/cm2
Cutoff power-law model

Time interval is from   -0.040 sec. to   68.520 sec.
Spectral model in the cutoff power-law:
------------------------------------------------------------
Parameters  : value       lower 90%   higher 90%
Photon index: 1.37760     ( -1.29055   1.99077 )
Epeak [keV] : 9993.61      (   )
Norm@50keV  : 1.41632E-03    ( -0.000259336   0.0043943 )
------------------------------------------------------------
#Fit statistic : Chi-Squared =          53.57 using 59 PHA bins.
# Reduced chi-squared =         0.9566 for     56 degrees of freedom
# Null hypothesis probability =   5.675058e-01

Photon flux (15-150 keV)    in 68.56 sec: 0.170772 ( -0.034435  0.034018 ) ph/cm2/s
Energy fluence (15-150 keV)             : 9.40095e-07 ( -1.90515e-07  1.81506e-07 ) ergs/cm2
Band function

Time interval is from   -0.040 sec. to   68.520 sec.

Spectral model in the Band function:
------------------------------------------------------------
Parameters  : value       lower 90%   higher 90%
alpha       : 4.95410   ( -4.9541   -4.9541 )
beta        : -1.43087    ( -0.388626   0.357293 )
Epeak [keV] : 24.7051      ( -24.7051 9.13626 )
Norm@50keV   : 132.172    ( -24.1808   795608 )
------------------------------------------------------------
#Fit statistic : Chi-Squared =          53.49 using 59 PHA bins.
# Reduced chi-squared =         0.9726 for     55 degrees of freedom
# Null hypothesis probability =   5.324026e-01

Photon flux (15-150 keV)    in 68.56 sec:  (    ) ph/cm2/s
Energy fluence (15-150 keV)             : 0 ( 0  0 ) ergs/cm2
Single BB

Spectral model blackbody:
------------------------------------------------------------
Parameters  : value    Lower 90%  Upper 90%
kT [keV]    : 18.9208  (-4.06773  5.62285)
R^2/D10^2   : 8.90454E-03  (-0.00523137   0.0116081)
(R is the radius in km and D10 is the distance to the source in units of 10 kpc)
------------------------------------------------------------
#Fit statistic : Chi-Squared =          61.20 using 59 PHA bins.
# Reduced chi-squared =          1.074 for     57 degrees of freedom
# Null hypothesis probability =   3.278026e-01

Energy  Fluence     90% Error
[keV]   [erg/cm2]   [erg/cm2]
15- 25  4.302e-08   1.827e-08
25- 50  2.063e-07   6.945e-08
50-150  5.424e-07   1.985e-07
15-150  7.917e-07   2.918e-07
Thermal bremsstrahlung (OTTB)

Spectral model: thermal bremsstrahlung
------------------------------------------------------------
Parameters  : value         Lower 90%    Upper 90%
kT [keV]    : 200.000       (      )
Norm        : 0.716700       (-0.132237     0.132217)
------------------------------------------------------------
#Fit statistic : Chi-Squared =          54.77 using 59 PHA bins.
# Reduced chi-squared =         0.9609 for     57 degrees of freedom
# Null hypothesis probability =   5.591315e-01

Energy  Fluence     90% Error
[keV]   [erg/cm2]   [erg/cm2]
15- 25  1.224e-07   7.086e-08
25- 50  2.354e-07   1.359e-07
50-150  5.163e-07   2.996e-07
15-150  8.741e-07   4.899e-07
Double BB

Spectral model: bbodyrad<1> + bbodyrad<2>
------------------------------------------------------------
Parameters  : value         Lower 90%    Upper 90%
kT1 [keV]   : 4.91494        (-1.97977      3.64378)
R1^2/D10^2  : 0.654805        (-0.605241      2.93856)
kT2 [keV]   : 25.2841        (-6.7846      18.6967)
R2^2/D10^2  : 2.99189E-03    (-0.00252234   0.00590969)
------------------------------------------------------------
#Fit statistic : Chi-Squared =          52.87 using 59 PHA bins.
# Reduced chi-squared =         0.9612 for     55 degrees of freedom
# Null hypothesis probability =   5.566035e-01

Energy  Fluence     90% Error
[keV]   [erg/cm2]   [erg/cm2]
15- 25  1.245e-07   7.665e-08
25- 50  1.930e-07   1.020e-07
50-150  6.138e-07   3.651e-07
15-150  9.313e-07   4.497e-07
Peak spectrum fit
Power-law model

Time interval is from   -0.036 sec. to    0.964 sec.

Spectral model in power-law:
------------------------------------------------------------
Parameters  : value       lower 90%   higher 90%
Photon index: 1.40460     ( -0.280438   0.277919 )
Norm@50keV  : 1.57039E-02    ( -0.00250349   0.00249888 )
------------------------------------------------------------
#Fit statistic : Chi-Squared =          57.74 using 59 PHA bins.
# Reduced chi-squared =          1.013 for     57 degrees of freedom
# Null hypothesis probability =   4.476255e-01

Photon flux (15-150 keV)    in 1 sec: 1.91445 ( -0.320565  0.322326 ) ph/cm2/s
Energy fluence (15-150 keV)             : 1.516e-07 ( -2.59244e-08  2.60843e-08 ) ergs/cm2
Cutoff power-law model

Time interval is from   -0.036 sec. to    0.964 sec.
Spectral model in the cutoff power-law:
------------------------------------------------------------
Parameters  : value       lower 90%   higher 90%
Photon index: 1.40658     ( -1.01409   0.276291 )
Epeak [keV] : 9999.36      ( -9999.36 -9999.36 )
Norm@50keV  : 1.57405E-02    ( -0.00249609   0.0314495 )
------------------------------------------------------------
#Fit statistic : Chi-Squared =          57.75 using 59 PHA bins.
# Reduced chi-squared =          1.031 for     56 degrees of freedom
# Null hypothesis probability =   4.105479e-01

Photon flux (15-150 keV)    in 1 sec: 1.91647 ( -0.31979  0.31885 ) ph/cm2/s
Energy fluence (15-150 keV)             : 1.51475e-07 ( -2.5534e-08  2.6155e-08 ) ergs/cm2
Band function

Time interval is from   -0.036 sec. to    0.964 sec.

Spectral model in the Band function:
------------------------------------------------------------
Parameters  : value       lower 90%   higher 90%
alpha       : 5.00000   ( -4.96883   -4.96883 )
beta        : -1.46873    ( -0.324858   0.305054 )
Epeak [keV] : 24.1659      ( -24.1659 9.58963 )
Norm@50keV   : 1894.35    ( -299.857   7.80213e+06 )
------------------------------------------------------------
#Fit statistic : Chi-Squared =          56.94 using 59 PHA bins.
# Reduced chi-squared =          1.035 for     55 degrees of freedom
# Null hypothesis probability =   4.028418e-01

Photon flux (15-150 keV)    in 1 sec:  (    ) ph/cm2/s
Energy fluence (15-150 keV)             : 0 ( 0  0 ) ergs/cm2
Single BB

Spectral model blackbody:
------------------------------------------------------------
Parameters  : value    Lower 90%  Upper 90%
kT [keV]    : 16.8148  (-3.65977  4.76383)
R^2/D10^2   : 0.147025  (-0.0843998   0.197908)
(R is the radius in km and D10 is the distance to the source in units of 10 kpc)
------------------------------------------------------------
#Fit statistic : Chi-Squared =          70.45 using 59 PHA bins.
# Reduced chi-squared =          1.236 for     57 degrees of freedom
# Null hypothesis probability =   1.087116e-01

Energy  Fluence     90% Error
[keV]   [erg/cm2]   [erg/cm2]
15- 25  8.491e-09   3.082e-09
25- 50  3.724e-08   1.039e-08
50-150  7.491e-08   2.561e-08
15-150  1.206e-07   3.330e-08
Thermal bremsstrahlung (OTTB)

Spectral model: thermal bremsstrahlung
------------------------------------------------------------
Parameters  : value         Lower 90%    Upper 90%
kT [keV]    : 200.000       (      )
Norm        : 7.96968       (-1.27459     1.27444)
------------------------------------------------------------
#Fit statistic : Chi-Squared =          59.03 using 59 PHA bins.
# Reduced chi-squared =          1.036 for     57 degrees of freedom
# Null hypothesis probability =   4.012572e-01

Energy  Fluence     90% Error
[keV]   [erg/cm2]   [erg/cm2]
15- 25  1.985e-08   1.137e-08
25- 50  3.819e-08   2.200e-08
50-150  8.376e-08   4.720e-08
15-150  1.418e-07   7.955e-08
Double BB

Spectral model: bbodyrad<1> + bbodyrad<2>
------------------------------------------------------------
Parameters  : value         Lower 90%    Upper 90%
kT1 [keV]   : 8.28911        (-3.15237      2.26605)
R1^2/D10^2  : 1.24051        (-0.881823      1.61265)
kT2 [keV]   : 39.7393        (-18.7918      -41.2323)
R2^2/D10^2  : 6.61225E-03    (-0.00573873   0.0164407)
------------------------------------------------------------
#Fit statistic : Chi-Squared =          57.13 using 59 PHA bins.
# Reduced chi-squared =          1.039 for     55 degrees of freedom
# Null hypothesis probability =   3.959971e-01

Energy  Fluence     90% Error
[keV]   [erg/cm2]   [erg/cm2]
15- 25  1.716e-08   1.010e-08
25- 50  3.861e-08   2.144e-08
50-150  9.604e-08   5.395e-08
15-150  1.518e-07   7.995e-08
Pre-slew spectrum (Pre-slew PHA with pre-slew DRM)
Power-law model

Spectral model in power-law:
------------------------------------------------------------
Parameters  : value       lower 90%   higher 90%
Photon index: 1.38111     ( -0.33223   0.326937 )
Norm@50keV  : 1.41099E-03    ( -0.000258271   0.000258265 )
------------------------------------------------------------
#Fit statistic : Chi-Squared =          53.57 using 59 PHA bins.
# Reduced chi-squared =         0.9398 for     57 degrees of freedom
# Null hypothesis probability =   6.046438e-01

Photon flux (15-150 keV)    in 68.56 sec: 0.171110 ( -0.0335244  0.0337686 ) ph/cm2/s
Energy fluence (15-150 keV)             : 9.38429e-07 ( -1.82369e-07  1.83436e-07 ) ergs/cm2
Cutoff power-law model

Spectral model in the cutoff power-law:
------------------------------------------------------------
Parameters  : value       lower 90%   higher 90%
Photon index: 1.37760     ( -1.29055   1.99077 )
Epeak [keV] : 9993.61      (   )
Norm@50keV  : 1.41632E-03    ( -0.000259336   0.0043943 )
------------------------------------------------------------
#Fit statistic : Chi-Squared =          53.57 using 59 PHA bins.
# Reduced chi-squared =         0.9566 for     56 degrees of freedom
# Null hypothesis probability =   5.675058e-01

Photon flux (15-150 keV)    in 68.56 sec: 0.170772 ( -0.034435  0.034018 ) ph/cm2/s
Energy fluence (15-150 keV)             : 9.40095e-07 ( -1.90515e-07  1.81506e-07 ) ergs/cm2
Band function

Spectral model in the Band function:
------------------------------------------------------------
Parameters  : value       lower 90%   higher 90%
alpha       : 4.95410   ( -4.9541   -4.9541 )
beta        : -1.43087    ( -0.388626   0.357293 )
Epeak [keV] : 24.7051      ( -24.7051 9.13626 )
Norm@50keV   : 132.172    ( -24.1808   795608 )
------------------------------------------------------------
#Fit statistic : Chi-Squared =          53.49 using 59 PHA bins.
# Reduced chi-squared =         0.9726 for     55 degrees of freedom
# Null hypothesis probability =   5.324026e-01

Photon flux (15-150 keV)    in 68.56 sec:  (    ) ph/cm2/s
Energy fluence (15-150 keV)             : 0 ( 0  0 ) ergs/cm2
S(25-50 keV) vs. S(50-100 keV) plot

S(25-50 keV)  = 2.18e-07
S(50-100 keV) = 3.35e-07
T90 vs. Hardness ratio plot

T90                                   = 62.4480000138283 sec.
Hardness ratio (energy fluence ratio) = 1.5367
Color vs. Color plot

Count Ratio  (25-50 keV) / (15-25 keV) = 0.860809
Count Ratio (50-100 keV) / (15-25 keV) = 1.14012
Mask shadow pattern

IMX = 1.095162537365787E+00, IMY = 2.179748825138327E-01
TIME vs. PHA plot around the trigger time

Blue+Cyan dotted lines: Time interval of the scaled map
From 0.000000 to 0.256000
TIME vs. DetID plot around the trigger time

Blue+Cyan dotted lines: Time interval of the scaled map
From 0.000000 to 0.256000
100 us light curve (15-350 keV)

Blue+Cyan dotted lines: Time interval of the scaled map
From 0.000000 to 0.256000
Spacecraft aspect plot

Bright source in the pre-burst/pre-slew/post-slew images
Pre-burst image of 15-350 keV band
Time interval of the image:
-228.115410 -0.040000

# RAcent  DECcent POSerr Theta    Phi  PeakCts   SNR AngSep     Name
#  [deg]    [deg]    ['] [deg]  [deg]                   [']
254.5118  35.4727   13.0  53.2  164.8   0.8780   0.9    8.3	Her X-1
175.7302  65.8599    2.9  15.5   79.6   0.7134   4.0 ------	UNKNOWN
226.1916  50.5981    2.5  28.0  160.6   0.9284   4.6 ------	UNKNOWN
145.9188  42.1892    2.7  25.6   -7.1   0.8095   4.2 ------	UNKNOWN
Pre-slew background subtracted image of 15-350 keV band
Time interval of the image:
-0.040000 68.520000

# RAcent  DECcent POSerr Theta    Phi  PeakCts   SNR AngSep     Name
#  [deg]    [deg]    ['] [deg]  [deg]                   [']
254.5940  35.3256   47.3  53.4  164.9  -0.1001  -0.2    6.8	Her X-1
126.5818  25.9413    1.6  48.2  -11.3   1.3357   7.3 ------	UNKNOWN
Post-slew image of 15-350 keV band
Time interval of the image:
-336.216000 962.909800

# RAcent  DECcent POSerr Theta    Phi  PeakCts   SNR AngSep     Name
#  [deg]    [deg]    ['] [deg]  [deg]                   [']
254.5316  35.4380  124.4  53.3  164.8   0.3838   0.1    6.8	Her X-1
 93.6445  56.9637    3.3  48.6   41.7   8.6165   3.6 ------	UNKNOWN
219.5155  46.5745    2.3  25.3  172.4   3.2544   5.0 ------	UNKNOWN
114.7405  28.6317    2.7  53.8    0.7   8.5761   4.2 ------	UNKNOWN
123.3364  31.6095    2.7  46.3   -3.0   5.4919   4.3 ------	UNKNOWN
235.0452  18.8056    3.2  52.8 -165.1   7.4810   3.6 ------	UNKNOWN
122.8730  18.3583    3.8  56.1  -14.5   7.5602   3.1 ------	UNKNOWN
Plot creation:
Sun May 31 02:58:32 EDT 2015