Special notes of this burst
Image
Pre-slew 15.0-350.0 keV image (Event data)
#   RAcent    DECcent   POSerr    Theta     Phi              Peak Cts       SNR   Name
   46.3125   -38.9971   0.0049    40.0827   144.2779         6.6672451     39.106 TRIG_00370791

Foreground time interval of the image:
-21.612  10.365 (delta_t =  31.977 [sec])
Background time interval of the image:
-542.035 -442.376 (delta_t =  99.659 [sec])
-239.536 -21.612 (delta_t = 217.924 [sec])
Lightcurves
Notes:
- 1) The mask-weighted light curves are using the flight position.
- 2) Multiple plots of different time binning/intervals are shown to cover all scenarios of short/long GRBs, rate/image triggers, and real/false positives.
- 3) For all the mask-weighted lightcurves, the y-axis units are counts/sec/det where a det is 0.4 x 0.4 = 0.16 sq cm.
- 4) The verticle lines correspond to following: green dotted lines are T50 interval, black dotted lines are T90 interval, blue solid line(s) is a spacecraft slew start time, and orange solid line(s) is a spacecraft slew end time.
- 5) Time of each bin is in the middle of the bin.
1 s binning
From T0-310 s to T0+310 s
From T100_start - 20 s to T100_end + 30 s

Full time interval

64 ms binning
Full time interval
From T100_start to T100_end

From T0-5 sec to T0+5 sec
16 ms binning
From T100_start-5 s to T100_start+5 s

Blue+Cyan dotted lines: Time interval of the scaled map
From 0.000000 to 1.024000
8 ms binning
From T100_start-3 s to T100_start+3 s

Blue+Cyan dotted lines: Time interval of the scaled map
From 0.000000 to 1.024000
2 ms binning
From T100_start-1 s to T100_start+1 s
Blue+Cyan dotted lines: Time interval of the scaled map
From 0.000000 to 1.024000
SN=5 or 10 sec. binning (whichever binning is satisfied first)

SN=5 or 10 sec. binning (T < 200 sec)

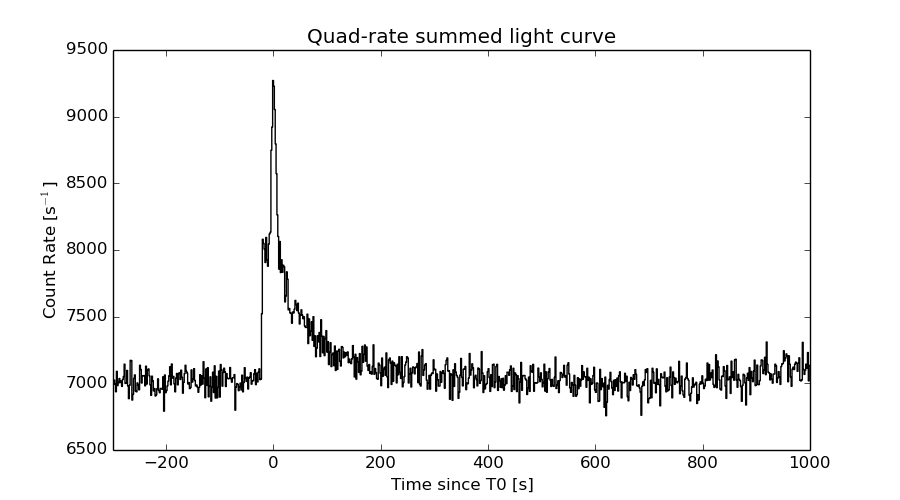
Quad-rate summed light curves (from T0-300s to T0+1000s)
Spectral Evolution

Spectra
Notes:
- 1) The fitting includes the systematic errors.
- 2) When the burst includes telescope slew time periods, the fitting uses an average response file made from multiple 5-s response files through out the slew time plus single time preiod for the non-slew times, and weighted by the total counts in the corresponding time period using addrmf. An average response file is needed becuase a spectral fit using the pre-slew DRM will introduce some errors in both a spectral shape and a normalization if the PHA file contains a lot of the slew/post-slew time interval.
- 3) For fits to more complicated models (e.g. a power-law over a cutoff power-law), the BAT team has decided to require a chi-square improvement of more than 6 for each extra dof.
Time averaged spectrum fit using the average DRM
Power-law model
Time interval is from  -21.612 sec. to  130.340 sec.

Spectral model in power-law:
------------------------------------------------------------
Parameters  : value       lower 90%   higher 90%
Photon index: 1.50520     (     )
Norm@50keV  : 5.23010E-03    (     )
------------------------------------------------------------
#Fit statistic : Chi-Squared =         121.11 using 59 PHA bins.
# Reduced chi-squared =         2.1248 for     57 degrees of freedom
# Null hypothesis probability =   1.601540e-06

Photon flux (15-150 keV)    in 152 sec: 0.653838 (    ) ph/cm2/s
Energy fluence (15-150 keV)             : 7.53516e-06 ( 0  0 ) ergs/cm2
Cutoff power-law model

Time interval is from  -21.612 sec. to  130.340 sec.
Spectral model in the cutoff power-law:
------------------------------------------------------------
Parameters  : value       lower 90%   higher 90%
Photon index: 0.516397     ( -0.239312   0.227511 )
Epeak [keV] : 80.5453      ( -6.34117 9.00894 )
Norm@50keV  : 1.51859E-02    ( -0.00322385   0.00433624 )
------------------------------------------------------------
#Fit statistic : Chi-Squared =          56.77 using 59 PHA bins.
# Reduced chi-squared =          1.014 for     56 degrees of freedom
# Null hypothesis probability =   4.461669e-01

Photon flux (15-150 keV)    in 152 sec: 0.617262 ( -0.020755  0.020825 ) ph/cm2/s
Energy fluence (15-150 keV)             : 7.12612e-06 ( -2.37743e-07  2.37789e-07 ) ergs/cm2
Band function

Time interval is from  -21.612 sec. to  130.340 sec.

Spectral model in the Band function:
------------------------------------------------------------
Parameters  : value       lower 90%   higher 90%
alpha       : -0.459450   ( -0.271862   0.320186 )
beta        : -2.47890    ( 2.47886   0.432536 )
Epeak [keV] : 77.9478      ( -9.29204 11.0031 )
Norm@50keV   : 1.63103E-02    ( -0.00419062   0.0074011 )
------------------------------------------------------------
#Fit statistic : Chi-Squared =          56.49 using 59 PHA bins.
# Reduced chi-squared =          1.027 for     55 degrees of freedom
# Null hypothesis probability =   4.189966e-01

Photon flux (15-150 keV)    in 152 sec: 0.615915 ( 6.38408  -0.020842 ) ph/cm2/s
Energy fluence (15-150 keV)             : 7.11477e-06 ( -7.11371e-06  -2.37181e-07 ) ergs/cm2
Single BB

Spectral model blackbody:
------------------------------------------------------------
Parameters  : value    Lower 90%  Upper 90%
kT [keV]    : 16.2761  (  )
R^2/D10^2   : 5.63952E-02  (   )
(R is the radius in km and D10 is the distance to the source in units of 10 kpc)
------------------------------------------------------------
#Fit statistic : Chi-Squared =         189.04 using 59 PHA bins.
# Reduced chi-squared =         3.3165 for     57 degrees of freedom
# Null hypothesis probability =   4.632609e-16

Energy  Fluence     90% Error
[keV]   [erg/cm2]   [erg/cm2]
15- 25  4.677e-07   2.470e-08
25- 50  1.997e-06   8.132e-08
50-150  3.721e-06   1.900e-07
15-150  6.185e-06   1.892e-07
Thermal bremsstrahlung (OTTB)

Spectral model: thermal bremsstrahlung
------------------------------------------------------------
Parameters  : value         Lower 90%    Upper 90%
kT [keV]    : 200.000       (      )
Norm        : 2.70041       (-0.0739633     0.0739625)
------------------------------------------------------------
#Fit statistic : Chi-Squared =          91.07 using 59 PHA bins.
# Reduced chi-squared =          1.598 for     57 degrees of freedom
# Null hypothesis probability =   2.779771e-03

Energy  Fluence     90% Error
[keV]   [erg/cm2]   [erg/cm2]
15- 25  1.022e-06   3.108e-08
25- 50  1.966e-06   5.928e-08
50-150  4.313e-06   1.224e-07
15-150  7.301e-06   2.037e-07
Double BB

Spectral model: bbodyrad<1> + bbodyrad<2>
------------------------------------------------------------
Parameters  : value         Lower 90%    Upper 90%
kT1 [keV]   : 7.62535        (-1.0707      1.22636)
R1^2/D10^2  : 0.383036        (-0.133342      0.2347)
kT2 [keV]   : 22.6118        (-1.88447      2.69888)
R2^2/D10^2  : 1.39369E-02    (-0.00529531   0.00614721)
------------------------------------------------------------
#Fit statistic : Chi-Squared =          57.02 using 59 PHA bins.
# Reduced chi-squared =          1.037 for     55 degrees of freedom
# Null hypothesis probability =   3.997036e-01

Energy  Fluence     90% Error
[keV]   [erg/cm2]   [erg/cm2]
15- 25  7.873e-07   9.280e-08
25- 50  2.011e-06   1.452e-07
50-150  4.275e-06   3.390e-07
15-150  7.073e-06   5.388e-07
Peak spectrum fit
Power-law model

Time interval is from   -1.312 sec. to   -0.312 sec.

Spectral model in power-law:
------------------------------------------------------------
Parameters  : value       lower 90%   higher 90%
Photon index: 1.21632     ( -0.168588   0.166149 )
Norm@50keV  : 2.68341E-02    ( -0.00266885   0.00266625 )
------------------------------------------------------------
#Fit statistic : Chi-Squared =          45.66 using 59 PHA bins.
# Reduced chi-squared =         0.8010 for     57 degrees of freedom
# Null hypothesis probability =   8.596015e-01

Photon flux (15-150 keV)    in 1 sec: 3.15719 ( -0.32794  0.328709 ) ph/cm2/s
Energy fluence (15-150 keV)             : 2.71005e-07 ( -2.88382e-08  2.89346e-08 ) ergs/cm2
Cutoff power-law model

Time interval is from   -1.312 sec. to   -0.312 sec.
Spectral model in the cutoff power-law:
------------------------------------------------------------
Parameters  : value       lower 90%   higher 90%
Photon index: 0.886271     ( -0.715846   0.413867 )
Epeak [keV] : 190.291      ( -190.291 -190.291 )
Norm@50keV  : 3.80579E-02    ( -0.0133007   0.0405113 )
------------------------------------------------------------
#Fit statistic : Chi-Squared =          44.87 using 59 PHA bins.
# Reduced chi-squared =         0.8013 for     56 degrees of freedom
# Null hypothesis probability =   8.568479e-01

Photon flux (15-150 keV)    in 1 sec: 3.12209 ( -0.33505  0.33532 ) ph/cm2/s
Energy fluence (15-150 keV)             : 2.68056e-07 ( -2.9907e-08  2.9721e-08 ) ergs/cm2
Band function

Time interval is from   -1.312 sec. to   -0.312 sec.

Spectral model in the Band function:
------------------------------------------------------------
Parameters  : value       lower 90%   higher 90%
alpha       : -0.888851   ( 0.62107   5.51206 )
beta        : -3.74168    ( 3.74168   13.3377 )
Epeak [keV] : 193.433      ( -193.433 -193.433 )
Norm@50keV   : 3.78893E-02    ( -0.00659937   0.0193537 )
------------------------------------------------------------
#Fit statistic : Chi-Squared =          44.88 using 59 PHA bins.
# Reduced chi-squared =         0.8159 for     55 degrees of freedom
# Null hypothesis probability =   8.332811e-01

Photon flux (15-150 keV)    in 1 sec:  (    ) ph/cm2/s
Energy fluence (15-150 keV)             : 0 ( 0  0 ) ergs/cm2
Single BB

Spectral model blackbody:
------------------------------------------------------------
Parameters  : value    Lower 90%  Upper 90%
kT [keV]    : 19.8628  (-2.45731  2.89102)
R^2/D10^2   : 0.150240  (-0.0546246   0.0831972)
(R is the radius in km and D10 is the distance to the source in units of 10 kpc)
------------------------------------------------------------
#Fit statistic : Chi-Squared =          64.38 using 59 PHA bins.
# Reduced chi-squared =          1.129 for     57 degrees of freedom
# Null hypothesis probability =   2.341130e-01

Energy  Fluence     90% Error
[keV]   [erg/cm2]   [erg/cm2]
15- 25  1.146e-08   2.312e-09
25- 50  5.681e-08   8.995e-09
50-150  1.660e-07   2.925e-08
15-150  2.343e-07   3.000e-08
Thermal bremsstrahlung (OTTB)

Spectral model: thermal bremsstrahlung
------------------------------------------------------------
Parameters  : value         Lower 90%    Upper 90%
kT [keV]    : 200.000       (      )
Norm        : 13.2383       (-1.34042     1.34028)
------------------------------------------------------------
#Fit statistic : Chi-Squared =          56.80 using 59 PHA bins.
# Reduced chi-squared =         0.9966 for     57 degrees of freedom
# Null hypothesis probability =   4.823687e-01

Energy  Fluence     90% Error
[keV]   [erg/cm2]   [erg/cm2]
15- 25  3.296e-08   1.339e-08
25- 50  6.340e-08   3.473e-08
50-150  1.390e-07   7.090e-08
15-150  2.354e-07   1.225e-07
Double BB

Spectral model: bbodyrad<1> + bbodyrad<2>
------------------------------------------------------------
Parameters  : value         Lower 90%    Upper 90%
kT1 [keV]   : 7.98016        (-2.66971      3.58219)
R1^2/D10^2  : 1.69308        (-1.11998      3.84274)
kT2 [keV]   : 30.9611        (-7.42867      21.8189)
R2^2/D10^2  : 2.88571E-02    (-0.0234125   0.0473443)
------------------------------------------------------------
#Fit statistic : Chi-Squared =          44.59 using 59 PHA bins.
# Reduced chi-squared =         0.8107 for     55 degrees of freedom
# Null hypothesis probability =   8.409657e-01

Energy  Fluence     90% Error
[keV]   [erg/cm2]   [erg/cm2]
15- 25  2.370e-08   1.271e-08
25- 50  6.043e-08   2.625e-08
50-150  1.860e-07   9.476e-08
15-150  2.702e-07   1.142e-07
Pre-slew spectrum (Pre-slew PHA with pre-slew DRM)
Power-law model
Spectral model in power-law:
------------------------------------------------------------
Parameters  : value       lower 90%   higher 90%
Photon index: 1.24764     (     )
Norm@50keV  : 1.47466E-02    (     )
------------------------------------------------------------
#Fit statistic : Chi-Squared =         126.99 using 59 PHA bins.
# Reduced chi-squared =         2.2279 for     57 degrees of freedom
# Null hypothesis probability =   3.014182e-07

Photon flux (15-150 keV)    in 31.98 sec: 1.74346 (    ) ph/cm2/s
Energy fluence (15-150 keV)             : 4.72268e-06 ( 0  0 ) ergs/cm2
Cutoff power-law model

Spectral model in the cutoff power-law:
------------------------------------------------------------
Parameters  : value       lower 90%   higher 90%
Photon index: 9.42502E-02     ( -0.27342   0.257758 )
Epeak [keV] : 92.3258      ( -7.88967 11.2273 )
Norm@50keV  : 4.94208E-02    ( -0.0113641   0.0157324 )
------------------------------------------------------------
#Fit statistic : Chi-Squared =          56.68 using 59 PHA bins.
# Reduced chi-squared =          1.012 for     56 degrees of freedom
# Null hypothesis probability =   4.494359e-01

Photon flux (15-150 keV)    in 31.98 sec: 1.66507 ( -0.0608  0.06094 ) ph/cm2/s
Energy fluence (15-150 keV)             : 4.50771e-06 ( -1.66072e-07  1.65592e-07 ) ergs/cm2
Band function

Spectral model in the Band function:
------------------------------------------------------------
Parameters  : value       lower 90%   higher 90%
alpha       : 0.229972   ( -0.403286   0.956154 )
beta        : -1.97651    ( -0.550172   0.307549 )
Epeak [keV] : 79.0194      ( -20.7845 14.4103 )
Norm@50keV   : 7.39730E-02    ( -0.0273861   0.200933 )
------------------------------------------------------------
#Fit statistic : Chi-Squared =          52.03 using 59 PHA bins.
# Reduced chi-squared =         0.9461 for     55 degrees of freedom
# Null hypothesis probability =   5.886868e-01

Photon flux (15-150 keV)    in 31.98 sec:  (    ) ph/cm2/s
Energy fluence (15-150 keV)             : 4.50995e-06 ( -4.50972e-06  -1.6329e-07 ) ergs/cm2
S(25-50 keV) vs. S(50-100 keV) plot

S(25-50 keV)  = 1.87e-06
S(50-100 keV) = 2.63e-06
T90 vs. Hardness ratio plot

T90                                   = 99.2839999198914 sec.
Hardness ratio (energy fluence ratio) = 1.40642
Color vs. Color plot
Count Ratio  (25-50 keV) / (15-25 keV) = 1.81393
Count Ratio (50-100 keV) / (15-25 keV) = 1.41836
Mask shadow pattern

IMX = -6.832285345832823E-01, IMY = -4.913492988858728E-01
TIME vs. PHA plot around the trigger time

Blue+Cyan dotted lines: Time interval of the scaled map
From 0.000000 to 1.024000
TIME vs. DetID plot around the trigger time

Blue+Cyan dotted lines: Time interval of the scaled map
From 0.000000 to 1.024000
100 us light curve (15-350 keV)

Blue+Cyan dotted lines: Time interval of the scaled map
From 0.000000 to 1.024000
Spacecraft aspect plot

Bright source in the pre-burst/pre-slew/post-slew images
Pre-burst image of 15-350 keV band
Time interval of the image:
-542.035390 -442.376000
-239.536000 -21.612000

# RAcent  DECcent POSerr Theta    Phi  PeakCts   SNR AngSep     Name
#  [deg]    [deg]    ['] [deg]  [deg]                   [']
264.9804 -44.3459   15.7  49.7  -40.0   0.7022   0.7   11.9	4U 1735-44
275.9520 -30.3359   10.1  57.5  -22.0   1.1134   1.1    2.3	H1820-303
285.0407 -24.9186   19.1  58.7  -10.6   0.7004   0.6    0.3	HT1900.1-2455
  0.7613 -27.7115    2.4  38.9   80.5   3.3344   4.8 ------	UNKNOWN
 60.5203 -41.6207    2.5  43.5  160.2   1.8562   4.6 ------	UNKNOWN
 91.3591 -38.4132    3.1  58.3 -175.6   4.3664   3.7 ------	UNKNOWN
248.6708 -57.4370    3.4  44.2  -61.5   3.6102   3.4 ------	UNKNOWN
Pre-slew background subtracted image of 15-350 keV band
Time interval of the image:
-21.612000 10.364600

# RAcent  DECcent POSerr Theta    Phi  PeakCts   SNR AngSep     Name
#  [deg]    [deg]    ['] [deg]  [deg]                   [']
264.7122 -44.3817   37.4  49.7  -40.2   0.0757   0.3    4.3	4U 1735-44
275.9877 -30.3570    3.0  57.5  -21.9   1.0239   3.9    3.3	H1820-303
285.1411 -25.0432    0.0  58.6  -10.6  -0.3663  -1.1    9.3	HT1900.1-2455
 46.3125 -38.9971    0.3  40.1  144.3   6.6672  39.1 ------	UNKNOWN
 63.4244 -42.4480    2.1  44.0  163.5   0.7993   5.5 ------	UNKNOWN
Post-slew image of 15-350 keV band
Time interval of the image:
77.164600 962.575700

# RAcent  DECcent POSerr Theta    Phi  PeakCts   SNR AngSep     Name
#  [deg]    [deg]    ['] [deg]  [deg]                   [']
 24.0827 -44.0175    2.8  17.3   30.8   1.4511   4.1 ------	UNKNOWN
 65.8489   4.5738    2.7  47.2  171.7   3.7543   4.2 ------	UNKNOWN
346.0628 -65.4431    2.7  42.9   -3.3   3.1123   4.3 ------	UNKNOWN
Plot creation:
Sun May 31 02:56:50 EDT 2015