Special notes of this burst
Image
Pre-slew 15.0-350.0 keV image (Event data)
#   RAcent    DECcent   POSerr    Theta     Phi              Peak Cts       SNR   Name
  343.9286   -70.9731   0.0121    27.1289   129.1528         0.3613818     15.805 TRIG_00370846

Foreground time interval of the image:
  0.024   2.440 (delta_t =   2.416 [sec])
Background time interval of the image:
-239.048   0.024 (delta_t = 239.072 [sec])
Lightcurves
Notes:
- 1) The mask-weighted light curves are using the flight position.
- 2) Multiple plots of different time binning/intervals are shown to cover all scenarios of short/long GRBs, rate/image triggers, and real/false positives.
- 3) For all the mask-weighted lightcurves, the y-axis units are counts/sec/det where a det is 0.4 x 0.4 = 0.16 sq cm.
- 4) The verticle lines correspond to following: green dotted lines are T50 interval, black dotted lines are T90 interval, blue solid line(s) is a spacecraft slew start time, and orange solid line(s) is a spacecraft slew end time.
- 5) Time of each bin is in the middle of the bin.
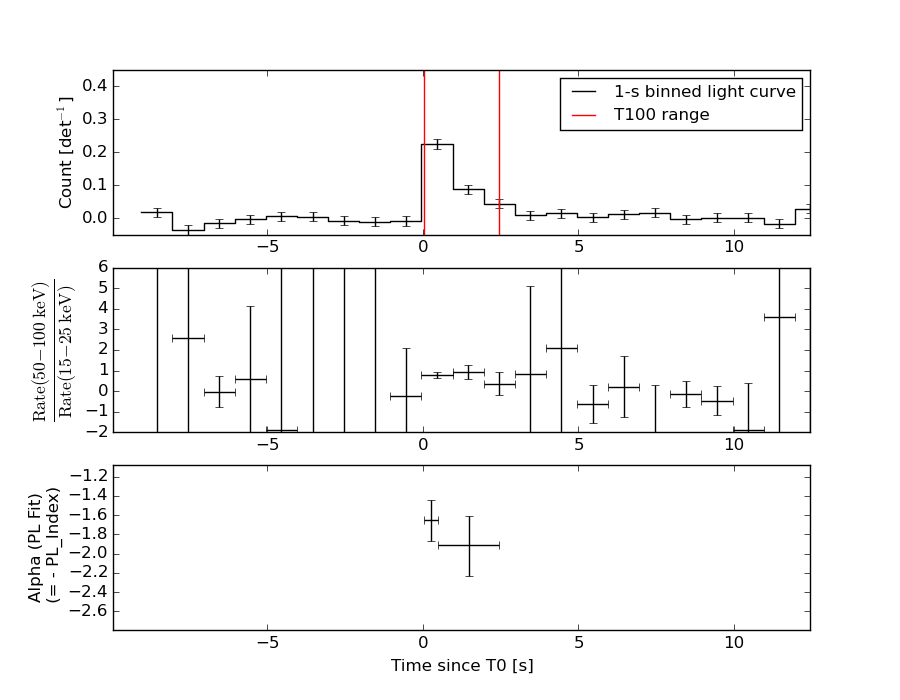
1 s binning
From T0-310 s to T0+310 s
From T100_start - 20 s to T100_end + 30 s
Full time interval
64 ms binning
Full time interval
From T100_start to T100_end
From T0-5 sec to T0+5 sec
16 ms binning
From T100_start-5 s to T100_start+5 s

Blue+Cyan dotted lines: Time interval of the scaled map
From 0.000000 to 0.512000
8 ms binning
From T100_start-3 s to T100_start+3 s
Blue+Cyan dotted lines: Time interval of the scaled map
From 0.000000 to 0.512000
2 ms binning
From T100_start-1 s to T100_start+1 s
Blue+Cyan dotted lines: Time interval of the scaled map
From 0.000000 to 0.512000
SN=5 or 10 sec. binning (whichever binning is satisfied first)
SN=5 or 10 sec. binning (T < 200 sec)
Quad-rate summed light curves (from T0-300s to T0+1000s)

Spectral Evolution
Spectra
Notes:
- 1) The fitting includes the systematic errors.
- 2) When the burst includes telescope slew time periods, the fitting uses an average response file made from multiple 5-s response files through out the slew time plus single time preiod for the non-slew times, and weighted by the total counts in the corresponding time period using addrmf. An average response file is needed becuase a spectral fit using the pre-slew DRM will introduce some errors in both a spectral shape and a normalization if the PHA file contains a lot of the slew/post-slew time interval.
- 3) For fits to more complicated models (e.g. a power-law over a cutoff power-law), the BAT team has decided to require a chi-square improvement of more than 6 for each extra dof.
Time averaged spectrum fit using the average DRM
Power-law model

Time interval is from    0.024 sec. to    2.440 sec.

Spectral model in power-law:
------------------------------------------------------------
Parameters  : value       lower 90%   higher 90%
Photon index: 1.79615     ( -0.193281   0.201623 )
Norm@50keV  : 8.89137E-03    ( -0.00113526   0.00111183 )
------------------------------------------------------------
#Fit statistic : Chi-Squared =          78.92 using 59 PHA bins.
# Reduced chi-squared =          1.384 for     57 degrees of freedom
# Null hypothesis probability =   2.891445e-02

Photon flux (15-150 keV)    in 2.416 sec: 1.22339 ( -0.130942  0.130971 ) ph/cm2/s
Energy fluence (15-150 keV)             : 1.97788e-07 ( -2.54709e-08  2.60203e-08 ) ergs/cm2
Cutoff power-law model

Time interval is from    0.024 sec. to    2.440 sec.
Spectral model in the cutoff power-law:
------------------------------------------------------------
Parameters  : value       lower 90%   higher 90%
Photon index: 1.30114     ( -0.883056   0.412317 )
Epeak [keV] : 61.9515      ( -19.1208 -61.9515 )
Norm@50keV  : 1.68108E-02    ( -0.0103738   0.0354839 )
------------------------------------------------------------
#Fit statistic : Chi-Squared =          77.60 using 59 PHA bins.
# Reduced chi-squared =          1.386 for     56 degrees of freedom
# Null hypothesis probability =   2.958503e-02

Photon flux (15-150 keV)    in 2.416 sec: 1.19838 ( -0.13586  0.13583 ) ph/cm2/s
Energy fluence (15-150 keV)             : 1.87988e-07 ( -2.86093e-08  2.9645e-08 ) ergs/cm2
Band function

Time interval is from    0.024 sec. to    2.440 sec.

Spectral model in the Band function:
------------------------------------------------------------
Parameters  : value       lower 90%   higher 90%
alpha       : -1.30075   ( -0.47884   1.0651 )
beta        : -10.0000    ( 10   1.77636e-15 )
Epeak [keV] : 61.9220      ( -20.3328 -61.922 )
Norm@50keV   : 1.68174E-02    ( -0.00818514   0.0354401 )
------------------------------------------------------------
#Fit statistic : Chi-Squared =          77.60 using 59 PHA bins.
# Reduced chi-squared =          1.411 for     55 degrees of freedom
# Null hypothesis probability =   2.402117e-02

Photon flux (15-150 keV)    in 2.416 sec: 1.19850 ( 5.8015  -0.13455 ) ph/cm2/s
Energy fluence (15-150 keV)             : 1.89684e-07 ( 0  0 ) ergs/cm2
Single BB
Spectral model blackbody:
------------------------------------------------------------
Parameters  : value    Lower 90%  Upper 90%
kT [keV]    : 11.0546  (-1.39216  1.65011)
R^2/D10^2   : 0.395627  (-0.159196   0.257087)
(R is the radius in km and D10 is the distance to the source in units of 10 kpc)
------------------------------------------------------------
#Fit statistic : Chi-Squared =          94.70 using 59 PHA bins.
# Reduced chi-squared =          1.661 for     57 degrees of freedom
# Null hypothesis probability =   1.264641e-03

Energy  Fluence     90% Error
[keV]   [erg/cm2]   [erg/cm2]
15- 25  2.443e-08   4.878e-09
25- 50  6.952e-08   1.020e-08
50-150  4.817e-08   1.283e-08
15-150  1.421e-07   2.092e-08
Thermal bremsstrahlung (OTTB)
Spectral model: thermal bremsstrahlung
------------------------------------------------------------
Parameters  : value         Lower 90%    Upper 90%
kT [keV]    : 97.4448       (-31.8919      64.8578)
Norm        : 5.44375       (-0.764615     0.948264)
------------------------------------------------------------
#Fit statistic : Chi-Squared =          77.61 using 59 PHA bins.
# Reduced chi-squared =          1.362 for     57 degrees of freedom
# Null hypothesis probability =   3.611090e-02

Energy  Fluence     90% Error
[keV]   [erg/cm2]   [erg/cm2]
15- 25  3.437e-08   5.206e-09
25- 50  5.912e-08   7.562e-09
50-150  9.440e-08   4.292e-08
15-150  1.879e-07   4.622e-08
Double BB

Spectral model: bbodyrad<1> + bbodyrad<2>
------------------------------------------------------------
Parameters  : value         Lower 90%    Upper 90%
kT1 [keV]   : 6.66009        (-2.39153      2.10085)
R1^2/D10^2  : 1.78011        (-1.05448      6.7648)
kT2 [keV]   : 22.7649        (-7.50123      16.6689)
R2^2/D10^2  : 1.92724E-02    (-0.0165039   0.07885)
------------------------------------------------------------
#Fit statistic : Chi-Squared =          77.86 using 59 PHA bins.
# Reduced chi-squared =          1.416 for     55 degrees of freedom
# Null hypothesis probability =   2.293316e-02

Energy  Fluence     90% Error
[keV]   [erg/cm2]   [erg/cm2]
15- 25  3.341e-08   1.609e-08
25- 50  5.972e-08   2.595e-08
50-150  9.676e-08   5.592e-08
15-150  1.899e-07   8.162e-08
Peak spectrum fit
Power-law model

Time interval is from   -0.008 sec. to    0.992 sec.

Spectral model in power-law:
------------------------------------------------------------
Parameters  : value       lower 90%   higher 90%
Photon index: 1.71279     ( -0.194838   0.202761 )
Norm@50keV  : 1.42068E-02    ( -0.0018813   0.00184872 )
------------------------------------------------------------
#Fit statistic : Chi-Squared =          72.46 using 59 PHA bins.
# Reduced chi-squared =          1.271 for     57 degrees of freedom
# Null hypothesis probability =   8.139668e-02

Photon flux (15-150 keV)    in 1 sec: 1.89533 ( -0.21676  0.216784 ) ph/cm2/s
Energy fluence (15-150 keV)             : 1.31411e-07 ( -1.80295e-08  1.84273e-08 ) ergs/cm2
Cutoff power-law model

Time interval is from   -0.008 sec. to    0.992 sec.
Spectral model in the cutoff power-law:
------------------------------------------------------------
Parameters  : value       lower 90%   higher 90%
Photon index: 0.670153     ( -1.16344   0.878345 )
Epeak [keV] : 55.1356      ( -12.0273 63.3437 )
Norm@50keV  : 5.49952E-02    ( -0.0549954   0.198594 )
------------------------------------------------------------
#Fit statistic : Chi-Squared =          68.20 using 59 PHA bins.
# Reduced chi-squared =          1.218 for     56 degrees of freedom
# Null hypothesis probability =   1.270433e-01

Photon flux (15-150 keV)    in 1 sec: 1.82674 ( -0.2238  0.22393 ) ph/cm2/s
Energy fluence (15-150 keV)             : 1.18533e-07 ( -1.96877e-08  2.1027e-08 ) ergs/cm2
Band function

Time interval is from   -0.008 sec. to    0.992 sec.

Spectral model in the Band function:
------------------------------------------------------------
Parameters  : value       lower 90%   higher 90%
alpha       : -0.670047   ( -0.679635   0.982199 )
beta        : -10.0000    ( 10   20 )
Epeak [keV] : 55.1248      ( -11.6507 63.2471 )
Norm@50keV   : 5.50023E-02    ( -0.0350504   0.199799 )
------------------------------------------------------------
#Fit statistic : Chi-Squared =          68.20 using 59 PHA bins.
# Reduced chi-squared =          1.240 for     55 degrees of freedom
# Null hypothesis probability =   1.088641e-01

Photon flux (15-150 keV)    in 1 sec: 1.84004 (    ) ph/cm2/s
Energy fluence (15-150 keV)             : 1.20941e-07 ( 0  0 ) ergs/cm2
Single BB
Spectral model blackbody:
------------------------------------------------------------
Parameters  : value    Lower 90%  Upper 90%
kT [keV]    : 11.4583  (-1.37418  1.61496)
R^2/D10^2   : 0.561829  (-0.216286   0.336164)
(R is the radius in km and D10 is the distance to the source in units of 10 kpc)
------------------------------------------------------------
#Fit statistic : Chi-Squared =          75.78 using 59 PHA bins.
# Reduced chi-squared =          1.329 for     57 degrees of freedom
# Null hypothesis probability =   4.877843e-02

Energy  Fluence     90% Error
[keV]   [erg/cm2]   [erg/cm2]
15- 25  1.552e-08   3.195e-09
25- 50  4.620e-08   6.850e-09
50-150  3.532e-08   9.505e-09
15-150  9.704e-08   1.467e-08
Thermal bremsstrahlung (OTTB)

Spectral model: thermal bremsstrahlung
------------------------------------------------------------
Parameters  : value         Lower 90%    Upper 90%
kT [keV]    : 112.432       (-39.9239      84.2816)
Norm        : 8.20983       (-1.12187     1.41651)
------------------------------------------------------------
#Fit statistic : Chi-Squared =          69.43 using 59 PHA bins.
# Reduced chi-squared =          1.218 for     57 degrees of freedom
# Null hypothesis probability =   1.249925e-01

Energy  Fluence     90% Error
[keV]   [erg/cm2]   [erg/cm2]
15- 25  2.143e-08   3.555e-09
25- 50  3.790e-08   6.550e-09
50-150  6.544e-08   3.479e-08
15-150  1.248e-07   4.056e-08
Double BB

Spectral model: bbodyrad<1> + bbodyrad<2>
------------------------------------------------------------
Parameters  : value         Lower 90%    Upper 90%
kT1 [keV]   : 8.32192        (-4.21148      2.40009)
R1^2/D10^2  : 1.31323        (-0.691205      8.70657)
kT2 [keV]   : 25.2793        (-21.0864      68.6251)
R2^2/D10^2  : 1.72027E-02    (-0.0171374   0.240049)
------------------------------------------------------------
#Fit statistic : Chi-Squared =          67.88 using 59 PHA bins.
# Reduced chi-squared =          1.234 for     55 degrees of freedom
# Null hypothesis probability =   1.139514e-01

Energy  Fluence     90% Error
[keV]   [erg/cm2]   [erg/cm2]
15- 25  1.881e-08   1.039e-08
25- 50  4.249e-08   2.236e-08
50-150  6.069e-08   3.533e-08
15-150  1.220e-07   6.005e-08
Pre-slew spectrum (Pre-slew PHA with pre-slew DRM)
Power-law model

Spectral model in power-law:
------------------------------------------------------------
Parameters  : value       lower 90%   higher 90%
Photon index: 1.79615     ( -0.193281   0.201623 )
Norm@50keV  : 8.89137E-03    ( -0.00113526   0.00111183 )
------------------------------------------------------------
#Fit statistic : Chi-Squared =          78.92 using 59 PHA bins.
# Reduced chi-squared =          1.384 for     57 degrees of freedom
# Null hypothesis probability =   2.891445e-02

Photon flux (15-150 keV)    in 2.416 sec: 1.22339 ( -0.130942  0.130971 ) ph/cm2/s
Energy fluence (15-150 keV)             : 1.97788e-07 ( -2.54709e-08  2.60203e-08 ) ergs/cm2
Cutoff power-law model

Spectral model in the cutoff power-law:
------------------------------------------------------------
Parameters  : value       lower 90%   higher 90%
Photon index: 1.30114     ( -0.883056   0.412317 )
Epeak [keV] : 61.9515      ( -19.1208 -61.9515 )
Norm@50keV  : 1.68108E-02    ( -0.0103738   0.0354839 )
------------------------------------------------------------
#Fit statistic : Chi-Squared =          77.60 using 59 PHA bins.
# Reduced chi-squared =          1.386 for     56 degrees of freedom
# Null hypothesis probability =   2.958503e-02

Photon flux (15-150 keV)    in 2.416 sec: 1.19838 ( -0.13586  0.13583 ) ph/cm2/s
Energy fluence (15-150 keV)             : 1.87988e-07 ( -2.86093e-08  2.9645e-08 ) ergs/cm2
Band function

Spectral model in the Band function:
------------------------------------------------------------
Parameters  : value       lower 90%   higher 90%
alpha       : -1.30075   ( -0.47884   1.0651 )
beta        : -10.0000    ( 10   3.55271e-15 )
Epeak [keV] : 61.9220      ( -20.3328 -61.922 )
Norm@50keV   : 1.68174E-02    ( -0.00818513   0.0354401 )
------------------------------------------------------------
#Fit statistic : Chi-Squared =          77.60 using 59 PHA bins.
# Reduced chi-squared =          1.411 for     55 degrees of freedom
# Null hypothesis probability =   2.402117e-02

Photon flux (15-150 keV)    in 2.416 sec: 1.19850 ( 5.8015  -0.13455 ) ph/cm2/s
Energy fluence (15-150 keV)             : 1.89684e-07 ( 0  0 ) ergs/cm2
S(25-50 keV) vs. S(50-100 keV) plot
S(25-50 keV)  = 5.56e-08
S(50-100 keV) = 6.41e-08
T90 vs. Hardness ratio plot
T90                                   = 2.1599999666214 sec.
Hardness ratio (energy fluence ratio) = 1.15288
Color vs. Color plot
Count Ratio  (25-50 keV) / (15-25 keV) = 1.37651
Count Ratio (50-100 keV) / (15-25 keV) = 0.789745
Mask shadow pattern

IMX = -3.235003087383637E-01, IMY = -3.973183775783828E-01
TIME vs. PHA plot around the trigger time

Blue+Cyan dotted lines: Time interval of the scaled map
From 0.000000 to 0.512000
TIME vs. DetID plot around the trigger time
Blue+Cyan dotted lines: Time interval of the scaled map
From 0.000000 to 0.512000
100 us light curve (15-350 keV)
Blue+Cyan dotted lines: Time interval of the scaled map
From 0.000000 to 0.512000
Spacecraft aspect plot

Bright source in the pre-burst/pre-slew/post-slew images
Pre-burst image of 15-350 keV band
Time interval of the image:
-239.048000 0.024000

# RAcent  DECcent POSerr Theta    Phi  PeakCts   SNR AngSep     Name
#  [deg]    [deg]    ['] [deg]  [deg]                   [']
170.0261 -60.6619  347.9  37.5 -132.5  -0.0124  -0.0    8.8	Cen X-3
186.6843 -62.7498  158.4  30.6 -124.9  -0.0212  -0.1    1.4	GX 301-2
244.9663 -15.6435    0.7  52.7  -27.8   9.9837  16.2    0.8	Sco X-1
255.9619 -37.8166    0.8  29.4  -17.0   2.9420  14.6    2.0	4U 1700-377
256.3477 -36.4348    2.3  30.8  -16.2   1.0770   5.0    4.3	GX 349+2
263.1413 -24.6886  229.2  42.3   -5.5  -0.0159  -0.1    8.0	GX 1+4
264.5620 -44.3310    3.5  22.7   -2.8   0.6360   3.3   10.5	4U 1735-44
270.2364 -25.0774    5.3  42.2    4.1   0.7877   2.2    2.6	GX 5-1
270.2693 -25.6901    3.1  41.6    4.2   1.3311   3.7    3.6	GRS 1758-258
274.0860 -14.0437    5.1  53.5    7.7   1.7223   2.3    4.7	GX 17+2
275.9297 -30.4008    3.5  37.4   12.8   0.9564   3.3    2.0	H1820-303
285.1578 -24.8875    9.4  44.3   23.6   0.5913   1.2    6.9	HT1900.1-2455
262.9255 -33.8038    9.6  33.2   -5.8  -0.2949  -1.2    3.7	GX 354-0
 52.7207 -59.0148    3.4  52.0  154.9   3.6910   3.4 ------	UNKNOWN
255.2339 -41.6557    2.5  25.7  -19.1   0.9111   4.7 ------	UNKNOWN
Pre-slew background subtracted image of 15-350 keV band
Time interval of the image:
0.024000 2.440000

# RAcent  DECcent POSerr Theta    Phi  PeakCts   SNR AngSep     Name
#  [deg]    [deg]    ['] [deg]  [deg]                   [']
170.4330 -60.6139    3.8  37.4 -132.2  -0.0927  -3.1    3.5	Cen X-3
186.3544 -62.7589    5.6  30.7 -125.1  -0.0493  -2.0    8.3	GX 301-2
244.8666 -15.6764    9.0  52.7  -27.9   0.0750   1.3    6.9	Sco X-1
255.8016 -37.8821   10.9  29.4  -17.3   0.0199   1.1    9.1	4U 1700-377
256.4345 -36.4432  211.1  30.8  -16.1   0.0011   0.1    1.2	GX 349+2
262.9957 -24.7507 2138.7  42.2   -5.7  -0.0001  -0.0    0.8	GX 1+4
264.7978 -44.6032    6.6  22.4   -2.3   0.0316   1.7    9.5	4U 1735-44
270.3714 -24.9954  101.1  42.3    4.2   0.0032   0.1    6.9	GX 5-1
270.3961 -25.7414    7.7  41.5    4.3  -0.0409  -1.5    5.1	GRS 1758-258
274.0209 -13.9818   16.8  53.5    7.6  -0.0484  -0.7    3.4	GX 17+2
275.9998 -30.2880    4.5  37.5   12.9   0.0647   2.6    6.1	H1820-303
285.0010 -25.0680    5.6  44.1   23.4  -0.0821  -2.1    9.1	HT1900.1-2455
262.9503 -33.7980    6.3  33.2   -5.8   0.0379   1.8    2.9	GX 354-0
347.9556 -53.3741    2.3  40.7  108.2   0.3807   5.0 ------	UNKNOWN
343.9288 -70.9732    0.7  27.1  129.2   0.3613  15.8 ------	UNKNOWN
 58.6992 -63.4265    2.6  48.4  159.9   0.2194   4.4 ------	UNKNOWN
280.8838 -26.2075    2.0  42.3   18.5   0.1882   5.9 ------	UNKNOWN
279.8275 -63.7157    2.3   7.8   67.1   0.0820   5.0 ------	UNKNOWN
Post-slew image of 15-350 keV band
Time interval of the image:
406.452600 638.552590

# RAcent  DECcent POSerr Theta    Phi  PeakCts   SNR AngSep     Name
#  [deg]    [deg]    ['] [deg]  [deg]                   [']
263.0771 -24.5935   11.7  45.1  -50.5  -0.5750  -1.0    9.9	GX 1+4
264.8178 -44.3228    7.7  36.7  -78.1  -0.6020  -1.5    8.3	4U 1735-44
268.3311  -1.4685    7.1  56.1  -23.2   1.1278   1.6    2.4	SW J1753.5-0127
270.1871 -25.1239    8.5  39.3  -46.2   0.4632   1.4    5.9	GX 5-1
270.1428 -25.6524    0.0  39.1  -46.9   0.6267   1.9   10.2	GRS 1758-258
273.9206 -14.0030    4.6  43.3  -29.5   0.8286   2.5    5.4	GX 17+2
275.9507 -30.3553   23.6  32.4  -49.8  -0.1163  -0.5    1.5	H1820-303
285.0009 -24.8971    5.7  28.3  -32.3   0.4128   2.0    2.4	HT1900.1-2455
288.7665  10.9411    3.2  55.2    5.8   2.8212   3.5    1.9	GRS 1915+105
262.9693 -33.7877   66.6  41.0  -62.6   0.0944   0.2    3.0	GX 354-0
297.6792  13.1710    3.4  54.4   16.7   3.5138   3.4 ------	UNKNOWN
298.1918   0.2666    2.5  41.9   12.2   1.1847   4.6 ------	UNKNOWN
 49.5919 -62.8239    2.6  58.3 -175.7   5.7127   4.4 ------	UNKNOWN
  5.7023 -71.6122    2.8  41.5 -165.2   1.0796   4.2 ------	UNKNOWN
 51.9597 -67.0701    3.3  57.5 -170.6   3.0221   3.5 ------	UNKNOWN
 60.5531 -69.7183    3.2  59.1 -166.2   4.3238   3.7 ------	UNKNOWN
Plot creation:
Sun May 31 02:54:47 EDT 2015