Special notes of this burst
Image
Pre-slew 15.0-350.0 keV image (Event data)
#   RAcent    DECcent   POSerr    Theta     Phi              Peak Cts       SNR   Name
   32.1911   -57.5462   0.0031    15.9048   107.0354         3.1889414     62.328 TRIG_00373172

Foreground time interval of the image:
 -0.268   7.748 (delta_t =   8.016 [sec])
Background time interval of the image:
-194.467  -0.268 (delta_t = 194.199 [sec])
Lightcurves
Notes:
- 1) The mask-weighted light curves are using the flight position.
- 2) Multiple plots of different time binning/intervals are shown to cover all scenarios of short/long GRBs, rate/image triggers, and real/false positives.
- 3) For all the mask-weighted lightcurves, the y-axis units are counts/sec/det where a det is 0.4 x 0.4 = 0.16 sq cm.
- 4) The verticle lines correspond to following: green dotted lines are T50 interval, black dotted lines are T90 interval, blue solid line(s) is a spacecraft slew start time, and orange solid line(s) is a spacecraft slew end time.
- 5) Time of each bin is in the middle of the bin.
1 s binning
From T0-310 s to T0+310 s
From T100_start - 20 s to T100_end + 30 s
Full time interval
64 ms binning
Full time interval
From T100_start to T100_end
From T0-5 sec to T0+5 sec
16 ms binning
From T100_start-5 s to T100_start+5 s
Blue+Cyan dotted lines: Time interval of the scaled map
From 0.000000 to 0.256000
8 ms binning
From T100_start-3 s to T100_start+3 s
Blue+Cyan dotted lines: Time interval of the scaled map
From 0.000000 to 0.256000
2 ms binning
From T100_start-1 s to T100_start+1 s
Blue+Cyan dotted lines: Time interval of the scaled map
From 0.000000 to 0.256000
SN=5 or 10 sec. binning (whichever binning is satisfied first)
SN=5 or 10 sec. binning (T < 200 sec)
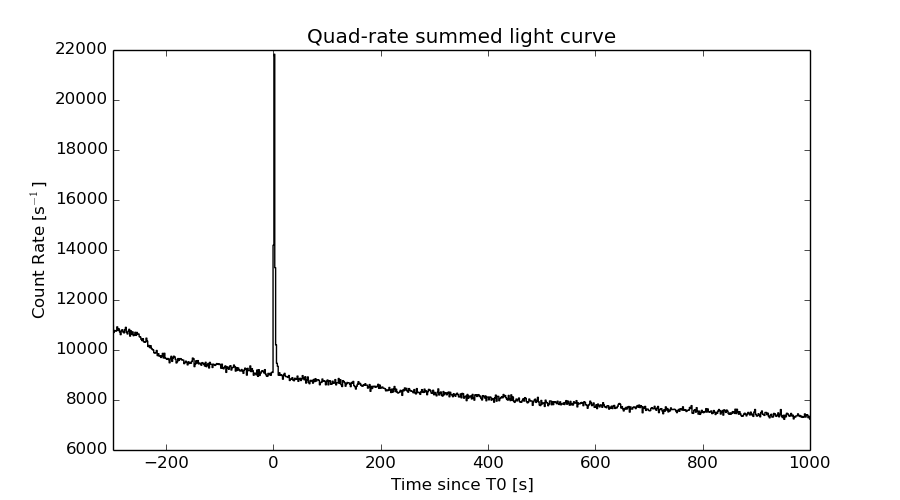
Quad-rate summed light curves (from T0-300s to T0+1000s)
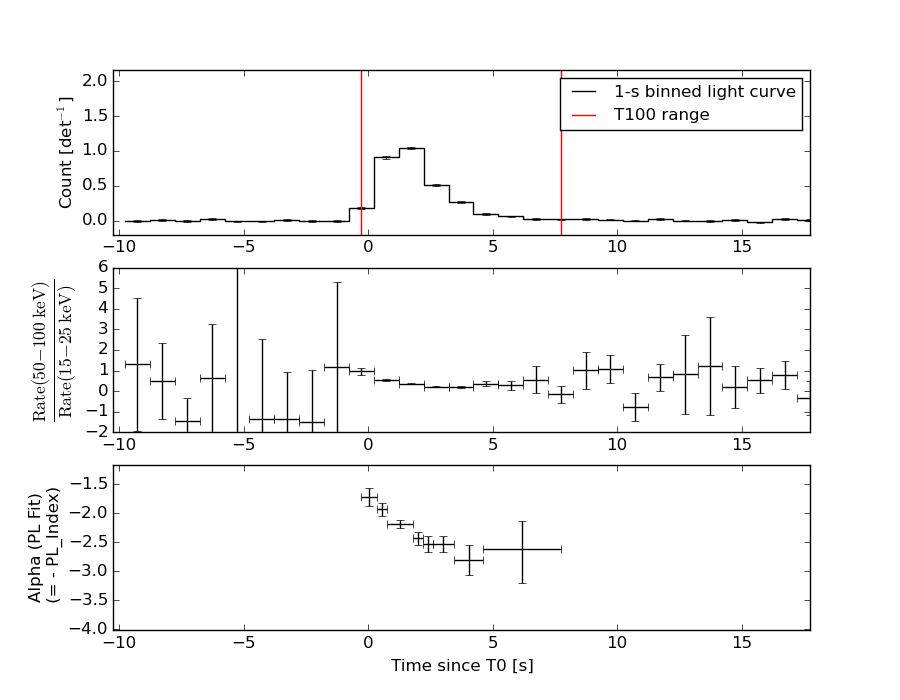
Spectral Evolution
Spectra
Notes:
- 1) The fitting includes the systematic errors.
- 2) When the burst includes telescope slew time periods, the fitting uses an average response file made from multiple 5-s response files through out the slew time plus single time preiod for the non-slew times, and weighted by the total counts in the corresponding time period using addrmf. An average response file is needed becuase a spectral fit using the pre-slew DRM will introduce some errors in both a spectral shape and a normalization if the PHA file contains a lot of the slew/post-slew time interval.
- 3) For fits to more complicated models (e.g. a power-law over a cutoff power-law), the BAT team has decided to require a chi-square improvement of more than 6 for each extra dof.
Time averaged spectrum fit using the average DRM
Power-law model

Time interval is from   -0.268 sec. to    7.748 sec.

Spectral model in power-law:
------------------------------------------------------------
Parameters  : value       lower 90%   higher 90%
Photon index: 2.30533     ( -0.0611911   0.0618704 )
Norm@50keV  : 1.97914E-02    ( -0.000661361   0.000657676 )
------------------------------------------------------------
#Fit statistic : Chi-Squared =          52.81 using 59 PHA bins.
# Reduced chi-squared =         0.9264 for     57 degrees of freedom
# Null hypothesis probability =   6.330687e-01

Photon flux (15-150 keV)    in 8.016 sec: 3.46900 ( -0.113261  0.113971 ) ph/cm2/s
Energy fluence (15-150 keV)             : 1.51756e-06 ( -4.38419e-08  4.39008e-08 ) ergs/cm2
Cutoff power-law model

Time interval is from   -0.268 sec. to    7.748 sec.
Spectral model in the cutoff power-law:
------------------------------------------------------------
Parameters  : value       lower 90%   higher 90%
Photon index: 1.75840     ( -0.291032   0.179915 )
Epeak [keV] : 19.4251      (   )
Norm@50keV  : 3.89934E-02    (     )
------------------------------------------------------------
#Fit statistic : Chi-Squared =          40.10 using 59 PHA bins.
# Reduced chi-squared =         0.7160 for     56 degrees of freedom
# Null hypothesis probability =   9.462677e-01

Photon flux (15-150 keV)    in 8.016 sec: 3.31045 ( -0.13378  0.13476 ) ph/cm2/s
Energy fluence (15-150 keV)             : 1.43431e-06 ( -5.77152e-08  5.82683e-08 ) ergs/cm2
Band function

Time interval is from   -0.268 sec. to    7.748 sec.

Spectral model in the Band function:
------------------------------------------------------------
Parameters  : value       lower 90%   higher 90%
alpha       : -1.75851   ( -0.0536259   0.00715361 )
beta        : -10.00000    ( 10   20 )
Epeak [keV] : 19.4177      ( -2.22071 9.30414 )
Norm@50keV   : 3.89771E-02    ( -0.00713032   0.0167889 )
------------------------------------------------------------
#Fit statistic : Chi-Squared =          40.10 using 59 PHA bins.
# Reduced chi-squared =         0.7290 for     55 degrees of freedom
# Null hypothesis probability =   9.343759e-01

Photon flux (15-150 keV)    in 8.016 sec:  (    ) ph/cm2/s
Energy fluence (15-150 keV)             : 1.43656e-06 ( -1.43651e-06  -5.3587e-08 ) ergs/cm2
Single BB
Spectral model blackbody:
------------------------------------------------------------
Parameters  : value    Lower 90%  Upper 90%
kT [keV]    : 9.81389  (  )
R^2/D10^2   : 1.50306  (   )
(R is the radius in km and D10 is the distance to the source in units of 10 kpc)
------------------------------------------------------------
#Fit statistic : Chi-Squared =         229.68 using 59 PHA bins.
# Reduced chi-squared =         4.0294 for     57 degrees of freedom
# Null hypothesis probability =   1.372567e-22

Energy  Fluence     90% Error
[keV]   [erg/cm2]   [erg/cm2]
15- 25  2.348e-07   1.427e-08
25- 50  5.682e-07   1.651e-08
50-150  2.808e-07   2.232e-08
15-150  1.084e-06   3.327e-08
Thermal bremsstrahlung (OTTB)
Spectral model: thermal bremsstrahlung
------------------------------------------------------------
Parameters  : value         Lower 90%    Upper 90%
kT [keV]    : 47.9516       (-3.60342      4.0539)
Norm        : 19.0024       (-1.17942     1.26774)
------------------------------------------------------------
#Fit statistic : Chi-Squared =          45.52 using 59 PHA bins.
# Reduced chi-squared =         0.7986 for     57 degrees of freedom
# Null hypothesis probability =   8.629878e-01

Energy  Fluence     90% Error
[keV]   [erg/cm2]   [erg/cm2]
15- 25  3.688e-07   1.707e-08
25- 50  5.216e-07   1.571e-08
50-150  4.866e-07   3.603e-08
15-150  1.377e-06   3.968e-08
Double BB
Spectral model: bbodyrad<1> + bbodyrad<2>
------------------------------------------------------------
Parameters  : value         Lower 90%    Upper 90%
kT1 [keV]   : 6.24685        (-0.589113      0.583589)
R1^2/D10^2  : 7.12502        (-1.99636      3.24565)
kT2 [keV]   : 19.2073        (-2.37022      3.1557)
R2^2/D10^2  : 6.38393E-02    (-0.0302914   0.0505348)
------------------------------------------------------------
#Fit statistic : Chi-Squared =          42.37 using 59 PHA bins.
# Reduced chi-squared =         0.7703 for     55 degrees of freedom
# Null hypothesis probability =   8.937030e-01

Energy  Fluence     90% Error
[keV]   [erg/cm2]   [erg/cm2]
15- 25  3.501e-07   3.154e-08
25- 50  5.196e-07   3.182e-08
50-150  5.234e-07   8.461e-08
15-150  1.393e-06   1.355e-07
Peak spectrum fit
Power-law model
Time interval is from    0.800 sec. to    1.800 sec.

Spectral model in power-law:
------------------------------------------------------------
Parameters  : value       lower 90%   higher 90%
Photon index: 2.19323     ( -0.0626933   0.0635088 )
Norm@50keV  : 6.29420E-02    ( -0.0023644   0.00235209 )
------------------------------------------------------------
#Fit statistic : Chi-Squared =          86.41 using 59 PHA bins.
# Reduced chi-squared =          1.516 for     57 degrees of freedom
# Null hypothesis probability =   7.216812e-03

Photon flux (15-150 keV)    in 1 sec: 10.3833 ( -0.375614  0.3769 ) ph/cm2/s
Energy fluence (15-150 keV)             : 5.91229e-07 ( -2.0192e-08  2.02247e-08 ) ergs/cm2
Cutoff power-law model

Time interval is from    0.800 sec. to    1.800 sec.
Spectral model in the cutoff power-law:
------------------------------------------------------------
Parameters  : value       lower 90%   higher 90%
Photon index: 1.29822     ( -0.315514   0.293489 )
Epeak [keV] : 35.0618      ( -5.92761 4.09311 )
Norm@50keV  : 0.191167    ( -0.057644   0.0911828 )
------------------------------------------------------------
#Fit statistic : Chi-Squared =          55.28 using 59 PHA bins.
# Reduced chi-squared =         0.9871 for     56 degrees of freedom
# Null hypothesis probability =   5.021020e-01

Photon flux (15-150 keV)    in 1 sec: 9.80057 ( -0.41074  0.41273 ) ph/cm2/s
Energy fluence (15-150 keV)             : 5.50153e-07 ( -2.3339e-08  2.3522e-08 ) ergs/cm2
Band function

Time interval is from    0.800 sec. to    1.800 sec.

Spectral model in the Band function:
------------------------------------------------------------
Parameters  : value       lower 90%   higher 90%
alpha       : -1.29814   ( -0.133296   0.201519 )
beta        : -10.00000    ( 10   1.61471e-11 )
Epeak [keV] : 35.0550      ( -2.8793 3.27436 )
Norm@50keV   : 0.191165    ( -0.0392728   0.0912989 )
------------------------------------------------------------
#Fit statistic : Chi-Squared =          55.28 using 59 PHA bins.
# Reduced chi-squared =          1.005 for     55 degrees of freedom
# Null hypothesis probability =   4.641126e-01

Photon flux (15-150 keV)    in 1 sec:  (    ) ph/cm2/s
Energy fluence (15-150 keV)             : 5.5608e-07 ( -5.56073e-07  -2.2476e-08 ) ergs/cm2
Single BB
Spectral model blackbody:
------------------------------------------------------------
Parameters  : value    Lower 90%  Upper 90%
kT [keV]    : 10.3076  (  )
R^2/D10^2   : 3.98274  (   )
(R is the radius in km and D10 is the distance to the source in units of 10 kpc)
------------------------------------------------------------
#Fit statistic : Chi-Squared =         187.52 using 59 PHA bins.
# Reduced chi-squared =         3.2899 for     57 degrees of freedom
# Null hypothesis probability =   7.949547e-16

Energy  Fluence     90% Error
[keV]   [erg/cm2]   [erg/cm2]
15- 25  8.701e-08   5.140e-09
25- 50  2.257e-07   8.800e-09
50-150  1.285e-07   1.035e-08
15-150  4.412e-07   1.490e-08
Thermal bremsstrahlung (OTTB)
Spectral model: thermal bremsstrahlung
------------------------------------------------------------
Parameters  : value         Lower 90%    Upper 90%
kT [keV]    : 54.9126       (-4.81783      5.24733)
Norm        : 55.1752       (-3.4837     3.25684)
------------------------------------------------------------
#Fit statistic : Chi-Squared =          55.06 using 59 PHA bins.
# Reduced chi-squared =         0.9659 for     57 degrees of freedom
# Null hypothesis probability =   5.483756e-01

Energy  Fluence     90% Error
[keV]   [erg/cm2]   [erg/cm2]
15- 25  1.365e-07   7.250e-09
25- 50  2.019e-07   6.850e-09
50-150  2.130e-07   1.400e-08
15-150  5.514e-07   1.800e-08
Double BB
Spectral model: bbodyrad<1> + bbodyrad<2>
------------------------------------------------------------
Parameters  : value         Lower 90%    Upper 90%
kT1 [keV]   : 6.38001        (-0.675961      0.697058)
R1^2/D10^2  : 18.6976        (-5.62022      9.19938)
kT2 [keV]   : 18.3831        (-2.1569      2.94434)
R2^2/D10^2  : 0.253449    (-0.123118   0.196818)
------------------------------------------------------------
#Fit statistic : Chi-Squared =          51.52 using 59 PHA bins.
# Reduced chi-squared =         0.9367 for     55 degrees of freedom
# Null hypothesis probability =   6.085091e-01

Energy  Fluence     90% Error
[keV]   [erg/cm2]   [erg/cm2]
15- 25  1.269e-07   1.340e-08
25- 50  2.049e-07   2.085e-08
50-150  2.119e-07   3.705e-08
15-150  5.437e-07   6.380e-08
Pre-slew spectrum (Pre-slew PHA with pre-slew DRM)
Power-law model
Spectral model in power-law:
------------------------------------------------------------
Parameters  : value       lower 90%   higher 90%
Photon index: 2.30533     ( -0.0611911   0.0618704 )
Norm@50keV  : 1.97914E-02    ( -0.000661361   0.000657676 )
------------------------------------------------------------
#Fit statistic : Chi-Squared =          52.81 using 59 PHA bins.
# Reduced chi-squared =         0.9264 for     57 degrees of freedom
# Null hypothesis probability =   6.330687e-01

Photon flux (15-150 keV)    in 8.016 sec: 3.46900 ( -0.113261  0.113971 ) ph/cm2/s
Energy fluence (15-150 keV)             : 1.51756e-06 ( -4.38419e-08  4.39008e-08 ) ergs/cm2
Cutoff power-law model
Spectral model in the cutoff power-law:
------------------------------------------------------------
Parameters  : value       lower 90%   higher 90%
Photon index: 1.75840     ( -0.291032   0.179915 )
Epeak [keV] : 19.4251      (   )
Norm@50keV  : 3.89934E-02    (     )
------------------------------------------------------------
#Fit statistic : Chi-Squared =          40.10 using 59 PHA bins.
# Reduced chi-squared =         0.7160 for     56 degrees of freedom
# Null hypothesis probability =   9.462677e-01

Photon flux (15-150 keV)    in 8.016 sec: 3.31045 ( -0.13378  0.13476 ) ph/cm2/s
Energy fluence (15-150 keV)             : 1.43431e-06 ( -5.77152e-08  5.82683e-08 ) ergs/cm2
Band function

Spectral model in the Band function:
------------------------------------------------------------
Parameters  : value       lower 90%   higher 90%
alpha       : -1.75851   ( -0.0536259   0.00715361 )
beta        : -10.00000    ( 10   5.32907e-15 )
Epeak [keV] : 19.4177      ( -2.22071 9.30414 )
Norm@50keV   : 3.89771E-02    ( -0.00713032   0.0167889 )
------------------------------------------------------------
#Fit statistic : Chi-Squared =          40.10 using 59 PHA bins.
# Reduced chi-squared =         0.7290 for     55 degrees of freedom
# Null hypothesis probability =   9.343759e-01

Photon flux (15-150 keV)    in 8.016 sec:  (    ) ph/cm2/s
Energy fluence (15-150 keV)             : 1.43656e-06 ( -1.43651e-06  -5.3587e-08 ) ergs/cm2
S(25-50 keV) vs. S(50-100 keV) plot
S(25-50 keV)  = 4.90e-07
S(50-100 keV) = 3.97e-07
T90 vs. Hardness ratio plot
T90                                   = 4.36799991130829 sec.
Hardness ratio (energy fluence ratio) = 0.810204
Color vs. Color plot
Count Ratio  (25-50 keV) / (15-25 keV) = 0.943979
Count Ratio (50-100 keV) / (15-25 keV) = 0.371707
Mask shadow pattern
IMX = -8.347940129779462E-02, IMY = -2.724465592529742E-01
TIME vs. PHA plot around the trigger time
Blue+Cyan dotted lines: Time interval of the scaled map
From 0.000000 to 0.256000
TIME vs. DetID plot around the trigger time
Blue+Cyan dotted lines: Time interval of the scaled map
From 0.000000 to 0.256000
100 us light curve (15-350 keV)
Blue+Cyan dotted lines: Time interval of the scaled map
From 0.000000 to 0.256000
Spacecraft aspect plot
Bright source in the pre-burst/pre-slew/post-slew images
Pre-burst image of 15-350 keV band
Time interval of the image:
-194.467410 -0.268000

# RAcent  DECcent POSerr Theta    Phi  PeakCts   SNR AngSep     Name
#  [deg]    [deg]    ['] [deg]  [deg]                   [']
124.4538 -38.3966    4.4  59.1 -166.2   3.2210   2.6 ------	UNKNOWN
Pre-slew background subtracted image of 15-350 keV band
Time interval of the image:
-0.268000 7.748000

# RAcent  DECcent POSerr Theta    Phi  PeakCts   SNR AngSep     Name
#  [deg]    [deg]    ['] [deg]  [deg]                   [']
 32.1911 -57.5462    0.2  15.9  107.0   3.1890  62.3 ------	UNKNOWN
323.4794 -32.2878    2.6  48.2    9.7   0.4774   4.5 ------	UNKNOWN
209.6002 -66.6184    3.2  41.1  -97.9   0.6566   3.6 ------	UNKNOWN
Post-slew image of 15-350 keV band
Time interval of the image:
49.932600 962.283400

# RAcent  DECcent POSerr Theta    Phi  PeakCts   SNR AngSep     Name
#  [deg]    [deg]    ['] [deg]  [deg]                   [']
322.2071 -42.6595    2.6  45.0   -3.1   4.0582   4.4 ------	UNKNOWN
107.9095 -28.0875    3.6  59.1 -166.2  11.7139   3.2 ------	UNKNOWN
Plot creation:
Sun May 31 02:51:05 EDT 2015