Special notes of this burst
Image
Pre-slew 15.0-350.0 keV image (Event data)

#   RAcent    DECcent   POSerr    Theta     Phi              Peak Cts       SNR   Name
  276.6456   -86.1139   0.0066    33.0585  -110.7727         2.2709497     29.312 TRIG_00373871

Foreground time interval of the image:
 -4.360  14.341 (delta_t =  18.701 [sec])
Background time interval of the image:
-239.360  -4.360 (delta_t = 235.000 [sec])
Lightcurves
Notes:
- 1) The mask-weighted light curves are using the flight position.
- 2) Multiple plots of different time binning/intervals are shown to cover all scenarios of short/long GRBs, rate/image triggers, and real/false positives.
- 3) For all the mask-weighted lightcurves, the y-axis units are counts/sec/det where a det is 0.4 x 0.4 = 0.16 sq cm.
- 4) The verticle lines correspond to following: green dotted lines are T50 interval, black dotted lines are T90 interval, blue solid line(s) is a spacecraft slew start time, and orange solid line(s) is a spacecraft slew end time.
- 5) Time of each bin is in the middle of the bin.
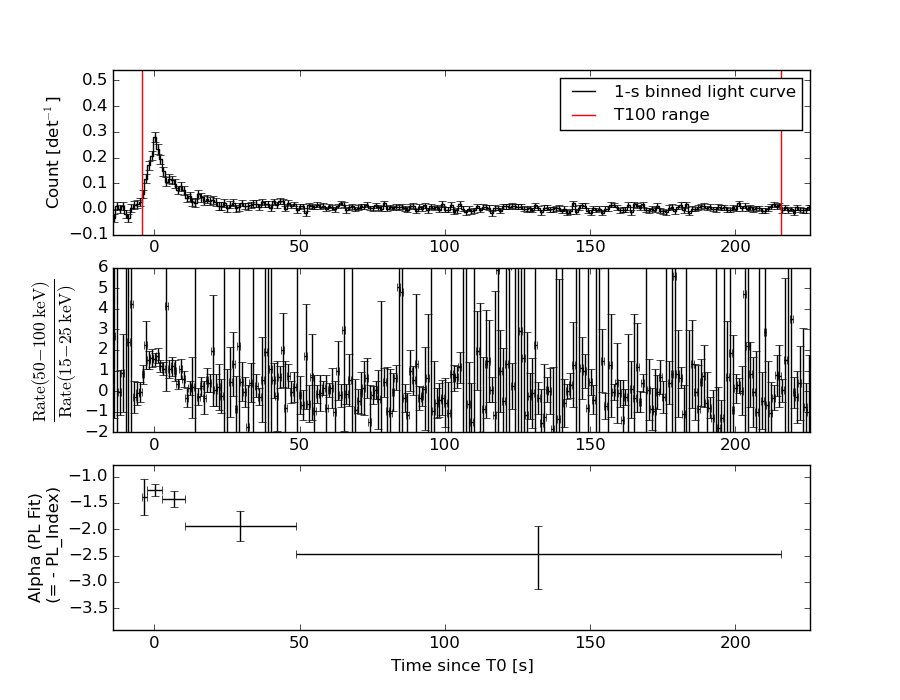
1 s binning
From T0-310 s to T0+310 s

From T100_start - 20 s to T100_end + 30 s
Full time interval

64 ms binning
Full time interval

From T100_start to T100_end

From T0-5 sec to T0+5 sec

16 ms binning
From T100_start-5 s to T100_start+5 s
Blue+Cyan dotted lines: Time interval of the scaled map
From 0.000000 to 1.024000
8 ms binning
From T100_start-3 s to T100_start+3 s

Blue+Cyan dotted lines: Time interval of the scaled map
From 0.000000 to 1.024000
2 ms binning
From T100_start-1 s to T100_start+1 s

Blue+Cyan dotted lines: Time interval of the scaled map
From 0.000000 to 1.024000
SN=5 or 10 sec. binning (whichever binning is satisfied first)
SN=5 or 10 sec. binning (T < 200 sec)
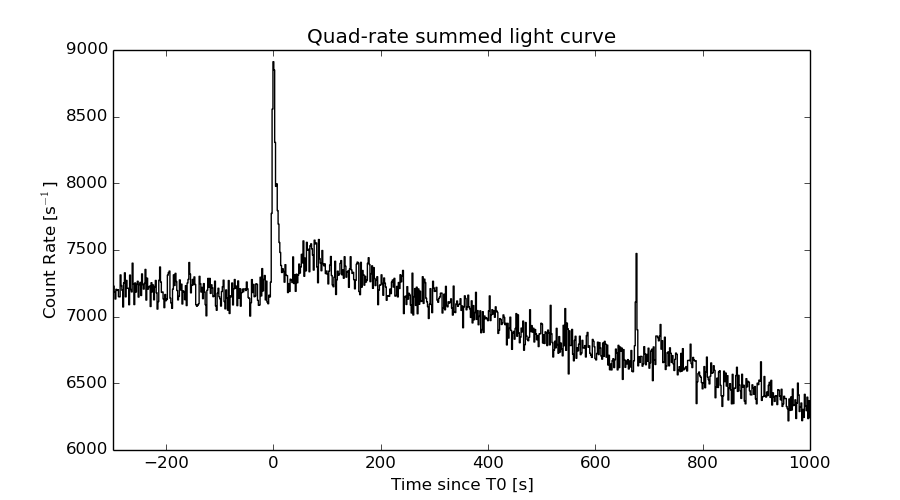
Quad-rate summed light curves (from T0-300s to T0+1000s)
Spectral Evolution
Spectra
Notes:
- 1) The fitting includes the systematic errors.
- 2) When the burst includes telescope slew time periods, the fitting uses an average response file made from multiple 5-s response files through out the slew time plus single time preiod for the non-slew times, and weighted by the total counts in the corresponding time period using addrmf. An average response file is needed becuase a spectral fit using the pre-slew DRM will introduce some errors in both a spectral shape and a normalization if the PHA file contains a lot of the slew/post-slew time interval.
- 3) For fits to more complicated models (e.g. a power-law over a cutoff power-law), the BAT team has decided to require a chi-square improvement of more than 6 for each extra dof.
Time averaged spectrum fit using the average DRM
Power-law model

Time interval is from   -4.360 sec. to  215.640 sec.

Spectral model in power-law:
------------------------------------------------------------
Parameters  : value       lower 90%   higher 90%
Photon index: 1.70162     ( -0.137286   0.139475 )
Norm@50keV  : 9.97517E-04    ( -8.43549e-05   8.33689e-05 )
------------------------------------------------------------
#Fit statistic : Chi-Squared =          65.87 using 59 PHA bins.
# Reduced chi-squared =          1.156 for     57 degrees of freedom
# Null hypothesis probability =   1.968378e-01

Photon flux (15-150 keV)    in 220 sec: 0.132556 ( -0.0100997  0.0101051 ) ph/cm2/s
Energy fluence (15-150 keV)             : 2.03163e-06 ( -1.80248e-07  1.82532e-07 ) ergs/cm2
Cutoff power-law model

Time interval is from   -4.360 sec. to  215.640 sec.
Spectral model in the cutoff power-law:
------------------------------------------------------------
Parameters  : value       lower 90%   higher 90%
Photon index: 1.60794     ( -0.587853   0.523712 )
Epeak [keV] : 184.105      ( -128.086 -186.443 )
Norm@50keV  : 1.12588E-03    ( -0.00018705   0.0012584 )
------------------------------------------------------------
#Fit statistic : Chi-Squared =          65.78 using 59 PHA bins.
# Reduced chi-squared =          1.175 for     56 degrees of freedom
# Null hypothesis probability =   1.742172e-01

Photon flux (15-150 keV)    in 220 sec: 0.131997 ( -0.010566  0.005262 ) ph/cm2/s
Energy fluence (15-150 keV)             : 2.00982e-06 ( -2.24224e-07  2.00565e-07 ) ergs/cm2
Band function

Time interval is from   -4.360 sec. to  215.640 sec.

Spectral model in the Band function:
------------------------------------------------------------
Parameters  : value       lower 90%   higher 90%
alpha       : 4.89751   ( -13.8656   -4.89751 )
beta        : -1.84260    ( -0.215963   0.16756 )
Epeak [keV] : 24.2553      ( -4.80949 3.53399 )
Norm@50keV   : 130.521    ( -9.78476   509.746 )
------------------------------------------------------------
#Fit statistic : Chi-Squared =          60.50 using 59 PHA bins.
# Reduced chi-squared =          1.100 for     55 degrees of freedom
# Null hypothesis probability =   2.838900e-01

Photon flux (15-150 keV)    in 220 sec:  (    ) ph/cm2/s
Energy fluence (15-150 keV)             : 0 ( 0  0 ) ergs/cm2
Single BB

Spectral model blackbody:
------------------------------------------------------------
Parameters  : value    Lower 90%  Upper 90%
kT [keV]    : 11.0823  (-1.02427  1.16751)
R^2/D10^2   : 4.22692E-02  (-0.0131686   0.0185231)
(R is the radius in km and D10 is the distance to the source in units of 10 kpc)
------------------------------------------------------------
#Fit statistic : Chi-Squared =         103.72 using 59 PHA bins.
# Reduced chi-squared =         1.8197 for     57 degrees of freedom
# Null hypothesis probability =   1.539367e-04

Energy  Fluence     90% Error
[keV]   [erg/cm2]   [erg/cm2]
15- 25  2.390e-07   3.271e-08
25- 50  6.822e-07   6.545e-08
50-150  4.760e-07   9.471e-08
15-150  1.397e-06   1.355e-07
Thermal bremsstrahlung (OTTB)

Spectral model: thermal bremsstrahlung
------------------------------------------------------------
Parameters  : value         Lower 90%    Upper 90%
kT [keV]    : 125.202       (-37.0795      64.6516)
Norm        : 0.558695       (-0.0520882     0.0650082)
------------------------------------------------------------
#Fit statistic : Chi-Squared =          66.51 using 59 PHA bins.
# Reduced chi-squared =          1.167 for     57 degrees of freedom
# Null hypothesis probability =   1.821912e-01

Energy  Fluence     90% Error
[keV]   [erg/cm2]   [erg/cm2]
15- 25  3.196e-07   3.564e-08
25- 50  5.758e-07   6.985e-08
50-150  1.049e-06   4.005e-07
15-150  1.944e-06   4.708e-07
Double BB

Spectral model: bbodyrad<1> + bbodyrad<2>
------------------------------------------------------------
Parameters  : value         Lower 90%    Upper 90%
kT1 [keV]   : 7.64419        (-1.51176      1.55144)
R1^2/D10^2  : 0.133576        (-0.0419452      0.0775689)
kT2 [keV]   : 36.5535        (-22.4372      -51.7615)
R2^2/D10^2  : 4.14835E-04    (-0.000161252   0.000720566)
------------------------------------------------------------
#Fit statistic : Chi-Squared =          59.18 using 59 PHA bins.
# Reduced chi-squared =          1.076 for     55 degrees of freedom
# Null hypothesis probability =   3.255460e-01

Energy  Fluence     90% Error
[keV]   [erg/cm2]   [erg/cm2]
15- 25  3.163e-07   8.231e-08
25- 50  5.949e-07   1.218e-07
50-150  1.056e-06   5.435e-07
15-150  1.967e-06   7.071e-07
Peak spectrum fit
Power-law model

Time interval is from   -0.360 sec. to    0.640 sec.

Spectral model in power-law:
------------------------------------------------------------
Parameters  : value       lower 90%   higher 90%
Photon index: 1.21860     ( -0.207073   0.20473 )
Norm@50keV  : 1.84948E-02    ( -0.00213104   0.00212925 )
------------------------------------------------------------
#Fit statistic : Chi-Squared =          67.18 using 59 PHA bins.
# Reduced chi-squared =          1.179 for     57 degrees of freedom
# Null hypothesis probability =   1.676401e-01

Photon flux (15-150 keV)    in 1 sec: 2.17677 ( -0.255664  0.256118 ) ph/cm2/s
Energy fluence (15-150 keV)             : 1.86667e-07 ( -2.42905e-08  2.45233e-08 ) ergs/cm2
Cutoff power-law model

Time interval is from   -0.360 sec. to    0.640 sec.
Spectral model in the cutoff power-law:
------------------------------------------------------------
Parameters  : value       lower 90%   higher 90%
Photon index: 1.21686     ( -0.237286   0.204187 )
Epeak [keV] : 9999.36      ( -9999.36 -9999.36 )
Norm@50keV  : 1.85682E-02    ( -0.0185808   0.0201104 )
------------------------------------------------------------
#Fit statistic : Chi-Squared =          67.18 using 59 PHA bins.
# Reduced chi-squared =          1.200 for     56 degrees of freedom
# Null hypothesis probability =   1.455599e-01

Photon flux (15-150 keV)    in 1 sec: 2.17738 ( -0.25851  0.25439 ) ph/cm2/s
Energy fluence (15-150 keV)             : 1.86763e-07 ( -2.5082e-08  2.4294e-08 ) ergs/cm2
Band function

Time interval is from   -0.360 sec. to    0.640 sec.

Spectral model in the Band function:
------------------------------------------------------------
Parameters  : value       lower 90%   higher 90%
alpha       : 4.69172   ( -4.69172   -4.69172 )
beta        : -1.27685    ( -0.236773   0.226841 )
Epeak [keV] : 24.7122      ( -24.7122 9.13832 )
Norm@50keV   : 973.880    ( -111.802   5.68071e+06 )
------------------------------------------------------------
#Fit statistic : Chi-Squared =          66.52 using 59 PHA bins.
# Reduced chi-squared =          1.210 for     55 degrees of freedom
# Null hypothesis probability =   1.372362e-01

Photon flux (15-150 keV)    in 1 sec:  (    ) ph/cm2/s
Energy fluence (15-150 keV)             : 0 ( 0  0 ) ergs/cm2
Single BB

Spectral model blackbody:
------------------------------------------------------------
Parameters  : value    Lower 90%  Upper 90%
kT [keV]    : 18.6066  (-3.15411  3.95162)
R^2/D10^2   : 0.123604  (-0.0568208   0.104083)
(R is the radius in km and D10 is the distance to the source in units of 10 kpc)
------------------------------------------------------------
#Fit statistic : Chi-Squared =          89.33 using 59 PHA bins.
# Reduced chi-squared =          1.567 for     57 degrees of freedom
# Null hypothesis probability =   3.992897e-03

Energy  Fluence     90% Error
[keV]   [erg/cm2]   [erg/cm2]
15- 25  8.474e-09   2.256e-09
25- 50  4.015e-08   7.075e-09
50-150  1.017e-07   2.251e-08
15-150  1.503e-07   2.730e-08
Thermal bremsstrahlung (OTTB)

Spectral model: thermal bremsstrahlung
------------------------------------------------------------
Parameters  : value         Lower 90%    Upper 90%
kT [keV]    : 200.000       (      )
Norm        : 8.93350       (-1.04685     1.04681)
------------------------------------------------------------
#Fit statistic : Chi-Squared =          74.70 using 59 PHA bins.
# Reduced chi-squared =          1.311 for     57 degrees of freedom
# Null hypothesis probability =   5.783518e-02

Energy  Fluence     90% Error
[keV]   [erg/cm2]   [erg/cm2]
15- 25  2.224e-08   1.244e-08
25- 50  4.279e-08   2.361e-08
50-150  9.384e-08   5.150e-08
15-150  1.589e-07   8.760e-08
Double BB

Spectral model: bbodyrad<1> + bbodyrad<2>
------------------------------------------------------------
Parameters  : value         Lower 90%    Upper 90%
kT1 [keV]   : 7.85000        (-2.14231      2.74329)
R1^2/D10^2  : 1.47229        (-0.90957      2.87603)
kT2 [keV]   : 38.3433        (-12.1167      44.4898)
R2^2/D10^2  : 1.05288E-02    (-0.00859594   0.0240532)
------------------------------------------------------------
#Fit statistic : Chi-Squared =          65.23 using 59 PHA bins.
# Reduced chi-squared =          1.186 for     55 degrees of freedom
# Null hypothesis probability =   1.627129e-01

Energy  Fluence     90% Error
[keV]   [erg/cm2]   [erg/cm2]
15- 25  1.823e-08   9.794e-09
25- 50  4.124e-08   1.911e-08
50-150  1.324e-07   6.898e-08
15-150  1.919e-07   9.546e-08
Pre-slew spectrum (Pre-slew PHA with pre-slew DRM)
Power-law model

Spectral model in power-law:
------------------------------------------------------------
Parameters  : value       lower 90%   higher 90%
Photon index: 1.38868     ( -0.098089   0.0978084 )
Norm@50keV  : 8.08244E-03    ( -0.000451819   0.000451117 )
------------------------------------------------------------
#Fit statistic : Chi-Squared =          62.85 using 59 PHA bins.
# Reduced chi-squared =          1.103 for     57 degrees of freedom
# Null hypothesis probability =   2.767610e-01

Photon flux (15-150 keV)    in 18.7 sec: 0.981792 ( -0.0561788  0.0562482 ) ph/cm2/s
Energy fluence (15-150 keV)             : 1.46385e-06 ( -9.03365e-08  9.07801e-08 ) ergs/cm2
Cutoff power-law model

Spectral model in the cutoff power-law:
------------------------------------------------------------
Parameters  : value       lower 90%   higher 90%
Photon index: 1.18189     ( -0.393096   0.256258 )
Epeak [keV] : 200.134      ( -200.136 -200.136 )
Norm@50keV  : 1.02669E-02    ( -0.00252105   0.00571173 )
------------------------------------------------------------
#Fit statistic : Chi-Squared =          61.91 using 59 PHA bins.
# Reduced chi-squared =          1.105 for     56 degrees of freedom
# Null hypothesis probability =   2.735176e-01

Photon flux (15-150 keV)    in 18.7 sec: 0.972510 ( -0.058433  0.05839 ) ph/cm2/s
Energy fluence (15-150 keV)             : 1.44012e-06 ( -1.01156e-07  1.00109e-07 ) ergs/cm2
Band function

Spectral model in the Band function:
------------------------------------------------------------
Parameters  : value       lower 90%   higher 90%
alpha       : 4.98723   ( -14.5065   -4.98723 )
beta        : -1.48880    ( -0.116714   0.113689 )
Epeak [keV] : 26.0957      ( -4.4117 3.63409 )
Norm@50keV   : 592.628    ( -32.6722   1294.95 )
------------------------------------------------------------
#Fit statistic : Chi-Squared =          55.01 using 59 PHA bins.
# Reduced chi-squared =          1.000 for     55 degrees of freedom
# Null hypothesis probability =   4.743060e-01

Photon flux (15-150 keV)    in 18.7 sec:  (    ) ph/cm2/s
Energy fluence (15-150 keV)             : 0 ( 0  0 ) ergs/cm2
S(25-50 keV) vs. S(50-100 keV) plot

S(25-50 keV)  = 5.50e-07
S(50-100 keV) = 6.77e-07
T90 vs. Hardness ratio plot

T90                                   = 174 sec.
Hardness ratio (energy fluence ratio) = 1.23091
Color vs. Color plot
Count Ratio  (25-50 keV) / (15-25 keV) = 1.22401
Count Ratio (50-100 keV) / (15-25 keV) = 0.741587
Mask shadow pattern
IMX = -2.308345543989691E-01, IMY = 6.085509223324870E-01
TIME vs. PHA plot around the trigger time
Blue+Cyan dotted lines: Time interval of the scaled map
From 0.000000 to 1.024000
TIME vs. DetID plot around the trigger time

Blue+Cyan dotted lines: Time interval of the scaled map
From 0.000000 to 1.024000
100 us light curve (15-350 keV)

Blue+Cyan dotted lines: Time interval of the scaled map
From 0.000000 to 1.024000
Spacecraft aspect plot

Bright source in the pre-burst/pre-slew/post-slew images
Pre-burst image of 15-350 keV band
Time interval of the image:
-239.360000 -4.360000

# RAcent  DECcent POSerr Theta    Phi  PeakCts   SNR AngSep     Name
#  [deg]    [deg]    ['] [deg]  [deg]                   [']
341.6130 -10.0382    2.1  47.7   43.2   4.4151   5.5 ------	UNKNOWN
 81.1869 -40.9174    2.6  54.6  174.7   3.2246   4.4 ------	UNKNOWN
102.2918 -48.0342    3.2  59.0 -166.2   4.4145   3.6 ------	UNKNOWN
239.3741 -76.3635    3.9  41.3  -99.1   3.0143   3.0 ------	UNKNOWN
Pre-slew background subtracted image of 15-350 keV band
Time interval of the image:
-4.360000 14.340600

# RAcent  DECcent POSerr Theta    Phi  PeakCts   SNR AngSep     Name
#  [deg]    [deg]    ['] [deg]  [deg]                   [']
 26.6303 -22.8667    2.4  40.4  109.0   0.8427   4.9 ------	UNKNOWN
276.6455 -86.1139    0.4  33.1 -110.8   2.2713  29.3 ------	UNKNOWN
135.3656 -70.3241    2.3  50.0 -134.3   1.1849   5.2 ------	UNKNOWN
Post-slew image of 15-350 keV band
Time interval of the image:
67.940590 962.667500

# RAcent  DECcent POSerr Theta    Phi  PeakCts   SNR AngSep     Name
#  [deg]    [deg]    ['] [deg]  [deg]                   [']
135.5222 -40.4053   17.3  52.7 -166.4  -1.0567  -0.7    9.0	Vela X-1
170.2961 -60.6340    1.3  30.7 -136.0   5.6731   9.1    0.9	Cen X-3
186.5731 -62.7321    3.9  27.5 -120.9   1.6648   2.9    3.2	GX 301-2
255.8752 -37.8070    6.9  48.6  -45.3   4.2770   1.7    5.7	4U 1700-377
256.7221 -36.4122    8.7  50.0  -44.3   3.2917   1.3   13.9	GX 349+2
264.7131 -44.5197    7.3  41.7  -36.2   1.2819   1.6    4.4	4U 1735-44
276.0344 -30.4063    7.7  55.7  -24.0  -2.6008  -1.5    6.1	H1820-303
263.0920 -33.9157   11.1  52.3  -37.6   1.9906   1.0    7.1	GX 354-0
 98.3041 -44.4136    3.0  49.5  158.2   6.3993   3.8 ------	UNKNOWN
315.7556 -39.9246    2.7  47.1   18.0   4.7697   4.2 ------	UNKNOWN
123.5801 -55.9437    2.5  37.6 -178.7   3.1163   4.7 ------	UNKNOWN
293.8888 -30.8785    3.0  55.4   -5.4   5.8539   3.8 ------	UNKNOWN
289.9354 -28.7662    3.3  57.5   -9.5   7.6639   3.5 ------	UNKNOWN
215.4213 -62.7563    3.0  25.6  -91.7   2.3990   3.9 ------	UNKNOWN
271.7431 -29.8700    3.3  56.3  -28.5   7.1551   3.5 ------	UNKNOWN
199.3474 -50.8392    4.2  38.5 -105.4   4.2161   2.8 ------	UNKNOWN
Plot creation:
Sun May 31 02:45:24 EDT 2015