Click here for the BAT GCN circular template
Image
Pre-slew 15.0-350.0 keV image (Event data)
#   RAcent    DECcent   POSerr    Theta     Phi              Peak Cts       SNR   Name
   72.6217   -72.5273   0.0080    17.3622   -81.3692         0.7818382     23.765 TRIG_00374598

Foreground time interval of the image:
 -0.780   6.632 (delta_t =   7.412 [sec])
Background time interval of the image:
-239.584  -0.780 (delta_t = 238.804 [sec])
Lightcurves
Notes:
- 1) The mask-weighted light curves are using the flight position.
- 2) Multiple plots of different time binning/intervals are shown to cover all scenarios of short/long GRBs, rate/image triggers, and real/false positives.
- 3) For all the mask-weighted lightcurves, the y-axis units are counts/sec/det where a det is 0.4 x 0.4 = 0.16 sq cm.
- 4) The verticle lines correspond to following: green dotted lines are T50 interval, black dotted lines are T90 interval, blue solid line(s) is a spacecraft slew start time, and orange solid line(s) is a spacecraft slew end time.
- 5) Time of each bin is in the middle of the bin.
1 s binning
From T0-310 s to T0+310 s

From T100_start - 20 s to T100_end + 30 s
Full time interval
64 ms binning
Full time interval
From T100_start to T100_end
From T0-5 sec to T0+5 sec

16 ms binning
From T100_start-5 s to T100_start+5 s

Blue+Cyan dotted lines: Time interval of the scaled map
From 0.000000 to 1.024000
8 ms binning
From T100_start-3 s to T100_start+3 s

Blue+Cyan dotted lines: Time interval of the scaled map
From 0.000000 to 1.024000
2 ms binning
From T100_start-1 s to T100_start+1 s

Blue+Cyan dotted lines: Time interval of the scaled map
From 0.000000 to 1.024000
SN=5 or 10 sec. binning (whichever binning is satisfied first)
SN=5 or 10 sec. binning (T < 200 sec)
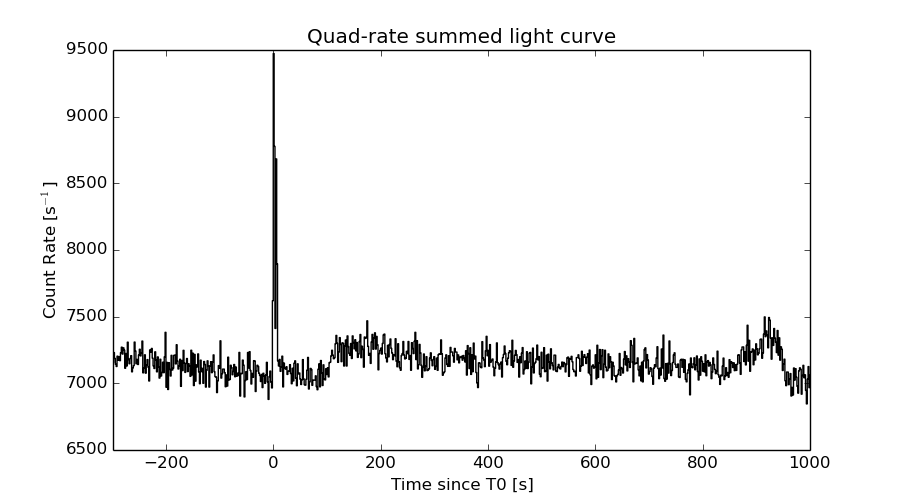
Quad-rate summed light curves (from T0-300s to T0+1000s)
Spectral Evolution

Spectra
Notes:
- 1) The fitting includes the systematic errors.
- 2) When the burst includes telescope slew time periods, the fitting uses an average response file made from multiple 5-s response files through out the slew time plus single time preiod for the non-slew times, and weighted by the total counts in the corresponding time period using addrmf. An average response file is needed becuase a spectral fit using the pre-slew DRM will introduce some errors in both a spectral shape and a normalization if the PHA file contains a lot of the slew/post-slew time interval.
- 3) For fits to more complicated models (e.g. a power-law over a cutoff power-law), the BAT team has decided to require a chi-square improvement of more than 6 for each extra dof.
Time averaged spectrum fit using the average DRM
Power-law model

Time interval is from   -0.780 sec. to    6.632 sec.

Spectral model in power-law:
------------------------------------------------------------
Parameters  : value       lower 90%   higher 90%
Photon index: 1.07922     ( -0.121793   0.119947 )
Norm@50keV  : 6.72200E-03    ( -0.000454734   0.000454571 )
------------------------------------------------------------
#Fit statistic : Chi-Squared =          40.55 using 59 PHA bins.
# Reduced chi-squared =         0.7114 for     57 degrees of freedom
# Null hypothesis probability =   9.511406e-01

Photon flux (15-150 keV)    in 7.412 sec: 0.778214 ( -0.053654  0.0537061 ) ph/cm2/s
Energy fluence (15-150 keV)             : 5.24415e-07 ( -3.99769e-08  4.02447e-08 ) ergs/cm2
Cutoff power-law model
Time interval is from   -0.780 sec. to    6.632 sec.
Spectral model in the cutoff power-law:
------------------------------------------------------------
Parameters  : value       lower 90%   higher 90%
Photon index: 0.926329     ( -0.506959   0.21287 )
Epeak [keV] : 375.339      ( -375.408 -375.408 )
Norm@50keV  : 7.95777E-03    ( -0.00161933   0.00574543 )
------------------------------------------------------------
#Fit statistic : Chi-Squared =          40.24 using 59 PHA bins.
# Reduced chi-squared =         0.7185 for     56 degrees of freedom
# Null hypothesis probability =   9.444286e-01

Photon flux (15-150 keV)    in 7.412 sec: 0.773058 ( -0.055984  0.055624 ) ph/cm2/s
Energy fluence (15-150 keV)             : 5.18612e-07 ( -4.4787e-08  4.3862e-08 ) ergs/cm2
Band function
Time interval is from   -0.780 sec. to    6.632 sec.

Spectral model in the Band function:
------------------------------------------------------------
Parameters  : value       lower 90%   higher 90%
alpha       : 5.29570E-03   ( 0.195254   0.195254 )
beta        : -1.22874    ( 1.22796   0.210652 )
Epeak [keV] : 71.0154      ( -70.3424 257.89 )
Norm@50keV   : 2.87796E-02    ( -0.0303549   81.0116 )
------------------------------------------------------------
#Fit statistic : Chi-Squared =          38.16 using 59 PHA bins.
# Reduced chi-squared =         0.6939 for     55 degrees of freedom
# Null hypothesis probability =   9.591570e-01

Photon flux (15-150 keV)    in 7.412 sec:  (    ) ph/cm2/s
Energy fluence (15-150 keV)             : 0 ( 0  0 ) ergs/cm2
Single BB
Spectral model blackbody:
------------------------------------------------------------
Parameters  : value    Lower 90%  Upper 90%
kT [keV]    : 19.0407  (-1.77118  2.04401)
R^2/D10^2   : 4.25782E-02  (-0.011932   0.0159262)
(R is the radius in km and D10 is the distance to the source in units of 10 kpc)
------------------------------------------------------------
#Fit statistic : Chi-Squared =          77.61 using 59 PHA bins.
# Reduced chi-squared =          1.362 for     57 degrees of freedom
# Null hypothesis probability =   3.612812e-02

Energy  Fluence     90% Error
[keV]   [erg/cm2]   [erg/cm2]
15- 25  2.247e-08   3.057e-09
25- 50  1.083e-07   1.030e-08
50-150  2.885e-07   3.862e-08
15-150  4.193e-07   3.632e-08
Thermal bremsstrahlung (OTTB)

Spectral model: thermal bremsstrahlung
------------------------------------------------------------
Parameters  : value         Lower 90%    Upper 90%
kT [keV]    : 200.000       (      )
Norm        : 3.15585       (-0.220639     0.220625)
------------------------------------------------------------
#Fit statistic : Chi-Squared =          79.81 using 59 PHA bins.
# Reduced chi-squared =          1.400 for     57 degrees of freedom
# Null hypothesis probability =   2.474877e-02

Energy  Fluence     90% Error
[keV]   [erg/cm2]   [erg/cm2]
15- 25  5.826e-08   4.866e-09
25- 50  1.121e-07   1.553e-08
50-150  2.458e-07   8.561e-08
15-150  4.161e-07   1.051e-07
Double BB

------------------------------------------------------------
Parameters  : value         Lower 90%    Upper 90%
kT1 [keV]   : 11.8016        (      )
R1^2/D10^2  : 0.150275        (-0.0490722      0.120041)
kT2 [keV]   : 87.5258        (-48.0125      -87.5243)
R2^2/D10^2  : 5.05380E-04    (-0.000347968   0.00291571)
------------------------------------------------------------
#Fit statistic : Chi-Squared =          38.10 using 59 PHA bins.
#Fit statistic : Chi-Squared =          35.49 using 59 PHA bins.
# Reduced chi-squared =         0.6927 for     55 degrees of freedom
# Reduced chi-squared =         0.6452 for     55 degrees of freedom
# Null hypothesis probability =   9.598418e-01
# Null hypothesis probability =   9.810386e-01

Energy  Fluence     90% Error
[keV]   [erg/cm2]   [erg/cm2]
15- 25  3.649e-08   1.441e-08
25- 50  1.115e-07   3.387e-08
50-150  3.501e-07   1.677e-07
15-150  4.981e-07   2.085e-07
Peak spectrum fit
Power-law model
Time interval is from   -0.256 sec. to    0.744 sec.

Spectral model in power-law:
------------------------------------------------------------
Parameters  : value       lower 90%   higher 90%
Photon index: 1.05757     ( -0.187243   0.183376 )
Norm@50keV  : 1.23515E-02    ( -0.00131697   0.00131692 )
------------------------------------------------------------
#Fit statistic : Chi-Squared =          70.54 using 59 PHA bins.
# Reduced chi-squared =          1.237 for     57 degrees of freedom
# Null hypothesis probability =   1.073420e-01

Photon flux (15-150 keV)    in 1 sec: 1.42739 ( -0.153238  0.153318 ) ph/cm2/s
Energy fluence (15-150 keV)             : 1.3094e-07 ( -1.6111e-08  1.63096e-08 ) ergs/cm2
Cutoff power-law model

Time interval is from   -0.256 sec. to    0.744 sec.
Spectral model in the cutoff power-law:
------------------------------------------------------------
Parameters  : value       lower 90%   higher 90%
Photon index: 0.721329     ( -0.8026   0.428887 )
Epeak [keV] : 197.292      ( -197.38 -197.38 )
Norm@50keV  : 1.80932E-02    ( -0.00723223   0.0256789 )
------------------------------------------------------------
#Fit statistic : Chi-Squared =          69.85 using 59 PHA bins.
# Reduced chi-squared =          1.247 for     56 degrees of freedom
# Null hypothesis probability =   1.010006e-01

Photon flux (15-150 keV)    in 1 sec: 1.40830 ( -0.15878  0.15816 ) ph/cm2/s
Energy fluence (15-150 keV)             : 1.27268e-07 ( -1.8316e-08  1.7992e-08 ) ergs/cm2
Band function

Time interval is from   -0.256 sec. to    0.744 sec.

Spectral model in the Band function:
------------------------------------------------------------
Parameters  : value       lower 90%   higher 90%
alpha       : 5.00000   ( -3.35604   -5 )
beta        : -1.17857    ( -0.227259   0.218022 )
Epeak [keV] : 28.5239      ( -9.55174 22.094 )
Norm@50keV   : 428.230    ( -45.3746   4115.3 )
------------------------------------------------------------
#Fit statistic : Chi-Squared =          67.57 using 59 PHA bins.
# Reduced chi-squared =          1.229 for     55 degrees of freedom
# Null hypothesis probability =   1.188792e-01

Photon flux (15-150 keV)    in 1 sec:  (    ) ph/cm2/s
Energy fluence (15-150 keV)             : 0 ( 0  0 ) ergs/cm2
Single BB
Spectral model blackbody:
------------------------------------------------------------
Parameters  : value    Lower 90%  Upper 90%
kT [keV]    : 18.6995  (-2.66948  3.33054)
R^2/D10^2   : 8.35100E-02  (-0.0339361   0.0538771)
(R is the radius in km and D10 is the distance to the source in units of 10 kpc)
------------------------------------------------------------
#Fit statistic : Chi-Squared =          83.85 using 59 PHA bins.
# Reduced chi-squared =          1.471 for     57 degrees of freedom
# Null hypothesis probability =   1.183537e-02

Energy  Fluence     90% Error
[keV]   [erg/cm2]   [erg/cm2]
15- 25  5.772e-09   1.237e-09
25- 50  2.745e-08   4.695e-09
50-150  7.031e-08   1.445e-08
15-150  1.035e-07   1.717e-08
Thermal bremsstrahlung (OTTB)
Spectral model: thermal bremsstrahlung
------------------------------------------------------------
Parameters  : value         Lower 90%    Upper 90%
kT [keV]    : 200.000       (      )
Norm        : 5.61003       (-0.625896     0.625896)
------------------------------------------------------------
#Fit statistic : Chi-Squared =          87.46 using 59 PHA bins.
# Reduced chi-squared =          1.534 for     57 degrees of freedom
# Null hypothesis probability =   5.851134e-03

Energy  Fluence     90% Error
[keV]   [erg/cm2]   [erg/cm2]
15- 25  1.406e-08   7.765e-09
25- 50  2.705e-08   1.484e-08
50-150  5.933e-08   3.268e-08
15-150  1.004e-07   5.510e-08
Double BB
Spectral model: bbodyrad<1> + bbodyrad<2>
------------------------------------------------------------
Parameters  : value         Lower 90%    Upper 90%
kT1 [keV]   : 9.94708        (-3.38561      3.97823)
R1^2/D10^2  : 0.406443        (-0.237466      0.864737)
kT2 [keV]   : 42.8123        (-17.7473      -43.4074)
R2^2/D10^2  : 5.03132E-03    (-0.00476782   0.0209034)
------------------------------------------------------------
#Fit statistic : Chi-Squared =          68.16 using 59 PHA bins.
# Reduced chi-squared =          1.239 for     55 degrees of freedom
# Null hypothesis probability =   1.095751e-01

Energy  Fluence     90% Error
[keV]   [erg/cm2]   [erg/cm2]
15- 25  9.308e-09   4.685e-09
25- 50  2.805e-08   1.381e-08
50-150  9.198e-08   4.953e-08
15-150  1.293e-07   6.365e-08
Pre-slew spectrum (Pre-slew PHA with pre-slew DRM)
Power-law model

Spectral model in power-law:
------------------------------------------------------------
Parameters  : value       lower 90%   higher 90%
Photon index: 1.07922     ( -0.121793   0.119947 )
Norm@50keV  : 6.72200E-03    ( -0.000454734   0.000454571 )
------------------------------------------------------------
#Fit statistic : Chi-Squared =          40.55 using 59 PHA bins.
# Reduced chi-squared =         0.7114 for     57 degrees of freedom
# Null hypothesis probability =   9.511406e-01

Photon flux (15-150 keV)    in 7.412 sec: 0.778214 ( -0.053654  0.0537061 ) ph/cm2/s
Energy fluence (15-150 keV)             : 5.24415e-07 ( -3.99769e-08  4.02447e-08 ) ergs/cm2
Cutoff power-law model

Spectral model in the cutoff power-law:
------------------------------------------------------------
Parameters  : value       lower 90%   higher 90%
Photon index: 0.926329     ( -0.506959   0.21287 )
Epeak [keV] : 375.339      ( -375.408 -375.408 )
Norm@50keV  : 7.95777E-03    ( -0.00161933   0.00574543 )
------------------------------------------------------------
#Fit statistic : Chi-Squared =          40.24 using 59 PHA bins.
# Reduced chi-squared =         0.7185 for     56 degrees of freedom
# Null hypothesis probability =   9.444286e-01

Photon flux (15-150 keV)    in 7.412 sec: 0.773058 ( -0.055984  0.055624 ) ph/cm2/s
Energy fluence (15-150 keV)             : 5.18612e-07 ( -4.4787e-08  4.3862e-08 ) ergs/cm2
Band function

Spectral model in the Band function:
------------------------------------------------------------
Parameters  : value       lower 90%   higher 90%
alpha       : 5.29570E-03   ( 0.195254   0.195254 )
beta        : -1.22874    ( 1.22796   0.210652 )
Epeak [keV] : 71.0154      ( -70.3424 257.938 )
Norm@50keV   : 2.87796E-02    ( -0.0303549   81.0309 )
------------------------------------------------------------
#Fit statistic : Chi-Squared =          38.16 using 59 PHA bins.
# Reduced chi-squared =         0.6939 for     55 degrees of freedom
# Null hypothesis probability =   9.591570e-01

Photon flux (15-150 keV)    in 7.412 sec:  (    ) ph/cm2/s
Energy fluence (15-150 keV)             : 0 ( 0  0 ) ergs/cm2
S(25-50 keV) vs. S(50-100 keV) plot
S(25-50 keV)  = 1.02e-07
S(50-100 keV) = 1.94e-07
T90 vs. Hardness ratio plot
T90                                   = 6.6479999423027 sec.
Hardness ratio (energy fluence ratio) = 1.90196
Color vs. Color plot

Count Ratio  (25-50 keV) / (15-25 keV) = 1.84349
Count Ratio (50-100 keV) / (15-25 keV) = 1.62673
Mask shadow pattern

IMX = 4.691906941692836E-02, IMY = 3.091151598307949E-01
TIME vs. PHA plot around the trigger time
Blue+Cyan dotted lines: Time interval of the scaled map
From 0.000000 to 1.024000
TIME vs. DetID plot around the trigger time
Blue+Cyan dotted lines: Time interval of the scaled map
From 0.000000 to 1.024000
100 us light curve (15-350 keV)
Blue+Cyan dotted lines: Time interval of the scaled map
From 0.000000 to 1.024000
Spacecraft aspect plot
Bright source in the pre-burst/pre-slew/post-slew images
Pre-burst image of 15-350 keV band
Time interval of the image:
-239.584000 -0.780000

# RAcent  DECcent POSerr Theta    Phi  PeakCts   SNR AngSep     Name
#  [deg]    [deg]    ['] [deg]  [deg]                   [']
135.6842 -40.5432    5.0  49.8 -143.1   1.3426   2.3    7.1	Vela X-1
336.4722 -44.3801    2.3  51.4   -3.5   2.2221   5.1 ------	UNKNOWN
320.8355 -54.9312    2.3  51.2  -22.2   2.3076   5.0 ------	UNKNOWN
270.4519 -78.2937    3.8  44.5  -60.4   2.8168   3.1 ------	UNKNOWN
Pre-slew background subtracted image of 15-350 keV band
Time interval of the image:
-0.780000 6.632000

# RAcent  DECcent POSerr Theta    Phi  PeakCts   SNR AngSep     Name
#  [deg]    [deg]    ['] [deg]  [deg]                   [']
135.4026 -40.6125 1293.1  49.6 -143.3  -0.0009  -0.0    6.7	Vela X-1
 72.6217 -72.5273    0.5  17.4  -81.4   0.7817  23.7 ------	UNKNOWN
 95.2771 -65.5434    2.5  19.3 -114.9   0.1401   4.5 ------	UNKNOWN
323.7758 -78.3246    2.4  37.0  -49.3   0.2449   4.8 ------	UNKNOWN
302.7155 -57.6242    2.4  55.8  -33.8   0.7918   4.9 ------	UNKNOWN
Post-slew image of 15-350 keV band
Time interval of the image:
276.716600 832.916600

# RAcent  DECcent POSerr Theta    Phi  PeakCts   SNR AngSep     Name
#  [deg]    [deg]    ['] [deg]  [deg]                   [']
144.6345  14.6371    2.3  44.1    7.7   2.7346   5.1 ------	UNKNOWN
Plot creation:
Sun May 31 02:41:44 EDT 2015