Click here for the BAT GCN circular template
Image
Pre-slew 15.0-350.0 keV image (Event data)

#   RAcent    DECcent   POSerr    Theta     Phi              Peak Cts       SNR   Name
  208.7263    47.3910   0.0254    21.6965  -131.6940         0.9175478      7.559 TRIG_00374875

Foreground time interval of the image:
 -1.480  73.501 (delta_t =  74.981 [sec])
Background time interval of the image:
-138.099  -1.480 (delta_t = 136.619 [sec])
Lightcurves
Notes:
- 1) The mask-weighted light curves are using the flight position.
- 2) Multiple plots of different time binning/intervals are shown to cover all scenarios of short/long GRBs, rate/image triggers, and real/false positives.
- 3) For all the mask-weighted lightcurves, the y-axis units are counts/sec/det where a det is 0.4 x 0.4 = 0.16 sq cm.
- 4) The verticle lines correspond to following: green dotted lines are T50 interval, black dotted lines are T90 interval, blue solid line(s) is a spacecraft slew start time, and orange solid line(s) is a spacecraft slew end time.
- 5) Time of each bin is in the middle of the bin.
1 s binning
From T0-310 s to T0+310 s

From T100_start - 20 s to T100_end + 30 s
Full time interval

64 ms binning
Full time interval

From T100_start to T100_end

From T0-5 sec to T0+5 sec

16 ms binning
From T100_start-5 s to T100_start+5 s
8 ms binning
From T100_start-3 s to T100_start+3 s

2 ms binning
From T100_start-1 s to T100_start+1 s

SN=5 or 10 sec. binning (whichever binning is satisfied first)
SN=5 or 10 sec. binning (T < 200 sec)
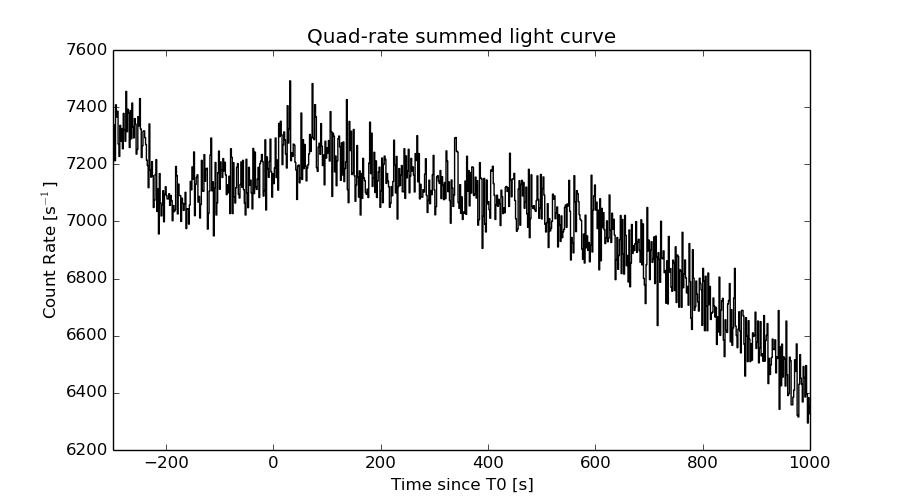
Quad-rate summed light curves (from T0-300s to T0+1000s)
Spectral Evolution

Spectra
Notes:
- 1) The fitting includes the systematic errors.
- 2) When the burst includes telescope slew time periods, the fitting uses an average response file made from multiple 5-s response files through out the slew time plus single time preiod for the non-slew times, and weighted by the total counts in the corresponding time period using addrmf. An average response file is needed becuase a spectral fit using the pre-slew DRM will introduce some errors in both a spectral shape and a normalization if the PHA file contains a lot of the slew/post-slew time interval.
- 3) For fits to more complicated models (e.g. a power-law over a cutoff power-law), the BAT team has decided to require a chi-square improvement of more than 6 for each extra dof.
Time averaged spectrum fit using the average DRM
Power-law model

Time interval is from   -1.480 sec. to  120.520 sec.

Spectral model in power-law:
------------------------------------------------------------
Parameters  : value       lower 90%   higher 90%
Photon index: 1.73428     ( -0.231102   0.243094 )
Norm@50keV  : 6.75801E-04    ( -0.000104063   0.000101461 )
------------------------------------------------------------
#Fit statistic : Chi-Squared =          54.28 using 59 PHA bins.
# Reduced chi-squared =         0.9522 for     57 degrees of freedom
# Null hypothesis probability =   5.779072e-01

Photon flux (15-150 keV)    in 122 sec: 9.08559E-02 ( -0.011656  0.0116565 ) ph/cm2/s
Energy fluence (15-150 keV)             : 7.61459e-07 ( -1.20256e-07  1.23728e-07 ) ergs/cm2
Cutoff power-law model

Time interval is from   -1.480 sec. to  120.520 sec.
Spectral model in the cutoff power-law:
------------------------------------------------------------
Parameters  : value       lower 90%   higher 90%
Photon index: 1.11857     ( -1.24906   0.508622 )
Epeak [keV] : 62.2644      ( -15.9871 -62.2649 )
Norm@50keV  : 1.49876E-03    ( -0.000880167   0.00598887 )
------------------------------------------------------------
#Fit statistic : Chi-Squared =          53.19 using 59 PHA bins.
# Reduced chi-squared =         0.9499 for     56 degrees of freedom
# Null hypothesis probability =   5.817401e-01

Photon flux (15-150 keV)    in 122 sec: 8.85394E-02 ( -0.0122267  0.0122336 ) ph/cm2/s
Energy fluence (15-150 keV)             : 7.11722e-07 ( -1.35886e-07  1.46787e-07 ) ergs/cm2
Band function
Time interval is from   -1.480 sec. to  120.520 sec.

Spectral model in the Band function:
------------------------------------------------------------
Parameters  : value       lower 90%   higher 90%
alpha       : -1.17725   ( 1.10754   1.10754 )
beta        : -2.23251    ( 2.30212   0.741065 )
Epeak [keV] : 64.2095      ( -59.4296 -59.4296 )
Norm@50keV   : 1.38629E-03    ( -0.000984032   0 )
------------------------------------------------------------
#Fit statistic : Chi-Squared =          53.12 using 59 PHA bins.
# Reduced chi-squared =         0.9658 for     55 degrees of freedom
# Null hypothesis probability =   5.467226e-01

Photon flux (15-150 keV)    in 122 sec:  (    ) ph/cm2/s
Energy fluence (15-150 keV)             : 0 ( 0  0 ) ergs/cm2
Single BB

Spectral model blackbody:
------------------------------------------------------------
Parameters  : value    Lower 90%  Upper 90%
kT [keV]    : 11.7729  (-1.67169  1.96548)
R^2/D10^2   : 2.38422E-02  (-0.0102633   0.0177995)
(R is the radius in km and D10 is the distance to the source in units of 10 kpc)
------------------------------------------------------------
#Fit statistic : Chi-Squared =          62.26 using 59 PHA bins.
# Reduced chi-squared =          1.092 for     57 degrees of freedom
# Null hypothesis probability =   2.944384e-01

Energy  Fluence     90% Error
[keV]   [erg/cm2]   [erg/cm2]
15- 25  8.511e-08   1.937e-08
25- 50  2.619e-07   4.911e-08
50-150  2.154e-07   7.283e-08
15-150  5.624e-07   1.033e-07
Thermal bremsstrahlung (OTTB)

Spectral model: thermal bremsstrahlung
------------------------------------------------------------
Parameters  : value         Lower 90%    Upper 90%
kT [keV]    : 116.475       (-46.98      -112.621)
Norm        : 0.384034       (-0.0589024     0.0819951)
------------------------------------------------------------
#Fit statistic : Chi-Squared =          53.35 using 59 PHA bins.
# Reduced chi-squared =         0.9359 for     57 degrees of freedom
# Null hypothesis probability =   6.128957e-01

Energy  Fluence     90% Error
[keV]   [erg/cm2]   [erg/cm2]
15- 25  1.222e-07   2.409e-08
25- 50  2.174e-07   5.063e-08
50-150  3.823e-07   2.150e-07
15-150  7.219e-07   2.993e-07
Double BB

Spectral model: bbodyrad<1> + bbodyrad<2>
------------------------------------------------------------
Parameters  : value         Lower 90%    Upper 90%
kT1 [keV]   : 4.01323        (-2.02609      3.67219)
R1^2/D10^2  : 0.693978        (-0.622354      36.6463)
kT2 [keV]   : 15.2806        (-3.20053      8.8176)
R2^2/D10^2  : 7.95416E-03    (-0.00679618   0.0121109)
------------------------------------------------------------
#Fit statistic : Chi-Squared =          53.02 using 59 PHA bins.
# Reduced chi-squared =         0.9641 for     55 degrees of freedom
# Null hypothesis probability =   5.504925e-01

Energy  Fluence     90% Error
[keV]   [erg/cm2]   [erg/cm2]
15- 25  1.255e-07   6.408e-08
25- 50  2.196e-07   1.041e-07
50-150  3.065e-07   1.743e-07
15-150  6.516e-07   2.995e-07
Peak spectrum fit
Power-law model
Time interval is from   83.336 sec. to   84.336 sec.

Spectral model in power-law:
------------------------------------------------------------
Parameters  : value       lower 90%   higher 90%
Photon index: 0.994593     ( -0.597466   0.536724 )
Norm@50keV  : 3.12938E-03    ( -0.00103596   0.00102075 )
------------------------------------------------------------
#Fit statistic : Chi-Squared =          57.99 using 59 PHA bins.
# Reduced chi-squared =          1.017 for     57 degrees of freedom
# Null hypothesis probability =   4.386239e-01

Photon flux (15-150 keV)    in 1 sec: 0.360403 ( -0.119488  0.120614 ) ph/cm2/s
Energy fluence (15-150 keV)             : 3.39062e-08 ( -1.15004e-08  1.17252e-08 ) ergs/cm2
Cutoff power-law model
Time interval is from   83.336 sec. to   84.336 sec.
Spectral model in the cutoff power-law:
------------------------------------------------------------
Parameters  : value       lower 90%   higher 90%
Photon index: -0.950238     ( -6.75561   2.48849 )
Epeak [keV] : 86.9550      (   )
Norm@50keV  : 2.12135E-02    (     )
------------------------------------------------------------
#Fit statistic : Chi-Squared =          56.58 using 59 PHA bins.
# Reduced chi-squared =          1.010 for     56 degrees of freedom
# Null hypothesis probability =   4.532762e-01

Photon flux (15-150 keV)    in 1 sec: 0.326361 ( -0.128447  0.131511 ) ph/cm2/s
Energy fluence (15-150 keV)             : 3.04218e-08 ( -1.19318e-08  1.29203e-08 ) ergs/cm2
Band function

Time interval is from   83.336 sec. to   84.336 sec.

Spectral model in the Band function:
------------------------------------------------------------
Parameters  : value       lower 90%   higher 90%
alpha       : 0.869495   ( -2.00733   -0.869495 )
beta        : -9.17701    ( 8.97204   8.97204 )
Epeak [keV] : 88.8555      ( -29.9684 202.915 )
Norm@50keV   : 1.97584E-02    ( -0.0198118   13.4828 )
------------------------------------------------------------
#Fit statistic : Chi-Squared =          56.58 using 59 PHA bins.
# Reduced chi-squared =          1.029 for     55 degrees of freedom
# Null hypothesis probability =   4.157142e-01

Photon flux (15-150 keV)    in 1 sec:  (    ) ph/cm2/s
Energy fluence (15-150 keV)             : 0 ( 0  0 ) ergs/cm2
Single BB
Spectral model blackbody:
------------------------------------------------------------
Parameters  : value    Lower 90%  Upper 90%
kT [keV]    : 21.0385  (-6.1961  11.3238)
R^2/D10^2   : 1.53354E-02  (-0.0153354   0.0327934)
(R is the radius in km and D10 is the distance to the source in units of 10 kpc)
------------------------------------------------------------
#Fit statistic : Chi-Squared =          56.58 using 59 PHA bins.
# Reduced chi-squared =         0.9926 for     57 degrees of freedom
# Null hypothesis probability =   4.909045e-01

Energy  Fluence     90% Error
[keV]   [erg/cm2]   [erg/cm2]
15- 25  1.281e-09   8.190e-10
25- 50  6.594e-09   3.948e-09
50-150  2.176e-08   1.421e-08
15-150  2.963e-08   1.812e-08
Thermal bremsstrahlung (OTTB)
Spectral model: thermal bremsstrahlung
------------------------------------------------------------
Parameters  : value         Lower 90%    Upper 90%
kT [keV]    : 199.362       (-99.755      -199.363)
Norm        : 1.48738       (-0.501602     0.501591)
------------------------------------------------------------
#Fit statistic : Chi-Squared =          60.57 using 59 PHA bins.
# Reduced chi-squared =          1.063 for     57 degrees of freedom
# Null hypothesis probability =   3.485031e-01

Energy  Fluence     90% Error
[keV]   [erg/cm2]   [erg/cm2]
15- 25  3.704e-09   2.329e-09
25- 50  7.125e-09   4.562e-09
50-150  1.562e-08   9.905e-09
15-150  2.645e-08   1.614e-08
Double BB
R1^2/D10^2  : 5.67843E+06        (      )
kT2 [keV]   : 21.8542        (-6.57504      12.269)
R2^2/D10^2  : 1.33963E-02    (   )
------------------------------------------------------------
#Fit statistic : Chi-Squared =          55.64 using 59 PHA bins.
#Fit statistic : Chi-Squared =          55.46 using 59 PHA bins.
#Fit statistic : Chi-Squared =          55.43 using 59 PHA bins.
# Reduced chi-squared =          1.012 for     55 degrees of freedom
# Reduced chi-squared =          1.008 for     55 degrees of freedom
# Reduced chi-squared =          1.008 for     55 degrees of freedom
# Null hypothesis probability =   4.506415e-01
# Null hypothesis probability =   4.571238e-01
# Null hypothesis probability =   4.582630e-01

Energy  Fluence     90% Error
[keV]   [erg/cm2]   [erg/cm2]
15- 25  1.582e-09   7.995e-10
25- 50  6.303e-09   3.867e-09
50-150  2.215e-08   1.450e-08
15-150  3.004e-08   1.903e-08
Pre-slew spectrum (Pre-slew PHA with pre-slew DRM)
Power-law model

Spectral model in power-law:
------------------------------------------------------------
Parameters  : value       lower 90%   higher 90%
Photon index: 1.73619     ( -0.282542   0.301358 )
Norm@50keV  : 7.07021E-04    ( -0.000137329   0.0001333 )
------------------------------------------------------------
#Fit statistic : Chi-Squared =          55.18 using 59 PHA bins.
# Reduced chi-squared =         0.9680 for     57 degrees of freedom
# Null hypothesis probability =   5.437457e-01

Photon flux (15-150 keV)    in 74.98 sec: 9.51190E-02 ( -0.0153114  0.0153115 ) ph/cm2/s
Energy fluence (15-150 keV)             : 4.89571e-07 ( -9.66042e-08  1.00189e-07 ) ergs/cm2
Cutoff power-law model
Spectral model in the cutoff power-law:
------------------------------------------------------------
Parameters  : value       lower 90%   higher 90%
Photon index: 0.634349     ( -1.86573   1.29001 )
Epeak [keV] : 52.7764      ( -11.0448 -52.7536 )
Norm@50keV  : 2.98578E-03    ( -0.00299643   0.0303666 )
------------------------------------------------------------
#Fit statistic : Chi-Squared =          53.42 using 59 PHA bins.
# Reduced chi-squared =         0.9539 for     56 degrees of freedom
# Null hypothesis probability =   5.732804e-01

Photon flux (15-150 keV)    in 74.98 sec: 9.11532E-02 ( -0.0159839  0.0160948 ) ph/cm2/s
Energy fluence (15-150 keV)             : 4.36159e-07 ( -9.9509e-08  1.18901e-07 ) ergs/cm2
Band function
Spectral model in the Band function:
------------------------------------------------------------
Parameters  : value       lower 90%   higher 90%
alpha       : -0.647836   ( 0.943007   0.943007 )
beta        : -2.68554    ( 2.61605   3.71452 )
Epeak [keV] : 52.5161      ( -51.5936 42.7595 )
Norm@50keV   : 2.94586E-03    ( -0.00332604   58.2119 )
------------------------------------------------------------
#Fit statistic : Chi-Squared =          53.24 using 59 PHA bins.
# Reduced chi-squared =         0.9681 for     55 degrees of freedom
# Null hypothesis probability =   5.419708e-01

Photon flux (15-150 keV)    in 74.98 sec:  (    ) ph/cm2/s
Energy fluence (15-150 keV)             : 0 ( 0  0 ) ergs/cm2
S(25-50 keV) vs. S(50-100 keV) plot
S(25-50 keV)  = 2.09e-07
S(50-100 keV) = 2.51e-07
T90 vs. Hardness ratio plot

T90                                   = 107.135999917984 sec.
Hardness ratio (energy fluence ratio) = 1.20096
Color vs. Color plot
Count Ratio  (25-50 keV) / (15-25 keV) = 1.14313
Count Ratio (50-100 keV) / (15-25 keV) = 0.716817
Mask shadow pattern

IMX = -2.646494126456019E-01, IMY = 2.970982505726540E-01
TIME vs. PHA plot around the trigger time
TIME vs. DetID plot around the trigger time

100 us light curve (15-350 keV)
Spacecraft aspect plot
Bright source in the pre-burst/pre-slew/post-slew images
Pre-burst image of 15-350 keV band
Time interval of the image:
-138.099410 -1.480000

# RAcent  DECcent POSerr Theta    Phi  PeakCts   SNR AngSep     Name
#  [deg]    [deg]    ['] [deg]  [deg]                   [']
145.0597   2.3387    2.6  55.1    0.1   2.2305   4.4 ------	UNKNOWN
Pre-slew background subtracted image of 15-350 keV band
Time interval of the image:
-1.480000 73.500600

# RAcent  DECcent POSerr Theta    Phi  PeakCts   SNR AngSep     Name
#  [deg]    [deg]    ['] [deg]  [deg]                   [']
167.7263  31.4825    2.3  20.4  -18.5   0.4979   5.0 ------	UNKNOWN
208.7263  47.3910    1.5  21.7 -131.7   0.9175   7.6 ------	UNKNOWN
Post-slew image of 15-350 keV band
Time interval of the image:
120.300590 483.067200
661.000000 723.088800
841.000000 903.084100

# RAcent  DECcent POSerr Theta    Phi  PeakCts   SNR AngSep     Name
#  [deg]    [deg]    ['] [deg]  [deg]                   [']
254.6083  35.4354    6.4  35.8 -165.6   0.6653   1.8    9.2	Her X-1
143.0267  39.6708    3.3  46.8   27.8   2.9501   3.6 ------	UNKNOWN
156.3635  45.1356    2.6  35.6   28.2   1.8455   4.5 ------	UNKNOWN
259.4216  11.8119    3.1  55.2 -145.3   8.1710   3.7 ------	UNKNOWN
Plot creation:
Sun May 31 02:39:59 EDT 2015