Special notes of this burst
Image
Pre-slew 15.0-350.0 keV image (Event data)

#   RAcent    DECcent   POSerr    Theta     Phi              Peak Cts       SNR   Name
  112.7494   -54.0914   0.0081    31.9575  -174.8748         0.2720716     23.716 TRIG_00375409

Foreground time interval of the image:
 -0.004   0.332 (delta_t =   0.336 [sec])
Background time interval of the image:
-239.404  -0.004 (delta_t = 239.400 [sec])
Lightcurves
Notes:
- 1) The mask-weighted light curves are using the flight position.
- 2) Multiple plots of different time binning/intervals are shown to cover all scenarios of short/long GRBs, rate/image triggers, and real/false positives.
- 3) For all the mask-weighted lightcurves, the y-axis units are counts/sec/det where a det is 0.4 x 0.4 = 0.16 sq cm.
- 4) The verticle lines correspond to following: green dotted lines are T50 interval, black dotted lines are T90 interval, blue solid line(s) is a spacecraft slew start time, and orange solid line(s) is a spacecraft slew end time.
- 5) Time of each bin is in the middle of the bin.
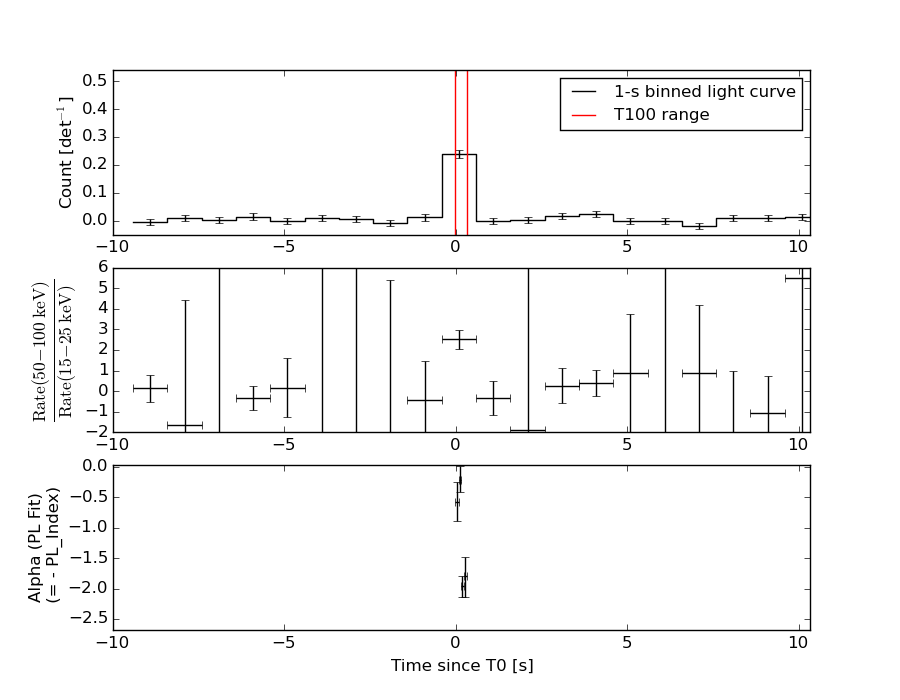
1 s binning
From T0-310 s to T0+310 s

From T100_start - 20 s to T100_end + 30 s

Full time interval

64 ms binning
Full time interval

From T100_start to T100_end

From T0-5 sec to T0+5 sec

16 ms binning
From T100_start-5 s to T100_start+5 s

Blue+Cyan dotted lines: Time interval of the scaled map
From 0.000000 to 0.064000
8 ms binning
From T100_start-3 s to T100_start+3 s

Blue+Cyan dotted lines: Time interval of the scaled map
From 0.000000 to 0.064000
2 ms binning
From T100_start-1 s to T100_start+1 s

Blue+Cyan dotted lines: Time interval of the scaled map
From 0.000000 to 0.064000
SN=5 or 10 sec. binning (whichever binning is satisfied first)

SN=5 or 10 sec. binning (T < 200 sec)

Quad-rate summed light curves (from T0-300s to T0+1000s)

Spectral Evolution
Spectra
Notes:
- 1) The fitting includes the systematic errors.
- 2) When the burst includes telescope slew time periods, the fitting uses an average response file made from multiple 5-s response files through out the slew time plus single time preiod for the non-slew times, and weighted by the total counts in the corresponding time period using addrmf. An average response file is needed becuase a spectral fit using the pre-slew DRM will introduce some errors in both a spectral shape and a normalization if the PHA file contains a lot of the slew/post-slew time interval.
- 3) For fits to more complicated models (e.g. a power-law over a cutoff power-law), the BAT team has decided to require a chi-square improvement of more than 6 for each extra dof.
Time averaged spectrum fit using the average DRM
Power-law model

Time interval is from   -0.004 sec. to    0.332 sec.

Spectral model in power-law:
------------------------------------------------------------
Parameters  : value       lower 90%   higher 90%
Photon index: 0.710257     ( -0.131777   0.127783 )
Norm@50keV  : 4.76927E-02    ( -0.00367889   0.00364937 )
------------------------------------------------------------
#Fit statistic : Chi-Squared =          54.20 using 59 PHA bins.
# Reduced chi-squared =         0.9509 for     57 degrees of freedom
# Null hypothesis probability =   5.806898e-01

Photon flux (15-150 keV)    in 0.336 sec: 5.50851 ( -0.408538  0.408852 ) ph/cm2/s
Energy fluence (15-150 keV)             : 1.94704e-07 ( -1.54774e-08  1.55276e-08 ) ergs/cm2
Cutoff power-law model

Time interval is from   -0.004 sec. to    0.332 sec.
Spectral model in the cutoff power-law:
------------------------------------------------------------
Parameters  : value       lower 90%   higher 90%
Photon index: 0.399876     ( -0.589152   0.436714 )
Epeak [keV] : 310.464      ( -310.473 -310.473 )
Norm@50keV  : 6.47158E-02    ( -0.0194969   0.0482301 )
------------------------------------------------------------
#Fit statistic : Chi-Squared =          53.20 using 59 PHA bins.
# Reduced chi-squared =         0.9500 for     56 degrees of freedom
# Null hypothesis probability =   5.816291e-01

Photon flux (15-150 keV)    in 0.336 sec: 5.46135 ( -0.41733  0.4165 ) ph/cm2/s
Energy fluence (15-150 keV)             : 1.92699e-07 ( -1.63057e-08  1.61018e-08 ) ergs/cm2
Band function

Time interval is from   -0.004 sec. to    0.332 sec.

Spectral model in the Band function:
------------------------------------------------------------
Parameters  : value       lower 90%   higher 90%
alpha       : 5.00000   ( -5   -5 )
beta        : -0.713353    ( -0.128294   0.132603 )
Epeak [keV] : 20.5288      ( -19.4024 -19.4024 )
Norm@50keV   : 7466.01    ( -399.418   4.65445e+06 )
------------------------------------------------------------
#Fit statistic : Chi-Squared =          54.12 using 59 PHA bins.
# Reduced chi-squared =         0.9841 for     55 degrees of freedom
# Null hypothesis probability =   5.081087e-01

Photon flux (15-150 keV)    in 0.336 sec:  (    ) ph/cm2/s
Energy fluence (15-150 keV)             : 0 ( 0  0 ) ergs/cm2
Single BB

Spectral model blackbody:
------------------------------------------------------------
Parameters  : value    Lower 90%  Upper 90%
kT [keV]    : 26.0776  (-2.6709  3.20087)
R^2/D10^2   : 0.126801  (-0.0361945   0.04766)
(R is the radius in km and D10 is the distance to the source in units of 10 kpc)
------------------------------------------------------------
#Fit statistic : Chi-Squared =          71.31 using 59 PHA bins.
# Reduced chi-squared =          1.251 for     57 degrees of freedom
# Null hypothesis probability =   9.615619e-02

Energy  Fluence     90% Error
[keV]   [erg/cm2]   [erg/cm2]
15- 25  4.920e-09   7.678e-10
25- 50  2.850e-08   3.125e-09
50-150  1.427e-07   1.781e-08
15-150  1.761e-07   1.806e-08
Thermal bremsstrahlung (OTTB)

Spectral model: thermal bremsstrahlung
------------------------------------------------------------
Parameters  : value         Lower 90%    Upper 90%
kT [keV]    : 199.363       (      )
Norm        : 20.2977       (     )
------------------------------------------------------------
#Fit statistic : Chi-Squared =         162.16 using 59 PHA bins.
# Reduced chi-squared =         2.8450 for     57 degrees of freedom
# Null hypothesis probability =   5.006927e-12

Energy  Fluence     90% Error
[keV]   [erg/cm2]   [erg/cm2]
15- 25  1.698e-08   2.518e-09
25- 50  3.267e-08   8.279e-09
50-150  7.165e-08   3.665e-08
15-150  1.213e-07   4.276e-08
Double BB

------------------------------------------------------------
Parameters  : value         Lower 90%    Upper 90%
kT1 [keV]   : 16.3380        (-5.25709      3.41358)
R1^2/D10^2  : 0.362139        (-0.119885      0.579647)
kT2 [keV]   : 199.591        (      )
R2^2/D10^2  : 1.05389E-03    (-0.000312973   0.0347488)
------------------------------------------------------------
#Fit statistic : Chi-Squared =          52.09 using 59 PHA bins.
#Fit statistic : Chi-Squared =          51.99 using 59 PHA bins.
# Reduced chi-squared =         0.9472 for     55 degrees of freedom
# Reduced chi-squared =         0.9453 for     55 degrees of freedom
# Null hypothesis probability =   5.863550e-01
# Null hypothesis probability =   5.903084e-01

Energy  Fluence     90% Error
[keV]   [erg/cm2]   [erg/cm2]
15- 25  7.362e-09   2.612e-09
25- 50  3.238e-08   1.393e-08
50-150  1.505e-07   9.250e-08
15-150  1.902e-07   1.036e-07
Peak spectrum fit
Power-law model
Time interval is from   -0.334 sec. to    0.666 sec.

Spectral model in power-law:
------------------------------------------------------------
Parameters  : value       lower 90%   higher 90%
Photon index: 0.768475     ( -0.174528   0.16731 )
Norm@50keV  : 1.64925E-02    ( -0.00162752   0.00160429 )
------------------------------------------------------------
#Fit statistic : Chi-Squared =          64.59 using 59 PHA bins.
# Reduced chi-squared =          1.133 for     57 degrees of freedom
# Null hypothesis probability =   2.286291e-01

Photon flux (15-150 keV)    in 1 sec: 1.89805 ( -0.180112  0.180767 ) ph/cm2/s
Energy fluence (15-150 keV)             : 1.9533e-07 ( -1.90302e-08  1.91162e-08 ) ergs/cm2
Cutoff power-law model

Time interval is from   -0.334 sec. to    0.666 sec.
Spectral model in the cutoff power-law:
------------------------------------------------------------
Parameters  : value       lower 90%   higher 90%
Photon index: 0.761133     ( -0.176406   0.168571 )
Epeak [keV] : 9999.36      ( -9999.36 -9999.36 )
Norm@50keV  : 1.66111E-02    ( -0.00153649   0.0162817 )
------------------------------------------------------------
#Fit statistic : Chi-Squared =          64.59 using 59 PHA bins.
# Reduced chi-squared =          1.153 for     56 degrees of freedom
# Null hypothesis probability =   2.016352e-01

Photon flux (15-150 keV)    in 1 sec: 1.89761 ( -0.18541  0.17998 ) ph/cm2/s
Energy fluence (15-150 keV)             : 1.95403e-07 ( -1.9583e-08  1.8936e-08 ) ergs/cm2
Band function

Time interval is from   -0.334 sec. to    0.666 sec.

Spectral model in the Band function:
------------------------------------------------------------
Parameters  : value       lower 90%   higher 90%
alpha       : -0.845381   ( 0.845381   0.845381 )
beta        : -0.768475    ( -0.167212   0.174734 )
Epeak [keV] : 15.5429      ( -15.5429 -15.5429 )
Norm@50keV   : 2.37552E-02    ( -0.00883934   0 )
------------------------------------------------------------
#Fit statistic : Chi-Squared =          64.59 using 59 PHA bins.
# Reduced chi-squared =          1.174 for     55 degrees of freedom
# Null hypothesis probability =   1.765019e-01

Photon flux (15-150 keV)    in 1 sec:  (    ) ph/cm2/s
Energy fluence (15-150 keV)             : 0 ( 0  0 ) ergs/cm2
Single BB

Spectral model blackbody:
------------------------------------------------------------
Parameters  : value    Lower 90%  Upper 90%
kT [keV]    : 26.3847  (-3.39096  4.31223)
R^2/D10^2   : 4.10984E-02  (-0.0146666   0.0209879)
(R is the radius in km and D10 is the distance to the source in units of 10 kpc)
------------------------------------------------------------
#Fit statistic : Chi-Squared =          79.99 using 59 PHA bins.
# Reduced chi-squared =          1.403 for     57 degrees of freedom
# Null hypothesis probability =   2.398009e-02

Energy  Fluence     90% Error
[keV]   [erg/cm2]   [erg/cm2]
15- 25  4.827e-09   1.013e-09
25- 50  2.812e-08   4.160e-09
50-150  1.438e-07   2.140e-08
15-150  1.767e-07   2.260e-08
Thermal bremsstrahlung (OTTB)

Spectral model: thermal bremsstrahlung
------------------------------------------------------------
Parameters  : value         Lower 90%    Upper 90%
kT [keV]    : 199.363       (      )
Norm        : 7.47904       (     )
------------------------------------------------------------
#Fit statistic : Chi-Squared =         123.56 using 59 PHA bins.
# Reduced chi-squared =         2.1677 for     57 degrees of freedom
# Null hypothesis probability =   8.048684e-07

Energy  Fluence     90% Error
[keV]   [erg/cm2]   [erg/cm2]
15- 25  1.862e-08   1.030e-08
25- 50  3.582e-08   1.650e-08
50-150  7.857e-08   4.275e-08
15-150  1.330e-07   7.180e-08
Double BB

------------------------------------------------------------
Parameters  : value         Lower 90%    Upper 90%
kT1 [keV]   : 15.6299        (-6.61372      4.75634)
R1^2/D10^2  : 0.139506        (-0.0714633      0.108717)
kT2 [keV]   : 200.000        (      )
R2^2/D10^2  : 3.73235E-04    (-0.00012465   7.9887e-05)
------------------------------------------------------------
#Fit statistic : Chi-Squared =          65.39 using 59 PHA bins.
#Fit statistic : Chi-Squared =          65.12 using 59 PHA bins.
# Reduced chi-squared =          1.189 for     55 degrees of freedom
# Reduced chi-squared =          1.184 for     55 degrees of freedom
# Null hypothesis probability =   1.593501e-01
# Null hypothesis probability =   1.651152e-01

Energy  Fluence     90% Error
[keV]   [erg/cm2]   [erg/cm2]
15- 25  7.821e-09   4.247e-09
25- 50  3.325e-08   1.730e-08
50-150  1.510e-07   1.124e-07
15-150  1.920e-07   1.363e-07
Pre-slew spectrum (Pre-slew PHA with pre-slew DRM)
Power-law model
Spectral model in power-law:
------------------------------------------------------------
Parameters  : value       lower 90%   higher 90%
Photon index: 0.710257     ( -0.131777   0.127783 )
Norm@50keV  : 4.76927E-02    ( -0.00367889   0.00364937 )
------------------------------------------------------------
#Fit statistic : Chi-Squared =          54.20 using 59 PHA bins.
# Reduced chi-squared =         0.9509 for     57 degrees of freedom
# Null hypothesis probability =   5.806898e-01

Photon flux (15-150 keV)    in 0.336 sec: 5.50851 ( -0.408538  0.408852 ) ph/cm2/s
Energy fluence (15-150 keV)             : 1.94704e-07 ( -1.54774e-08  1.55276e-08 ) ergs/cm2
Cutoff power-law model

Spectral model in the cutoff power-law:
------------------------------------------------------------
Parameters  : value       lower 90%   higher 90%
Photon index: 0.399876     ( -0.589152   0.436714 )
Epeak [keV] : 310.464      ( -310.473 -310.473 )
Norm@50keV  : 6.47158E-02    ( -0.0194969   0.0482301 )
------------------------------------------------------------
#Fit statistic : Chi-Squared =          53.20 using 59 PHA bins.
# Reduced chi-squared =         0.9500 for     56 degrees of freedom
# Null hypothesis probability =   5.816291e-01

Photon flux (15-150 keV)    in 0.336 sec: 5.46135 ( -0.41733  0.4165 ) ph/cm2/s
Energy fluence (15-150 keV)             : 1.92699e-07 ( -1.63057e-08  1.61018e-08 ) ergs/cm2
Band function

Spectral model in the Band function:
------------------------------------------------------------
Parameters  : value       lower 90%   higher 90%
alpha       : 5.00000   ( -5   -5 )
beta        : -0.713353    ( -0.128294   0.132603 )
Epeak [keV] : 20.5288      ( -19.4024 -19.4024 )
Norm@50keV   : 7466.01    ( -436.258   4.65445e+06 )
------------------------------------------------------------
#Fit statistic : Chi-Squared =          54.12 using 59 PHA bins.
# Reduced chi-squared =         0.9841 for     55 degrees of freedom
# Null hypothesis probability =   5.081087e-01

Photon flux (15-150 keV)    in 0.336 sec:  (    ) ph/cm2/s
Energy fluence (15-150 keV)             : 0 ( 0  0 ) ergs/cm2
S(25-50 keV) vs. S(50-100 keV) plot

S(25-50 keV)  = 2.94e-08
S(50-100 keV) = 7.19e-08
T90 vs. Hardness ratio plot

T90                                   = 0.271999955177307 sec.
Hardness ratio (energy fluence ratio) = 2.44558
Color vs. Color plot

Count Ratio  (25-50 keV) / (15-25 keV) = 2.35625
Count Ratio (50-100 keV) / (15-25 keV) = 2.97717
Mask shadow pattern

IMX = -6.213440742491267E-01, IMY = 5.572910654887778E-02
TIME vs. PHA plot around the trigger time

Blue+Cyan dotted lines: Time interval of the scaled map
From 0.000000 to 0.064000
TIME vs. DetID plot around the trigger time

Blue+Cyan dotted lines: Time interval of the scaled map
From 0.000000 to 0.064000
100 us light curve (15-350 keV)

Blue+Cyan dotted lines: Time interval of the scaled map
From 0.000000 to 0.064000
Spacecraft aspect plot

Bright source in the pre-burst/pre-slew/post-slew images
Pre-burst image of 15-350 keV band
Time interval of the image:
-239.404000 -0.004000

# RAcent  DECcent POSerr Theta    Phi  PeakCts   SNR AngSep     Name
#  [deg]    [deg]    ['] [deg]  [deg]                   [']
135.5532 -40.5544    1.4  51.8 -168.0   4.0370   8.0    1.1	Vela X-1
170.5960 -60.5919    8.4  45.7 -129.5   0.8915   1.4    8.5	Cen X-3
116.0482 -47.9734    3.0  38.0 -178.8   0.9571   3.9 ------	UNKNOWN
139.7758 -43.2276    2.4  51.1 -162.8   2.2457   4.9 ------	UNKNOWN
320.7932 -40.5525    2.5  52.9  -21.3   2.2270   4.6 ------	UNKNOWN
Pre-slew background subtracted image of 15-350 keV band
Time interval of the image:
-0.004000 0.332000

# RAcent  DECcent POSerr Theta    Phi  PeakCts   SNR AngSep     Name
#  [deg]    [deg]    ['] [deg]  [deg]                   [']
135.6189 -40.5281   53.3  51.9 -168.0   0.0052   0.2    4.4	Vela X-1
170.2537 -60.7571    5.2  45.5 -129.6  -0.0682  -2.2    8.3	Cen X-3
112.7494 -54.0914    0.5  32.0 -174.9   0.2721  23.7 ------	UNKNOWN
187.1926 -69.7116    2.5  40.6 -114.5   0.1242   4.6 ------	UNKNOWN
292.4982 -60.7538    2.2  44.6  -55.2   0.1841   5.3 ------	UNKNOWN
Post-slew image of 15-350 keV band
Time interval of the image:
62.096640 962.663700

# RAcent  DECcent POSerr Theta    Phi  PeakCts   SNR AngSep     Name
#  [deg]    [deg]    ['] [deg]  [deg]                   [']
135.5125 -40.5611    0.4  20.4 -150.0  14.6829  28.2    0.8	Vela X-1
170.3465 -60.5676    2.5  30.7  -82.1   3.4539   4.6    3.4	Cen X-3
186.6416 -62.7633    3.0  37.4  -74.1   5.9443   3.8    0.6	GX 301-2
 42.9070 -41.5904    3.8  46.4   47.9   6.9562   3.1 ------	UNKNOWN
 22.9112 -61.0408    3.1  44.8   15.7   3.3699   3.8 ------	UNKNOWN
353.5617 -58.9912    3.4  56.8    4.8  10.2064   3.4 ------	UNKNOWN
355.9480 -60.1459    3.7  55.2    5.1   7.3370   3.1 ------	UNKNOWN
 74.9433 -74.9525    3.0  25.5   -6.1   1.9494   3.9 ------	UNKNOWN
140.4742  -1.7463    2.8  57.1 -174.0  10.2911   4.1 ------	UNKNOWN
331.1273 -64.8917    5.3  57.4   -9.5   5.0496   2.2 ------	UNKNOWN
151.7463 -22.7179    2.7  42.9 -149.1   3.7722   4.3 ------	UNKNOWN
Plot creation:
Sun May 31 02:36:47 EDT 2015