Special notes of this burst
Image
Pre-slew 15.0-350.0 keV image (Event data)
#   RAcent    DECcent   POSerr    Theta     Phi              Peak Cts       SNR   Name
  257.7530   -36.7294   0.0110    39.3393  -139.8618         3.1261913     17.523 TRIG_00375659

Foreground time interval of the image:
-10.500  14.744 (delta_t =  25.244 [sec])
Background time interval of the image:
-41.035 -10.500 (delta_t =  30.535 [sec])
Lightcurves
Notes:
- 1) The mask-weighted light curves are using the flight position.
- 2) Multiple plots of different time binning/intervals are shown to cover all scenarios of short/long GRBs, rate/image triggers, and real/false positives.
- 3) For all the mask-weighted lightcurves, the y-axis units are counts/sec/det where a det is 0.4 x 0.4 = 0.16 sq cm.
- 4) The verticle lines correspond to following: green dotted lines are T50 interval, black dotted lines are T90 interval, blue solid line(s) is a spacecraft slew start time, and orange solid line(s) is a spacecraft slew end time.
- 5) Time of each bin is in the middle of the bin.
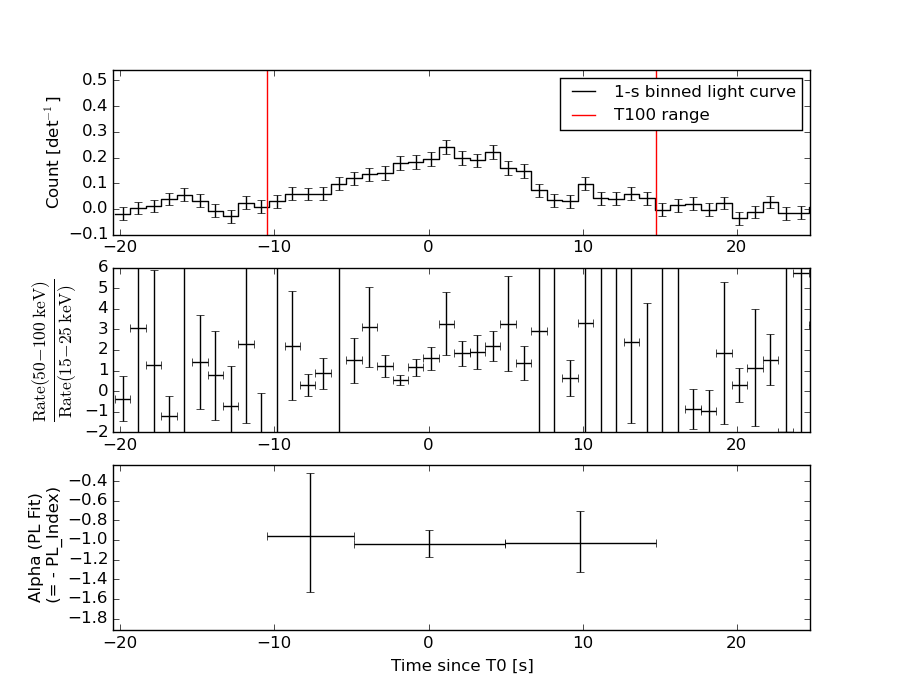
1 s binning
From T0-310 s to T0+310 s
From T100_start - 20 s to T100_end + 30 s
Full time interval
64 ms binning
Full time interval
From T100_start to T100_end
From T0-5 sec to T0+5 sec
16 ms binning
From T100_start-5 s to T100_start+5 s
Blue+Cyan dotted lines: Time interval of the scaled map
From 0.000000 to 1.024000
8 ms binning
From T100_start-3 s to T100_start+3 s
Blue+Cyan dotted lines: Time interval of the scaled map
From 0.000000 to 1.024000
2 ms binning
From T100_start-1 s to T100_start+1 s
Blue+Cyan dotted lines: Time interval of the scaled map
From 0.000000 to 1.024000
SN=5 or 10 sec. binning (whichever binning is satisfied first)
SN=5 or 10 sec. binning (T < 200 sec)
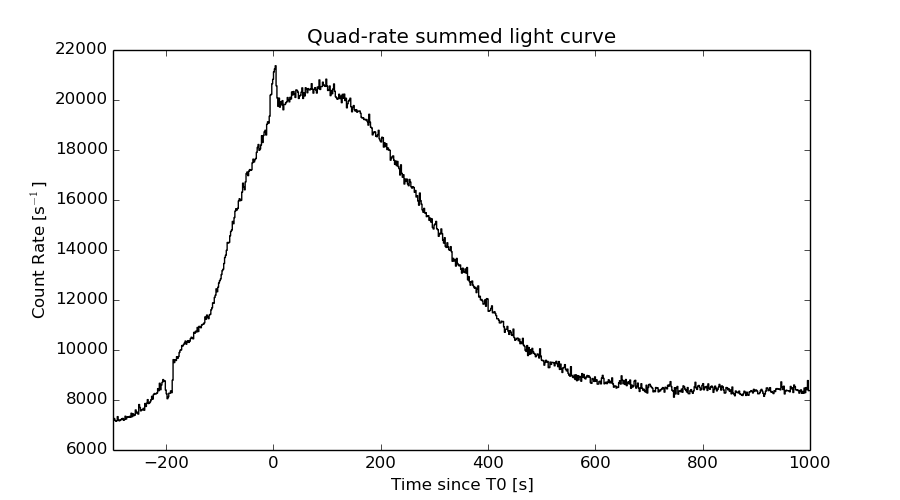
Quad-rate summed light curves (from T0-300s to T0+1000s)
Spectral Evolution
Spectra
Notes:
- 1) The fitting includes the systematic errors.
- 2) When the burst includes telescope slew time periods, the fitting uses an average response file made from multiple 5-s response files through out the slew time plus single time preiod for the non-slew times, and weighted by the total counts in the corresponding time period using addrmf. An average response file is needed becuase a spectral fit using the pre-slew DRM will introduce some errors in both a spectral shape and a normalization if the PHA file contains a lot of the slew/post-slew time interval.
- 3) For fits to more complicated models (e.g. a power-law over a cutoff power-law), the BAT team has decided to require a chi-square improvement of more than 6 for each extra dof.
Time averaged spectrum fit using the average DRM
Power-law model
Time interval is from  -10.500 sec. to   14.744 sec.

Spectral model in power-law:
------------------------------------------------------------
Parameters  : value       lower 90%   higher 90%
Photon index: 1.01969     ( -0.137661   0.134648 )
Norm@50keV  : 7.70640E-03    ( -0.000569144   0.000566529 )
------------------------------------------------------------
#Fit statistic : Chi-Squared =          54.15 using 59 PHA bins.
# Reduced chi-squared =         0.9499 for     57 degrees of freedom
# Null hypothesis probability =   5.828107e-01

Photon flux (15-150 keV)    in 25.24 sec: 0.888234 ( -0.067433  0.0677602 ) ph/cm2/s
Energy fluence (15-150 keV)             : 2.08877e-06 ( -1.6162e-07  1.62648e-07 ) ergs/cm2
Cutoff power-law model

Time interval is from  -10.500 sec. to   14.744 sec.
Spectral model in the cutoff power-law:
------------------------------------------------------------
Parameters  : value       lower 90%   higher 90%
Photon index: 1.01384     ( -0.138768   0.135675 )
Epeak [keV] : 9998.28      ( -9998.25 -9998.25 )
Norm@50keV  : 7.75133E-03    ( -0.000563388   0.0055489 )
------------------------------------------------------------
#Fit statistic : Chi-Squared =          54.15 using 59 PHA bins.
# Reduced chi-squared =         0.9669 for     56 degrees of freedom
# Null hypothesis probability =   5.453782e-01

Photon flux (15-150 keV)    in 25.24 sec: 0.887271 ( -0.071443  0.067901 ) ph/cm2/s
Energy fluence (15-150 keV)             : 2.09382e-06 ( -1.74615e-07  1.57679e-07 ) ergs/cm2
Band function

Time interval is from  -10.500 sec. to   14.744 sec.

Spectral model in the Band function:
------------------------------------------------------------
Parameters  : value       lower 90%   higher 90%
alpha       : -0.834520   ( 0.83452   0.83452 )
beta        : -1.01969    ( -0.134623   0.137726 )
Epeak [keV] : 54.1517      ( -54.1517 939.378 )
Norm@50keV   : 1.28468E-02    ( -0.00569641   0 )
------------------------------------------------------------
#Fit statistic : Chi-Squared =          54.15 using 59 PHA bins.
# Reduced chi-squared =         0.9845 for     55 degrees of freedom
# Null hypothesis probability =   5.072189e-01

Photon flux (15-150 keV)    in 25.24 sec:  (    ) ph/cm2/s
Energy fluence (15-150 keV)             : 0 ( 0  0 ) ergs/cm2
Single BB
Spectral model blackbody:
------------------------------------------------------------
Parameters  : value    Lower 90%  Upper 90%
kT [keV]    : 22.6599  (-2.26271  2.66105)
R^2/D10^2   : 2.82120E-02  (-0.00828294   0.0112013)
(R is the radius in km and D10 is the distance to the source in units of 10 kpc)
------------------------------------------------------------
#Fit statistic : Chi-Squared =          86.01 using 59 PHA bins.
# Reduced chi-squared =          1.509 for     57 degrees of freedom
# Null hypothesis probability =   7.798527e-03

Energy  Fluence     90% Error
[keV]   [erg/cm2]   [erg/cm2]
15- 25  6.674e-08   1.002e-08
25- 50  3.590e-07   4.152e-08
50-150  1.378e-06   1.625e-07
15-150  1.803e-06   1.827e-07
Thermal bremsstrahlung (OTTB)
Spectral model: thermal bremsstrahlung
------------------------------------------------------------
Parameters  : value         Lower 90%    Upper 90%
kT [keV]    : 200.000       (      )
Norm        : 3.71614       (-0.278264     0.278204)
------------------------------------------------------------
#Fit statistic : Chi-Squared =          98.95 using 59 PHA bins.
# Reduced chi-squared =          1.736 for     57 degrees of freedom
# Null hypothesis probability =   4.812111e-04

Energy  Fluence     90% Error
[keV]   [erg/cm2]   [erg/cm2]
15- 25  2.335e-07   2.036e-08
25- 50  4.491e-07   5.591e-08
50-150  9.850e-07   3.118e-07
15-150  1.668e-06   4.131e-07
Double BB

Spectral model: bbodyrad<1> + bbodyrad<2>
------------------------------------------------------------
Parameters  : value         Lower 90%    Upper 90%
kT1 [keV]   : 8.17966        (-3.35744      4.34242)
R1^2/D10^2  : 0.377114        (-0.25735      1.48363)
kT2 [keV]   : 35.1998        (-8.57391      31.8122)
R2^2/D10^2  : 6.37914E-03    (-0.00525307   0.00541083)
------------------------------------------------------------
#Fit statistic : Chi-Squared =          56.99 using 59 PHA bins.
# Reduced chi-squared =          1.036 for     55 degrees of freedom
# Null hypothesis probability =   4.009710e-01

Energy  Fluence     90% Error
[keV]   [erg/cm2]   [erg/cm2]
15- 25  1.452e-07   6.939e-08
25- 50  3.971e-07   1.336e-07
50-150  1.550e-06   6.849e-07
15-150  2.092e-06   6.554e-07
Peak spectrum fit
Power-law model

Time interval is from    0.556 sec. to    1.556 sec.

Spectral model in power-law:
------------------------------------------------------------
Parameters  : value       lower 90%   higher 90%
Photon index: 0.911181     ( -0.340002   0.318817 )
Norm@50keV  : 1.62362E-02    ( -0.00297149   0.00291967 )
------------------------------------------------------------
#Fit statistic : Chi-Squared =          42.48 using 59 PHA bins.
# Reduced chi-squared =         0.7453 for     57 degrees of freedom
# Null hypothesis probability =   9.239103e-01

Photon flux (15-150 keV)    in 1 sec: 1.86379 ( -0.338459  0.341517 ) ph/cm2/s
Energy fluence (15-150 keV)             : 1.81432e-07 ( -3.37813e-08  3.40578e-08 ) ergs/cm2
Cutoff power-law model
Time interval is from    0.556 sec. to    1.556 sec.
Spectral model in the cutoff power-law:
------------------------------------------------------------
Parameters  : value       lower 90%   higher 90%
Photon index: 2.06106     (     )
Epeak [keV] : 20.7301      (   )
Norm@50keV  : 9.89270E-04    (     )
------------------------------------------------------------
#Fit statistic : Chi-Squared =          41.44 using 59 PHA bins.
# Reduced chi-squared =         0.7401 for     56 degrees of freedom
# Null hypothesis probability =   9.267896e-01

Photon flux (15-150 keV)    in 1 sec: 1.85413 ( -0.35331  0.34711 ) ph/cm2/s
Energy fluence (15-150 keV)             : 1.80782e-07 ( -3.5299e-08  3.4566e-08 ) ergs/cm2
Band function
Time interval is from    0.556 sec. to    1.556 sec.

Spectral model in the Band function:
------------------------------------------------------------
Parameters  : value       lower 90%   higher 90%
alpha       : -0.796746   ( 0.796746   0.796746 )
beta        : -0.911194    ( -0.318789   0.340016 )
Epeak [keV] : 33.0835      ( -33.0835 -33.0835 )
Norm@50keV   : 2.49836E-02    ( -0.0115752   0 )
------------------------------------------------------------
#Fit statistic : Chi-Squared =          42.48 using 59 PHA bins.
# Reduced chi-squared =         0.7724 for     55 degrees of freedom
# Null hypothesis probability =   8.912509e-01

Photon flux (15-150 keV)    in 1 sec:  (    ) ph/cm2/s
Energy fluence (15-150 keV)             : 0 ( 0  0 ) ergs/cm2
Single BB
Spectral model blackbody:
------------------------------------------------------------
Parameters  : value    Lower 90%  Upper 90%
kT [keV]    : 25.6370  (-5.92652  8.81818)
R^2/D10^2   : 4.20652E-02  (-0.0242487   0.0520029)
(R is the radius in km and D10 is the distance to the source in units of 10 kpc)
------------------------------------------------------------
#Fit statistic : Chi-Squared =          47.72 using 59 PHA bins.
# Reduced chi-squared =         0.8372 for     57 degrees of freedom
# Null hypothesis probability =   8.045777e-01

Energy  Fluence     90% Error
[keV]   [erg/cm2]   [erg/cm2]
15- 25  4.738e-09   2.085e-09
25- 50  2.723e-08   9.380e-09
50-150  1.322e-07   4.060e-08
15-150  1.641e-07   5.548e-08
Thermal bremsstrahlung (OTTB)
Spectral model: thermal bremsstrahlung
------------------------------------------------------------
Parameters  : value         Lower 90%    Upper 90%
kT [keV]    : 200.000       (      )
Norm        : 7.63762       (-1.41047     1.4103)
------------------------------------------------------------
#Fit statistic : Chi-Squared =          53.51 using 59 PHA bins.
# Reduced chi-squared =         0.9387 for     57 degrees of freedom
# Null hypothesis probability =   6.069780e-01

Energy  Fluence     90% Error
[keV]   [erg/cm2]   [erg/cm2]
15- 25  1.903e-08   1.114e-08
25- 50  3.661e-08   2.082e-08
50-150  8.029e-08   4.615e-08
15-150  1.359e-07   7.815e-08
Double BB
Spectral model: bbodyrad<1> + bbodyrad<2>
------------------------------------------------------------
Parameters  : value         Lower 90%    Upper 90%
kT1 [keV]   : 8.11230        (-4.78459      7.4706)
R1^2/D10^2  : 0.783840        (-0.669183      22.3165)
kT2 [keV]   : 37.9314        (-13.0852      113.387)
R2^2/D10^2  : 1.17726E-02    (-0.0104057   0.0242381)
------------------------------------------------------------
#Fit statistic : Chi-Squared =          41.76 using 59 PHA bins.
# Reduced chi-squared =         0.7593 for     55 degrees of freedom
# Null hypothesis probability =   9.058758e-01

Energy  Fluence     90% Error
[keV]   [erg/cm2]   [erg/cm2]
15- 25  1.169e-08   6.810e-09
25- 50  3.213e-08   1.758e-08
50-150  1.408e-07   7.840e-08
15-150  1.846e-07   9.645e-08
Pre-slew spectrum (Pre-slew PHA with pre-slew DRM)
Power-law model

Spectral model in power-law:
------------------------------------------------------------
Parameters  : value       lower 90%   higher 90%
Photon index: 1.01969     ( -0.137661   0.134648 )
Norm@50keV  : 7.70640E-03    ( -0.000569144   0.000566529 )
------------------------------------------------------------
#Fit statistic : Chi-Squared =          54.15 using 59 PHA bins.
# Reduced chi-squared =         0.9499 for     57 degrees of freedom
# Null hypothesis probability =   5.828107e-01

Photon flux (15-150 keV)    in 25.24 sec: 0.888234 ( -0.067433  0.0677602 ) ph/cm2/s
Energy fluence (15-150 keV)             : 2.08877e-06 ( -1.6162e-07  1.62648e-07 ) ergs/cm2
Cutoff power-law model

Spectral model in the cutoff power-law:
------------------------------------------------------------
Parameters  : value       lower 90%   higher 90%
Photon index: 1.01384     ( -0.138768   0.135675 )
Epeak [keV] : 9998.28      ( -9998.25 -9998.25 )
Norm@50keV  : 7.75133E-03    ( -0.000563388   0.0055489 )
------------------------------------------------------------
#Fit statistic : Chi-Squared =          54.15 using 59 PHA bins.
# Reduced chi-squared =         0.9669 for     56 degrees of freedom
# Null hypothesis probability =   5.453782e-01

Photon flux (15-150 keV)    in 25.24 sec: 0.887271 ( -0.071443  0.067901 ) ph/cm2/s
Energy fluence (15-150 keV)             : 2.09382e-06 ( -1.74615e-07  1.57679e-07 ) ergs/cm2
Band function

Spectral model in the Band function:
------------------------------------------------------------
Parameters  : value       lower 90%   higher 90%
alpha       : -0.834520   ( 0.83452   0.83452 )
beta        : -1.01969    ( -0.134623   0.137726 )
Epeak [keV] : 54.1517      ( -54.1517 937.16 )
Norm@50keV   : 1.28468E-02    ( -0.00569641   0 )
------------------------------------------------------------
#Fit statistic : Chi-Squared =          54.15 using 59 PHA bins.
# Reduced chi-squared =         0.9845 for     55 degrees of freedom
# Null hypothesis probability =   5.072189e-01

Photon flux (15-150 keV)    in 25.24 sec:  (    ) ph/cm2/s
Energy fluence (15-150 keV)             : 0 ( 0  0 ) ergs/cm2
S(25-50 keV) vs. S(50-100 keV) plot
S(25-50 keV)  = 3.92e-07
S(50-100 keV) = 7.73e-07
T90 vs. Hardness ratio plot
T90                                   = 17.5199999213219 sec.
Hardness ratio (energy fluence ratio) = 1.97194
Color vs. Color plot
Count Ratio  (25-50 keV) / (15-25 keV) = 1.69298
Count Ratio (50-100 keV) / (15-25 keV) = 1.98054
Mask shadow pattern
IMX = -6.266061842258196E-01, IMY = 5.283662211896585E-01
TIME vs. PHA plot around the trigger time
Blue+Cyan dotted lines: Time interval of the scaled map
From 0.000000 to 1.024000
TIME vs. DetID plot around the trigger time
Blue+Cyan dotted lines: Time interval of the scaled map
From 0.000000 to 1.024000
100 us light curve (15-350 keV)
Blue+Cyan dotted lines: Time interval of the scaled map
From 0.000000 to 1.024000
Spacecraft aspect plot
Bright source in the pre-burst/pre-slew/post-slew images
Pre-burst image of 15-350 keV band
Time interval of the image:
-41.035410 -10.500000

# RAcent  DECcent POSerr Theta    Phi  PeakCts   SNR AngSep     Name
#  [deg]    [deg]    ['] [deg]  [deg]                   [']
244.9630 -15.5859    2.4  37.4 -100.8   1.8349   4.8    3.4	Sco X-1
254.5525  35.5355    0.0  46.5  -19.9   0.2354   0.9   12.5	Her X-1
255.8280 -37.8862    9.3  41.2 -139.2   0.3199   1.2    7.9	4U 1700-377
256.6136 -36.4882    8.6  39.7 -138.5  -0.3038  -1.3    9.4	GX 349+2
263.0589 -24.8463    6.3  27.3 -132.2   0.3151   1.8    6.6	GX 1+4
264.9089 -44.4360    7.8  43.1 -153.0  -0.3673  -1.5    7.2	4U 1735-44
268.4922  -1.2817    0.0  12.8  -69.2   0.2590   1.6   12.7	SW J1753.5-0127
270.1108 -24.9465   15.0  23.7 -144.5  -0.1180  -0.8   12.3	GX 5-1
270.1349 -25.6982   31.5  24.3 -145.4   0.0542   0.4    9.4	GRS 1758-258
274.1241 -13.8695    7.5  12.2 -136.3   0.2196   1.5   12.2	GX 17+2
276.0758 -30.3256    8.4  27.0 -160.4   0.2276   1.4    8.2	H1820-303
284.9790 -24.8028    6.9  21.4 -179.7  -0.2671  -1.7    7.7	HT1900.1-2455
288.8211  11.0981   11.3  16.7   37.6   0.1674   1.0    9.3	GRS 1915+105
299.4558  35.1319    3.7  42.5   32.6   0.9892   3.1    7.8	Cyg X-1
263.1634 -33.9712  238.6  34.5 -143.2  -0.0096  -0.0   11.9	GX 354-0
285.3274 -62.2923    2.2  58.7 -172.2   4.6990   5.2 ------	UNKNOWN
281.5412 -61.1153    2.7  57.4 -170.1   2.8686   4.2 ------	UNKNOWN
267.9934 -22.3322    2.9  22.5 -136.8   0.6147   4.0 ------	UNKNOWN
Pre-slew background subtracted image of 15-350 keV band
Time interval of the image:
-10.500000 14.744000

# RAcent  DECcent POSerr Theta    Phi  PeakCts   SNR AngSep     Name
#  [deg]    [deg]    ['] [deg]  [deg]                   [']
245.1230 -15.5303   50.3  37.3 -100.8  -0.0574  -0.2   10.6	Sco X-1
254.4026  35.2561    5.6  46.3  -20.3   0.4054   2.0    5.8	Her X-1
255.9903 -37.9811   22.9  41.2 -139.4   0.0972   0.5    8.2	4U 1700-377
256.6207 -36.5253    4.1  39.8 -138.6   0.5172   2.8   10.8	GX 349+2
263.1653 -24.7286    5.0  27.2 -132.2  -0.2833  -2.3    8.6	GX 1+4
264.6207 -44.4172    4.8  43.2 -152.7   0.4493   2.4    5.6	4U 1735-44
268.3395  -1.3707    8.7  12.9  -69.7   0.1379   1.3    5.2	SW J1753.5-0127
270.3449 -25.0747    3.9  23.7 -145.1   0.3108   3.0    3.3	GX 5-1
270.1846 -25.8749    7.7  24.5 -145.7  -0.1602  -1.5   10.2	GRS 1758-258
274.0267 -14.1833    7.0  12.5 -136.8  -0.1615  -1.7    8.9	GX 17+2
275.7391 -30.2497  143.3  27.0 -159.7  -0.0086  -0.1   11.9	H1820-303
284.9124 -25.0731    7.9  21.7 -179.4  -0.1508  -1.5   11.4	HT1900.1-2455
288.7736  10.7926   10.8  16.4   38.0   0.1116   1.1    9.3	GRS 1915+105
299.5316  35.0912    4.4  42.5   32.7   0.6154   2.6    7.2	Cyg X-1
262.8412 -33.9119   26.3  34.6 -142.7  -0.0625  -0.4    8.7	GX 354-0
312.0536 -39.7420    2.2  45.6  156.5   1.2435   5.3 ------	UNKNOWN
268.9398  44.4911    2.1  49.4   -1.2   1.2224   5.4 ------	UNKNOWN
276.5337  -4.4967    2.5   4.6  -89.7   0.4278   4.6 ------	UNKNOWN
263.8886 -22.2823    2.1  24.9 -129.5   0.6361   5.5 ------	UNKNOWN
257.7530 -36.7294    0.7  39.3 -139.9   3.1262  17.7 ------	UNKNOWN
Post-slew image of 15-350 keV band
Time interval of the image:
-60.336000 482.711700

# RAcent  DECcent POSerr Theta    Phi  PeakCts   SNR AngSep     Name
#  [deg]    [deg]    ['] [deg]  [deg]                   [']
244.9580 -15.6219    1.7  37.4 -100.8  34.2855   6.9    1.7	Sco X-1
254.5710  35.4496   13.1  46.4  -19.9   3.3478   0.9    8.5	Her X-1
255.8434 -37.9649    9.2  41.2 -139.2   4.4916   1.3    9.9	4U 1700-377
256.2989 -36.5284  104.1  39.9 -138.2   0.3569   0.1    9.1	GX 349+2
263.0229 -24.8863    7.8  27.3 -132.1   3.2951   1.5    8.5	GX 1+4
264.6822 -44.3045   11.5  43.0 -152.6   3.4076   1.0    9.1	4U 1735-44
268.4644  -1.2864    4.1  12.8  -69.0   6.0063   2.8   11.5	SW J1753.5-0127
270.3577 -25.1873    6.3  23.8 -145.2   3.7175   1.8    7.6	GX 5-1
270.1461 -25.7571   14.2  24.4 -145.4   1.6368   0.8    8.5	GRS 1758-258
274.1309 -13.8683    0.0  12.2 -136.2   4.2230   2.3   12.4	GX 17+2
276.0927 -30.4015    6.1  27.0 -160.4   4.1100   1.9    8.9	H1820-303
285.0748 -25.0665   24.3  21.7 -179.8  -1.0822  -0.5    9.0	HT1900.1-2455
288.7188  10.9438    5.0  16.6   37.6   5.1186   2.3    4.7	GRS 1915+105
299.5077  35.1464    2.9  42.6   32.7  17.0117   3.9    5.2	Cyg X-1
263.1819 -33.9785    0.0  34.5 -143.1   1.0770   0.4   12.9	GX 354-0
277.1293 -30.7361    3.1  27.2 -162.4   7.8219   3.7 ------	UNKNOWN
279.0789 -60.0810    3.0  56.3 -168.6  34.9028   3.9 ------	UNKNOWN
237.6939  18.5867    2.9  48.2  -50.6  36.0743   4.0 ------	UNKNOWN
Plot creation:
Sun May 31 02:34:54 EDT 2015