Special notes of this burst
Image
Pre-slew 15.0-350.0 keV image (Event data; DETECTION mask)

#   RAcent    DECcent   POSerr    Theta     Phi              Peak Cts       SNR   Name
   36.5799   -18.9458   0.0067    52.4505    21.8624        14.3704741     29.083 TRIG_00377179

Foreground time interval of the image:
 -0.368   8.076 (delta_t =   8.444 [sec])
Background time interval of the image:
-107.403  -0.368 (delta_t = 107.035 [sec])
Lightcurves
Notes:
- 1) All plots contain as much data as has been downloaded to date.
- 2) The mask-weighted light curves are using the flight position.
- 3) Multiple plots of different time binning/intervals are shown to cover all scenarios of short/long GRBs, rate/image triggers, and real/false positives.
- 4) For all the mask-weighted lightcurves, the y-axis units are counts/sec/det where a det is 0.4 x 0.4 = 0.16 sq cm.
- 5) The verticle lines correspond to following: green dotted lines are T50 interval, black dotted lines are T90 interval, blue solid line(s) is a spacecraft slew start time, and orange solid line(s) is a spacecraft slew end time.
- 6) Time of each bin is in the middle of the bin.
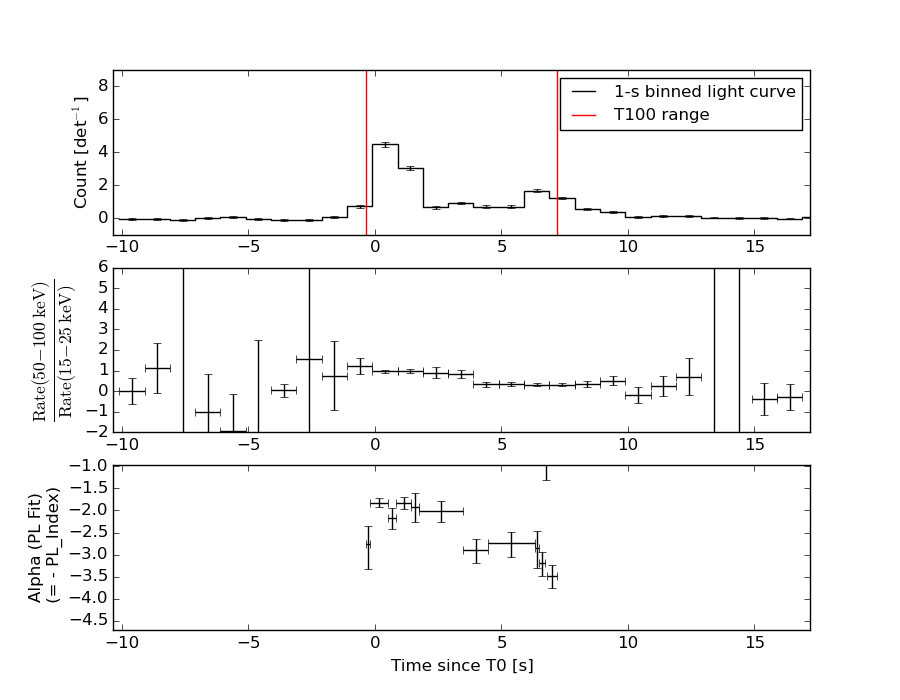
1 s binning
From T0-310 s to T0+310 s
From T100_start - 20 s to T100_end + 30 s
Full time interval
64 ms binning
Full time interval
From T100_start to T100_end
From T0-5 sec to T0+5 sec
16 ms binning
From T100_start-5 s to T100_start+5 s

Blue+Cyan dotted lines: Time interval of the scaled map
From 0.000000 to 1.024000
8 ms binning
From T100_start-3 s to T100_start+3 s
Blue+Cyan dotted lines: Time interval of the scaled map
From 0.000000 to 1.024000
2 ms binning
From T100_start-1 s to T100_start+1 s

Blue+Cyan dotted lines: Time interval of the scaled map
From 0.000000 to 1.024000
SN=5 or 10 sec. binning (whichever binning is satisfied first)
SN=5 or 10 sec. binning (T < 200 sec)
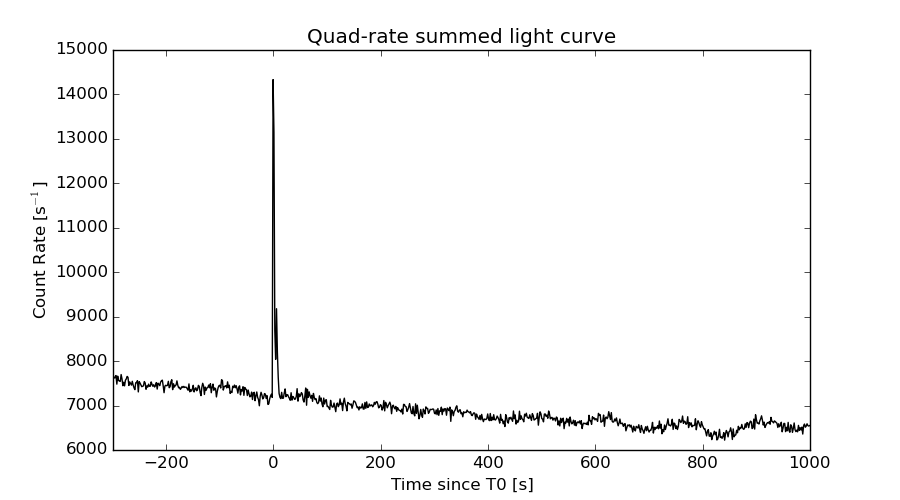
Quad-rate summed light curves (from T0-300s to T0+1000s)
Spectral Evolution
Spectra
Notes:
- 1) The fitting includes the systematic errors.
- 2) For long bursts, a spectral fit of the pre-slew DRM will introduce some errors in both a spectral shape and a normalization if the PHA file contains a lot of the slew/post-slew time interval.
- 3) For fits to more complicated models (e.g. a power-law over a cutoff power-law), the BAT team has decided to require a chi-square improvement of more than 6 for each extra dof.
- 4) For short bursts (T90<1sec), the specrtum is also fit with Blackbody, OTTB, and Double Blackbody.
Time averaged spectrum fit using the pre-slew DRM
Power-law model
Time interval is from   -0.372 sec. to    7.196 sec.

Spectral model in power-law:
------------------------------------------------------------
Parameters  : value       lower 90%   higher 90%
Photon index: 2.02310     ( -0.0713433   0.0723726 )
Norm@50keV  : 0.122686    ( -0.00493974   0.00492055 )
------------------------------------------------------------
#Fit statistic : Chi-Squared =          56.08 using 59 PHA bins.
# Reduced chi-squared =         0.9838 for     57 degrees of freedom
# Null hypothesis probability =   5.096450e-01

Photon flux (15-150 keV)    in 7.568 sec: 18.6010 ( -0.803989  0.808153 ) ph/cm2/s
Energy fluence (15-150 keV)             : 8.57379e-06 ( -3.33971e-07  3.34264e-07 ) ergs/cm2
Cutoff power-law model
Time interval is from   -0.372 sec. to    7.196 sec.
Spectral model in the cutoff power-law:
------------------------------------------------------------
Parameters  : value       lower 90%   higher 90%
Photon index: 1.79710     ( -0.288079   0.271697 )
Epeak [keV] : 46.3739      (   )
Norm@50keV  : 0.158154    (     )
------------------------------------------------------------
#Fit statistic : Chi-Squared =          54.08 using 59 PHA bins.
# Reduced chi-squared =         0.9657 for     56 degrees of freedom
# Null hypothesis probability =   5.479355e-01

Photon flux (15-150 keV)    in 7.568 sec: 18.2772 ( -0.8823  0.8883 ) ph/cm2/s
Energy fluence (15-150 keV)             : 8.46307e-06 ( 0  0 ) ergs/cm2
Band function

Time interval is from   -0.372 sec. to    7.196 sec.

Spectral model in the Band function:
------------------------------------------------------------
Parameters  : value       lower 90%   higher 90%
alpha       : -1.79722   ( 1.88792   0.300309 )
beta        : -10.0000    ( 10   1.77636e-15 )
Epeak [keV] : 46.3639      ( -11.6894 -46.3639 )
Norm@50keV   : 0.158093    ( -0.0312685   0.058843 )
------------------------------------------------------------
#Fit statistic : Chi-Squared =          54.08 using 59 PHA bins.
# Reduced chi-squared =         0.9832 for     55 degrees of freedom
# Null hypothesis probability =   5.098320e-01

Photon flux (15-150 keV)    in 7.568 sec: 18.2804 (    ) ph/cm2/s
Energy fluence (15-150 keV)             : 0 ( 0  0 ) ergs/cm2
Single BB
Spectral model blackbody:
------------------------------------------------------------
Parameters  : value    Lower 90%  Upper 90%
kT [keV]    : 12.6652  (  )
R^2/D10^2   : 3.28229  (   )
(R is the radius in km and D10 is the distance to the source in units of 10 kpc)
------------------------------------------------------------
#Fit statistic : Chi-Squared =         246.21 using 59 PHA bins.
# Reduced chi-squared =         4.3195 for     57 degrees of freedom
# Null hypothesis probability =   2.337129e-25

Energy  Fluence     90% Error
[keV]   [erg/cm2]   [erg/cm2]
15- 25  8.450e-07   6.508e-08
25- 50  2.829e-06   1.393e-07
50-150  2.824e-06   2.327e-07
15-150  6.498e-06   2.796e-07
Thermal bremsstrahlung (OTTB)
Spectral model: thermal bremsstrahlung
------------------------------------------------------------
Parameters  : value         Lower 90%    Upper 90%
kT [keV]    : 80.8173       (-9.08136      10.9275)
Norm        : 83.6209       (-5.44799     5.87805)
------------------------------------------------------------
#Fit statistic : Chi-Squared =          61.57 using 59 PHA bins.
# Reduced chi-squared =          1.080 for     57 degrees of freedom
# Null hypothesis probability =   3.157974e-01

Energy  Fluence     90% Error
[keV]   [erg/cm2]   [erg/cm2]
15- 25  1.643e-06   9.687e-08
25- 50  2.712e-06   1.131e-07
50-150  3.854e-06   2.838e-07
15-150  8.208e-06   3.254e-07
Double BB
Spectral model: bbodyrad<1> + bbodyrad<2>
------------------------------------------------------------
Parameters  : value         Lower 90%    Upper 90%
kT1 [keV]   : 5.90971        (-0.718268      0.768439)
R1^2/D10^2  : 44.2142        (-16.8182      31.4192)
kT2 [keV]   : 21.1792        (-2.10622      2.69836)
R2^2/D10^2  : 0.345957    (-0.135225   0.191244)
------------------------------------------------------------
#Fit statistic : Chi-Squared =          59.54 using 59 PHA bins.
# Reduced chi-squared =          1.083 for     55 degrees of freedom
# Null hypothesis probability =   3.137923e-01

Energy  Fluence     90% Error
[keV]   [erg/cm2]   [erg/cm2]
15- 25  1.740e-06   2.762e-07
25- 50  2.607e-06   2.520e-07
50-150  3.948e-06   4.495e-07
15-150  8.295e-06   6.520e-07
Peak spectrum fit
Power-law model
Time interval is from   -0.252 sec. to    0.748 sec.

Spectral model in power-law:
------------------------------------------------------------
Parameters  : value       lower 90%   higher 90%
Photon index: 1.82982     ( -0.0935341   0.0953901 )
Norm@50keV  : 0.324997    ( -0.0189546   0.0188702 )
------------------------------------------------------------
#Fit statistic : Chi-Squared =          59.20 using 59 PHA bins.
# Reduced chi-squared =          1.039 for     57 degrees of freedom
# Null hypothesis probability =   3.952485e-01

Photon flux (15-150 keV)    in 1 sec: 45.3122 ( -2.68706  2.69331 ) ph/cm2/s
Energy fluence (15-150 keV)             : 2.98936e-06 ( -1.75703e-07  1.75995e-07 ) ergs/cm2
Cutoff power-law model
Time interval is from   -0.252 sec. to    0.748 sec.
Spectral model in the cutoff power-law:
------------------------------------------------------------
Parameters  : value       lower 90%   higher 90%
Photon index: 1.32972     ( -0.414863   0.38241 )
Epeak [keV] : 69.5879      ( -12.8792 56.0208 )
Norm@50keV  : 0.574528    ( -0.198951   0.337812 )
------------------------------------------------------------
#Fit statistic : Chi-Squared =          54.11 using 59 PHA bins.
# Reduced chi-squared =         0.9663 for     56 degrees of freedom
# Null hypothesis probability =   5.466949e-01

Photon flux (15-150 keV)    in 1 sec: 44.3027 ( -2.7792  2.7932 ) ph/cm2/s
Energy fluence (15-150 keV)             : 2.93692e-06 ( 0  0 ) ergs/cm2
Band function
Time interval is from   -0.252 sec. to    0.748 sec.

Spectral model in the Band function:
------------------------------------------------------------
Parameters  : value       lower 90%   higher 90%
alpha       : -1.30138   ( -0.365923   0.853564 )
beta        : -2.40965    ( 2.40148   0.514076 )
Epeak [keV] : 67.6650      ( -27.1164 54.3152 )
Norm@50keV   : 0.596081    ( -0.217736   1.51261 )
------------------------------------------------------------
#Fit statistic : Chi-Squared =          54.01 using 59 PHA bins.
# Reduced chi-squared =         0.9821 for     55 degrees of freedom
# Null hypothesis probability =   5.123564e-01

Photon flux (15-150 keV)    in 1 sec:  (    ) ph/cm2/s
Energy fluence (15-150 keV)             : 2.92876e-06 ( 0  0 ) ergs/cm2
Single BB
Spectral model blackbody:
------------------------------------------------------------
Parameters  : value    Lower 90%  Upper 90%
kT [keV]    : 13.6059  (  )
R^2/D10^2   : 6.85931  (   )
(R is the radius in km and D10 is the distance to the source in units of 10 kpc)
------------------------------------------------------------
#Fit statistic : Chi-Squared =         129.63 using 59 PHA bins.
# Reduced chi-squared =         2.2743 for     57 degrees of freedom
# Null hypothesis probability =   1.396576e-07

Energy  Fluence     90% Error
[keV]   [erg/cm2]   [erg/cm2]
15- 25  2.688e-07   2.615e-08
25- 50  9.714e-07   6.235e-08
50-150  1.166e-06   1.360e-07
15-150  2.407e-06   1.530e-07
Thermal bremsstrahlung (OTTB)
Spectral model: thermal bremsstrahlung
------------------------------------------------------------
Parameters  : value         Lower 90%    Upper 90%
kT [keV]    : 114.133       (-22.8366      24.348)
Norm        : 190.531       (-13.815     18.5279)
------------------------------------------------------------
#Fit statistic : Chi-Squared =          54.49 using 59 PHA bins.
# Reduced chi-squared =         0.9559 for     57 degrees of freedom
# Null hypothesis probability =   5.699260e-01

Energy  Fluence     90% Error
[keV]   [erg/cm2]   [erg/cm2]
15- 25  4.971e-07   4.470e-08
25- 50  8.815e-07   6.325e-08
50-150  1.534e-06   4.300e-07
15-150  2.913e-06   4.765e-07
Double BB
Spectral model: bbodyrad<1> + bbodyrad<2>
------------------------------------------------------------
Parameters  : value         Lower 90%    Upper 90%
kT1 [keV]   : 6.12711        (-1.36781      1.56751)
R1^2/D10^2  : 80.3690        (-43.437      134.849)
kT2 [keV]   : 20.9538        (-2.90091      4.60302)
R2^2/D10^2  : 1.05643    (-0.600906   0.933623)
------------------------------------------------------------
#Fit statistic : Chi-Squared =          58.54 using 59 PHA bins.
# Reduced chi-squared =          1.064 for     55 degrees of freedom
# Null hypothesis probability =   3.468675e-01

Energy  Fluence     90% Error
[keV]   [erg/cm2]   [erg/cm2]
15- 25  5.006e-07   1.220e-07
25- 50  8.811e-07   1.704e-07
50-150  1.516e-06   2.825e-07
15-150  2.898e-06   4.280e-07
Pre-slew spectrum (Pre-slew PHA with pre-slew DRM)
Power-law model
Spectral model in power-law:
------------------------------------------------------------
Parameters  : value       lower 90%   higher 90%
Photon index: 2.02310     ( -0.0713433   0.0723726 )
Norm@50keV  : 0.122686    ( -0.00493974   0.00492055 )
------------------------------------------------------------
#Fit statistic : Chi-Squared =          56.08 using 59 PHA bins.
# Reduced chi-squared =         0.9838 for     57 degrees of freedom
# Null hypothesis probability =   5.096450e-01

Photon flux (15-150 keV)    in 7.568 sec: 18.6010 ( -0.803989  0.808153 ) ph/cm2/s
Energy fluence (15-150 keV)             : 8.57379e-06 ( -3.33971e-07  3.34264e-07 ) ergs/cm2
Cutoff power-law model
Spectral model in the cutoff power-law:
------------------------------------------------------------
Parameters  : value       lower 90%   higher 90%
Photon index: 1.79710     ( -0.288079   0.271697 )
Epeak [keV] : 46.3739      (   )
Norm@50keV  : 0.158154    (     )
------------------------------------------------------------
#Fit statistic : Chi-Squared =          54.08 using 59 PHA bins.
# Reduced chi-squared =         0.9657 for     56 degrees of freedom
# Null hypothesis probability =   5.479355e-01

Photon flux (15-150 keV)    in 7.568 sec: 18.2772 ( -0.8823  0.8883 ) ph/cm2/s
Energy fluence (15-150 keV)             : 8.46307e-06 ( 0  0 ) ergs/cm2
Band function
Spectral model in the Band function:
------------------------------------------------------------
Parameters  : value       lower 90%   higher 90%
alpha       : -1.79722   ( 1.88792   0.300309 )
beta        : -10.0000    ( 10   20 )
Epeak [keV] : 46.3639      ( -11.6894 -46.3639 )
Norm@50keV   : 0.158093    ( -0.0313516   0.0588429 )
------------------------------------------------------------
#Fit statistic : Chi-Squared =          54.08 using 59 PHA bins.
# Reduced chi-squared =         0.9832 for     55 degrees of freedom
# Null hypothesis probability =   5.098320e-01

Photon flux (15-150 keV)    in 7.568 sec: 18.2804 (    ) ph/cm2/s
Energy fluence (15-150 keV)             : 0 ( 0  0 ) ergs/cm2
S(25-50 keV) vs. S(50-100 keV) plot

S(25-50 keV)  = 2.60e-06
S(50-100 keV) = 2.56e-06
T90 vs. Hardness ratio plot
T90                                   = 6.9559999704361 sec.
Hardness ratio (energy fluence ratio) = 0.984615
Color vs. Color plot
Count Ratio  (25-50 keV) / (15-25 keV) = 1.12987
Count Ratio (50-100 keV) / (15-25 keV) = 0.729737
Mask shadow pattern (with DETECTION mask)
IMX = 1.207336881097049E+00, IMY = -4.844252725241740E-01
TIME vs. PHA plot around the trigger time
Blue+Cyan dotted lines: Time interval of the scaled map
From 0.000000 to 1.024000
TIME vs. DetID plot around the trigger time
Blue+Cyan dotted lines: Time interval of the scaled map
From 0.000000 to 1.024000
100 us light curve (15-350 keV)
Blue+Cyan dotted lines: Time interval of the scaled map
From 0.000000 to 1.024000
Spacecraft aspect plot
Bright source in the pre-burst/pre-slew/post-slew images
Pre-burst image of 15-350 keV band
Time interval of the image:
-107.403400 -0.372000

# RAcent  DECcent POSerr Theta    Phi  PeakCts   SNR AngSep     Name
#  [deg]    [deg]    ['] [deg]  [deg]                   [']
135.5210 -40.5457    0.8  33.9 -134.8   2.6375  15.0    0.6	Vela X-1
 61.7521 -22.8501    2.1  29.8   33.5   0.7745   5.5 ------	UNKNOWN
 34.7730 -29.0118    2.4  49.8    9.2   1.5221   4.7 ------	UNKNOWN
141.9736   0.7523    2.6  56.9  174.1   3.1139   4.5 ------	UNKNOWN
 22.5161 -36.5270    2.3  56.9   -4.0   3.0899   5.0 ------	UNKNOWN
Pre-slew background subtracted image of 15-350 keV band
Time interval of the image:
-0.372000 7.196000

# RAcent  DECcent POSerr Theta    Phi  PeakCts   SNR AngSep     Name
#  [deg]    [deg]    ['] [deg]  [deg]                   [']
135.5593 -40.5970    5.1  34.0 -134.7  -0.1146  -2.3    2.9	Vela X-1
 36.5808 -18.9477    0.5  52.4   21.9  14.1869  22.8 ------	UNKNOWN
 78.6121 -25.7826    2.4  15.1   47.8   0.2709   4.8 ------	UNKNOWN
 95.0499 -25.0558    2.4   8.6  120.2   0.2210   4.8 ------	UNKNOWN
143.9630  -1.4028    2.6  57.0  177.6   0.9226   4.5 ------	UNKNOWN
157.7131 -31.6391    2.7  53.2 -142.3   0.7675   4.3 ------	UNKNOWN
Post-slew image of 15-350 keV band
Time interval of the image:
900.396600 1001.916000

# RAcent  DECcent POSerr Theta    Phi  PeakCts   SNR AngSep     Name
#  [deg]    [deg]    ['] [deg]  [deg]                   [']
135.5373 -40.5490    1.4  34.2  -82.9   1.8214   8.2    0.5	Vela X-1
118.6406  32.0070    2.5  47.1  142.0   1.9050   4.6 ------	UNKNOWN
 81.5503 -29.2417    2.7  30.4    8.2   0.5455   4.3 ------	UNKNOWN
 90.8099 -26.2079    2.5  21.7    6.2   0.5188   4.6 ------	UNKNOWN
110.9867 -18.4630    2.9   4.2  -57.2   0.4140   4.1 ------	UNKNOWN
164.3298   7.9234    2.6  58.1 -156.8   2.7949   4.5 ------	UNKNOWN
Plot creation:
Fri Dec 18 19:56:54 EST 2015