Click here for the BAT GCN circular template
Image
Pre-slew 15.0-350.0 keV image (Event data)

#   RAcent    DECcent   POSerr    Theta     Phi              Peak Cts       SNR   Name
   55.7985    23.2435   0.0092    27.2618   -56.9795         2.6428095     20.678 TRIG_00380311

Foreground time interval of the image:
-43.584  11.837 (delta_t =  55.421 [sec])
Background time interval of the image:
-200.963 -43.584 (delta_t = 157.379 [sec])
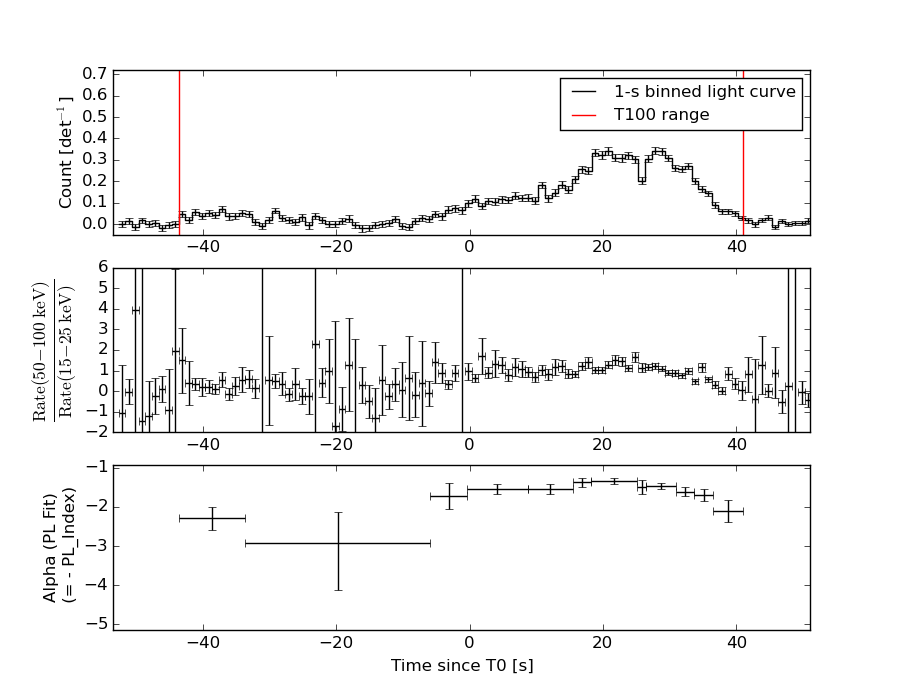
Lightcurves
Notes:
- 1) The mask-weighted light curves are using the flight position.
- 2) Multiple plots of different time binning/intervals are shown to cover all scenarios of short/long GRBs, rate/image triggers, and real/false positives.
- 3) For all the mask-weighted lightcurves, the y-axis units are counts/sec/det where a det is 0.4 x 0.4 = 0.16 sq cm.
- 4) The verticle lines correspond to following: green dotted lines are T50 interval, black dotted lines are T90 interval, blue solid line(s) is a spacecraft slew start time, and orange solid line(s) is a spacecraft slew end time.
- 5) Time of each bin is in the middle of the bin.
1 s binning
From T0-310 s to T0+310 s
From T100_start - 20 s to T100_end + 30 s

Full time interval

64 ms binning
Full time interval

From T100_start to T100_end

From T0-5 sec to T0+5 sec

16 ms binning
From T100_start-5 s to T100_start+5 s

Blue+Cyan dotted lines: Time interval of the scaled map
From 0.000000 to 1.024000
8 ms binning
From T100_start-3 s to T100_start+3 s

Blue+Cyan dotted lines: Time interval of the scaled map
From 0.000000 to 1.024000
2 ms binning
From T100_start-1 s to T100_start+1 s

Blue+Cyan dotted lines: Time interval of the scaled map
From 0.000000 to 1.024000
SN=5 or 10 sec. binning (whichever binning is satisfied first)
SN=5 or 10 sec. binning (T < 200 sec)

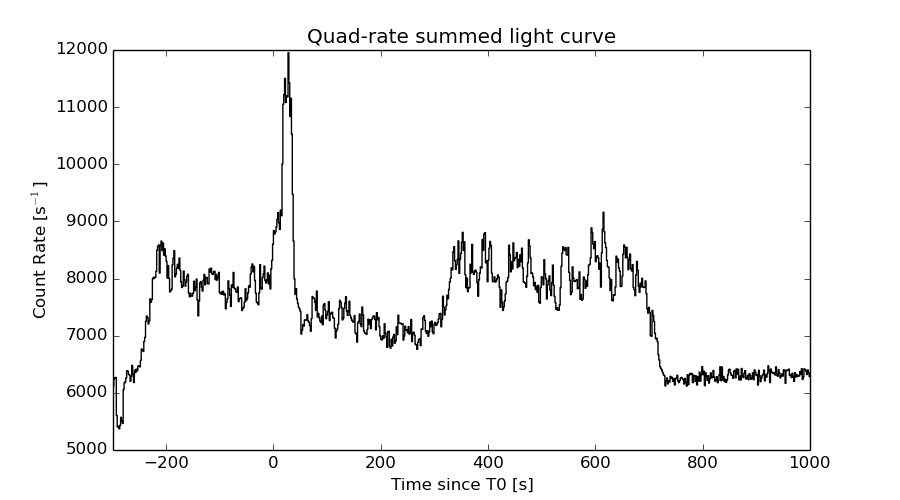
Quad-rate summed light curves (from T0-300s to T0+1000s)
Spectral Evolution
Spectra
Notes:
- 1) The fitting includes the systematic errors.
- 2) When the burst includes telescope slew time periods, the fitting uses an average response file made from multiple 5-s response files through out the slew time plus single time preiod for the non-slew times, and weighted by the total counts in the corresponding time period using addrmf. An average response file is needed becuase a spectral fit using the pre-slew DRM will introduce some errors in both a spectral shape and a normalization if the PHA file contains a lot of the slew/post-slew time interval.
- 3) For fits to more complicated models (e.g. a power-law over a cutoff power-law), the BAT team has decided to require a chi-square improvement of more than 6 for each extra dof.
Time averaged spectrum fit using the average DRM
Power-law model

Time interval is from  -43.584 sec. to   41.084 sec.

Spectral model in power-law:
------------------------------------------------------------
Parameters  : value       lower 90%   higher 90%
Photon index: 1.57580     ( -0.0556686   0.0556834 )
Norm@50keV  : 7.06112E-03    ( -0.0001965   0.000196475 )
------------------------------------------------------------
#Fit statistic : Chi-Squared =          30.15 using 59 PHA bins.
# Reduced chi-squared =         0.5289 for     57 degrees of freedom
# Null hypothesis probability =   9.986921e-01

Photon flux (15-150 keV)    in 84.67 sec: 0.900716 ( -0.0285064  0.028633 ) ph/cm2/s
Energy fluence (15-150 keV)             : 5.60848e-06 ( -1.63103e-07  1.63577e-07 ) ergs/cm2
Cutoff power-law model

Time interval is from  -43.584 sec. to   41.084 sec.
Spectral model in the cutoff power-law:
------------------------------------------------------------
Parameters  : value       lower 90%   higher 90%
Photon index: 1.57355     ( -0.104503   0.0777771 )
Epeak [keV] : 9999.25      (   )
Norm@50keV  : 7.07891E-03    ( -0.000196829   0.00082238 )
------------------------------------------------------------
#Fit statistic : Chi-Squared =          30.19 using 59 PHA bins.
# Reduced chi-squared =         0.5391 for     56 degrees of freedom
# Null hypothesis probability =   9.981258e-01

Photon flux (15-150 keV)    in 84.67 sec: 0.900469 ( -0.016336  0.028344 ) ph/cm2/s
Energy fluence (15-150 keV)             : 5.60721e-06 ( -1.61305e-07  1.58409e-07 ) ergs/cm2
Band function

Time interval is from  -43.584 sec. to   41.084 sec.

Spectral model in the Band function:
------------------------------------------------------------
Parameters  : value       lower 90%   higher 90%
alpha       : -0.923286   ( 1.14716   1.14716 )
beta        : -1.58067    ( -0.0632484   0.0580611 )
Epeak [keV] : 38.5973      ( -37.5007 -37.5007 )
Norm@50keV   : 2.23742E-02    ( -0.0228732   711943 )
------------------------------------------------------------
#Fit statistic : Chi-Squared =          29.93 using 59 PHA bins.
# Reduced chi-squared =         0.5442 for     55 degrees of freedom
# Null hypothesis probability =   9.976819e-01

Photon flux (15-150 keV)    in 84.67 sec:  (    ) ph/cm2/s
Energy fluence (15-150 keV)             : 0 ( 0  0 ) ergs/cm2
Single BB

Spectral model blackbody:
------------------------------------------------------------
Parameters  : value    Lower 90%  Upper 90%
kT [keV]    : 16.3166  (  )
R^2/D10^2   : 6.98606E-02  (   )
(R is the radius in km and D10 is the distance to the source in units of 10 kpc)
------------------------------------------------------------
#Fit statistic : Chi-Squared =         375.78 using 59 PHA bins.
# Reduced chi-squared =         6.5926 for     57 degrees of freedom
# Null hypothesis probability =   1.748116e-48

Energy  Fluence     90% Error
[keV]   [erg/cm2]   [erg/cm2]
15- 25  3.241e-07   1.981e-08
25- 50  1.387e-06   6.054e-08
50-150  2.600e-06   1.287e-07
15-150  4.310e-06   1.422e-07
Thermal bremsstrahlung (OTTB)

Spectral model: thermal bremsstrahlung
------------------------------------------------------------
Parameters  : value         Lower 90%    Upper 90%
kT [keV]    : 200.000       (      )
Norm        : 3.61545       (-0.100664     0.100663)
------------------------------------------------------------
#Fit statistic : Chi-Squared =          42.91 using 59 PHA bins.
# Reduced chi-squared =         0.7528 for     57 degrees of freedom
# Null hypothesis probability =   9.167208e-01

Energy  Fluence     90% Error
[keV]   [erg/cm2]   [erg/cm2]
15- 25  7.625e-07   2.515e-08
25- 50  1.467e-06   4.530e-08
50-150  3.217e-06   1.118e-07
15-150  5.446e-06   1.744e-07
Double BB

Spectral model: bbodyrad<1> + bbodyrad<2>
------------------------------------------------------------
Parameters  : value         Lower 90%    Upper 90%
kT1 [keV]   : 7.05237        (-0.651134      0.708019)
R1^2/D10^2  : 0.987469        (-0.28719      0.433958)
kT2 [keV]   : 29.5536        (-2.88748      3.80284)
R2^2/D10^2  : 7.30427E-03    (-0.00244082   0.00315124)
------------------------------------------------------------
#Fit statistic : Chi-Squared =          37.41 using 59 PHA bins.
# Reduced chi-squared =         0.6801 for     55 degrees of freedom
# Null hypothesis probability =   9.666835e-01

Energy  Fluence     90% Error
[keV]   [erg/cm2]   [erg/cm2]
15- 25  7.585e-07   7.447e-08
25- 50  1.458e-06   9.144e-08
50-150  3.403e-06   2.477e-07
15-150  5.620e-06   3.247e-07
Peak spectrum fit
Power-law model

Time interval is from   20.696 sec. to   21.696 sec.

Spectral model in power-law:
------------------------------------------------------------
Parameters  : value       lower 90%   higher 90%
Photon index: 1.15788     ( -0.138942   0.136717 )
Norm@50keV  : 2.54788E-02    ( -0.00193442   0.00193161 )
------------------------------------------------------------
#Fit statistic : Chi-Squared =          43.32 using 59 PHA bins.
# Reduced chi-squared =         0.7601 for     57 degrees of freedom
# Null hypothesis probability =   9.093661e-01

Photon flux (15-150 keV)    in 1 sec: 2.97417 ( -0.235291  0.236053 ) ph/cm2/s
Energy fluence (15-150 keV)             : 2.61671e-07 ( -2.15956e-08  2.16916e-08 ) ergs/cm2
Cutoff power-law model

Time interval is from   20.696 sec. to   21.696 sec.
Spectral model in the cutoff power-law:
------------------------------------------------------------
Parameters  : value       lower 90%   higher 90%
Photon index: 1.08587     ( -0.557189   0.130537 )
Epeak [keV] : 710.330      ( -9999.26 -9999.26 )
Norm@50keV  : 2.74926E-02    ( -0.0019336   0.019102 )
------------------------------------------------------------
#Fit statistic : Chi-Squared =          43.37 using 59 PHA bins.
# Reduced chi-squared =         0.7745 for     56 degrees of freedom
# Null hypothesis probability =   8.910974e-01

Photon flux (15-150 keV)    in 1 sec: 2.97328 ( -0.23746  0.23538 ) ph/cm2/s
Energy fluence (15-150 keV)             : 2.61732e-07 ( -1.1482e-08  2.1589e-08 ) ergs/cm2
Band function

Time interval is from   20.696 sec. to   21.696 sec.

Spectral model in the Band function:
------------------------------------------------------------
Parameters  : value       lower 90%   higher 90%
alpha       : 5.00000   ( -4.99995   -4.99995 )
beta        : -1.16829    ( -0.143885   0.142882 )
Epeak [keV] : 20.9689      ( -20.9689 6.06689 )
Norm@50keV   : 5665.75    ( -427.723   6.39703e+06 )
------------------------------------------------------------
#Fit statistic : Chi-Squared =          43.22 using 59 PHA bins.
# Reduced chi-squared =         0.7859 for     55 degrees of freedom
# Null hypothesis probability =   8.748892e-01

Photon flux (15-150 keV)    in 1 sec:  (    ) ph/cm2/s
Energy fluence (15-150 keV)             : 0 ( 0  0 ) ergs/cm2
Single BB

Spectral model blackbody:
------------------------------------------------------------
Parameters  : value    Lower 90%  Upper 90%
kT [keV]    : 20.3982  (-2.06126  2.39328)
R^2/D10^2   : 0.127990  (-0.0387085   0.0535251)
(R is the radius in km and D10 is the distance to the source in units of 10 kpc)
------------------------------------------------------------
#Fit statistic : Chi-Squared =          78.34 using 59 PHA bins.
# Reduced chi-squared =          1.374 for     57 degrees of freedom
# Null hypothesis probability =   3.190867e-02

Energy  Fluence     90% Error
[keV]   [erg/cm2]   [erg/cm2]
15- 25  1.018e-08   1.682e-09
25- 50  5.139e-08   6.580e-09
50-150  1.589e-07   2.245e-08
15-150  2.205e-07   2.290e-08
Thermal bremsstrahlung (OTTB)

Spectral model: thermal bremsstrahlung
------------------------------------------------------------
Parameters  : value         Lower 90%    Upper 90%
kT [keV]    : 200.000       (      )
Norm        : 12.4068       (-0.961919     0.961777)
------------------------------------------------------------
#Fit statistic : Chi-Squared =          67.50 using 59 PHA bins.
# Reduced chi-squared =          1.184 for     57 degrees of freedom
# Null hypothesis probability =   1.609981e-01

Energy  Fluence     90% Error
[keV]   [erg/cm2]   [erg/cm2]
15- 25  3.090e-08   2.755e-09
25- 50  5.945e-08   7.295e-09
50-150  1.304e-07   3.967e-08
15-150  2.207e-07   5.040e-08
Double BB

Spectral model: bbodyrad<1> + bbodyrad<2>
------------------------------------------------------------
Parameters  : value         Lower 90%    Upper 90%
kT1 [keV]   : 5.67500        (-1.90991      4.68459)
R1^2/D10^2  : 4.84935        (-4.06916      22.4478)
kT2 [keV]   : 27.4181        (-4.65651      18.5421)
R2^2/D10^2  : 4.47949E-02    (-0.0361146   0.0357291)
------------------------------------------------------------
#Fit statistic : Chi-Squared =          46.93 using 59 PHA bins.
# Reduced chi-squared =         0.8532 for     55 degrees of freedom
# Null hypothesis probability =   7.723862e-01

Energy  Fluence     90% Error
[keV]   [erg/cm2]   [erg/cm2]
15- 25  2.463e-08   1.137e-08
25- 50  4.978e-08   1.237e-08
50-150  1.816e-07   3.680e-08
15-150  2.560e-07   5.130e-08
Pre-slew spectrum (Pre-slew PHA with pre-slew DRM)
Power-law model

Spectral model in power-law:
------------------------------------------------------------
Parameters  : value       lower 90%   higher 90%
Photon index: 1.85474     ( -0.133968   0.136683 )
Norm@50keV  : 2.84990E-03    ( -0.000227855   0.000224771 )
------------------------------------------------------------
#Fit statistic : Chi-Squared =          36.42 using 59 PHA bins.
# Reduced chi-squared =         0.6390 for     57 degrees of freedom
# Null hypothesis probability =   9.846271e-01

Photon flux (15-150 keV)    in 55.42 sec: 0.401357 ( -0.0291149  0.0291797 ) ph/cm2/s
Energy fluence (15-150 keV)             : 1.45215e-06 ( -1.15761e-07  1.16792e-07 ) ergs/cm2
Cutoff power-law model

Spectral model in the cutoff power-law:
------------------------------------------------------------
Parameters  : value       lower 90%   higher 90%
Photon index: 1.85334     ( -0.423195   0.137639 )
Epeak [keV] : 9999.31      (   )
Norm@50keV  : 2.85354E-03    (     )
------------------------------------------------------------
#Fit statistic : Chi-Squared =          36.42 using 59 PHA bins.
# Reduced chi-squared =         0.6504 for     56 degrees of freedom
# Null hypothesis probability =   9.802395e-01

Photon flux (15-150 keV)    in 55.42 sec: 0.401443 ( -0.029534  0.028934 ) ph/cm2/s
Energy fluence (15-150 keV)             : 1.45198e-06 ( -1.2296e-07  1.15601e-07 ) ergs/cm2
Band function

Spectral model in the Band function:
------------------------------------------------------------
Parameters  : value       lower 90%   higher 90%
alpha       : 4.97374   ( -4.97374   -4.97374 )
beta        : -1.87964    ( -0.146479   0.140972 )
Epeak [keV] : 19.2650      ( -19.265 4.37511 )
Norm@50keV   : 2100.71    ( -147.602   2.78444e+06 )
------------------------------------------------------------
#Fit statistic : Chi-Squared =          36.17 using 59 PHA bins.
# Reduced chi-squared =         0.6577 for     55 degrees of freedom
# Null hypothesis probability =   9.766103e-01

Photon flux (15-150 keV)    in 55.42 sec:  (    ) ph/cm2/s
Energy fluence (15-150 keV)             : 0 ( 0  0 ) ergs/cm2
S(25-50 keV) vs. S(50-100 keV) plot
S(25-50 keV)  = 1.44e-06
S(50-100 keV) = 1.93e-06
T90 vs. Hardness ratio plot

T90                                   = 62.8999999165535 sec.
Hardness ratio (energy fluence ratio) = 1.34028
Color vs. Color plot

Count Ratio  (25-50 keV) / (15-25 keV) = 1.25606
Count Ratio (50-100 keV) / (15-25 keV) = 0.904825
Mask shadow pattern

IMX = 2.808043337596885E-01, IMY = 4.320614184541564E-01
TIME vs. PHA plot around the trigger time

Blue+Cyan dotted lines: Time interval of the scaled map
From 0.000000 to 1.024000
TIME vs. DetID plot around the trigger time

Blue+Cyan dotted lines: Time interval of the scaled map
From 0.000000 to 1.024000
100 us light curve (15-350 keV)
Blue+Cyan dotted lines: Time interval of the scaled map
From 0.000000 to 1.024000
Spacecraft aspect plot

Bright source in the pre-burst/pre-slew/post-slew images
Pre-burst image of 15-350 keV band
Time interval of the image:
-200.963400 -43.584000

# RAcent  DECcent POSerr Theta    Phi  PeakCts   SNR AngSep     Name
#  [deg]    [deg]    ['] [deg]  [deg]                   [']
 83.6378  22.0209    0.3   8.5   14.0   6.6004  37.0    0.5	Crab
122.4246  42.8422    2.2  44.9   49.8   4.4097   5.3 ------	UNKNOWN
 84.7257  26.3181    0.2  12.9   16.4  13.6714  74.4 ------	UNKNOWN
 43.5735  13.7130    3.6  38.0  -76.7   1.7942   3.2 ------	UNKNOWN
Pre-slew background subtracted image of 15-350 keV band
Time interval of the image:
-43.584000 11.836600

# RAcent  DECcent POSerr Theta    Phi  PeakCts   SNR AngSep     Name
#  [deg]    [deg]    ['] [deg]  [deg]                   [']
 83.7834  22.0894   10.4   8.6   14.9  -0.1062  -1.1    9.5	Crab
 94.5817 -18.4724    2.3  34.1  167.9   0.6679   4.9 ------	UNKNOWN
 73.3891  61.5421    2.2  48.5    2.4   1.0690   5.1 ------	UNKNOWN
 55.7985  23.2435    0.6  27.3  -57.0   2.6429  20.7 ------	UNKNOWN
 63.9829 -11.7810    2.1  31.4 -134.6   0.7223   5.4 ------	UNKNOWN
 63.9834 -26.1202    2.1  43.7 -147.0   0.9877   5.4 ------	UNKNOWN
 32.7628  36.4570    2.3  50.0  -45.2   2.4253   5.0 ------	UNKNOWN
Post-slew image of 15-350 keV band
Time interval of the image:
61.436600 294.436590

# RAcent  DECcent POSerr Theta    Phi  PeakCts   SNR AngSep     Name
#  [deg]    [deg]    ['] [deg]  [deg]                   [']
 83.6420  22.0102    0.6  25.7   94.8   9.6615  20.8    0.6	Crab
 84.7305  26.3226    0.2  26.4   84.8  27.5325  54.7 ------	UNKNOWN
 67.7393 -31.5763    2.9  56.0  175.3   6.1113   3.9 ------	UNKNOWN
 21.1797  -5.7577    2.8  44.5 -118.7   6.9023   4.1 ------	UNKNOWN
Plot creation:
Sun May 31 02:25:50 EDT 2015