Special notes of this burst
Image
Pre-slew 15.0-350.0 keV image (Event data)

#   RAcent    DECcent   POSerr    Theta     Phi              Peak Cts       SNR   Name
   11.2802    -1.5866   0.0140    32.7093   169.8710         0.1315246     13.775 TRIG_00382941

Foreground time interval of the image:
 -0.008   0.316 (delta_t =   0.324 [sec])
Background time interval of the image:
-239.024  -0.008 (delta_t = 239.016 [sec])
Lightcurves
Notes:
- 1) The mask-weighted light curves are using the flight position.
- 2) Multiple plots of different time binning/intervals are shown to cover all scenarios of short/long GRBs, rate/image triggers, and real/false positives.
- 3) For all the mask-weighted lightcurves, the y-axis units are counts/sec/det where a det is 0.4 x 0.4 = 0.16 sq cm.
- 4) The verticle lines correspond to following: green dotted lines are T50 interval, black dotted lines are T90 interval, blue solid line(s) is a spacecraft slew start time, and orange solid line(s) is a spacecraft slew end time.
- 5) Time of each bin is in the middle of the bin.
1 s binning
From T0-310 s to T0+310 s

From T100_start - 20 s to T100_end + 30 s
Full time interval

64 ms binning
Full time interval
From T100_start to T100_end

From T0-5 sec to T0+5 sec

16 ms binning
From T100_start-5 s to T100_start+5 s

Blue+Cyan dotted lines: Time interval of the scaled map
From 0.000000 to 0.064000
8 ms binning
From T100_start-3 s to T100_start+3 s
Blue+Cyan dotted lines: Time interval of the scaled map
From 0.000000 to 0.064000
2 ms binning
From T100_start-1 s to T100_start+1 s

Blue+Cyan dotted lines: Time interval of the scaled map
From 0.000000 to 0.064000
SN=5 or 10 sec. binning (whichever binning is satisfied first)

SN=5 or 10 sec. binning (T < 200 sec)

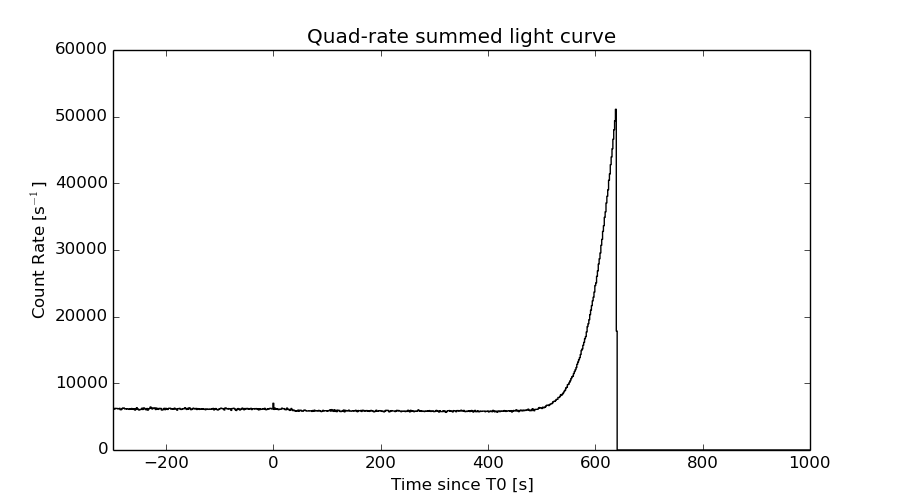
Quad-rate summed light curves (from T0-300s to T0+1000s)
Spectral Evolution

Spectra
Notes:
- 1) The fitting includes the systematic errors.
- 2) When the burst includes telescope slew time periods, the fitting uses an average response file made from multiple 5-s response files through out the slew time plus single time preiod for the non-slew times, and weighted by the total counts in the corresponding time period using addrmf. An average response file is needed becuase a spectral fit using the pre-slew DRM will introduce some errors in both a spectral shape and a normalization if the PHA file contains a lot of the slew/post-slew time interval.
- 3) For fits to more complicated models (e.g. a power-law over a cutoff power-law), the BAT team has decided to require a chi-square improvement of more than 6 for each extra dof.
Time averaged spectrum fit using the average DRM
Power-law model

Time interval is from   -0.008 sec. to    0.316 sec.

Spectral model in power-law:
------------------------------------------------------------
Parameters  : value       lower 90%   higher 90%
Photon index: 0.878879     ( -0.229124   0.217597 )
Norm@50keV  : 2.54999E-02    ( -0.00339627   0.00335871 )
------------------------------------------------------------
#Fit statistic : Chi-Squared =          62.29 using 59 PHA bins.
# Reduced chi-squared =          1.093 for     57 degrees of freedom
# Null hypothesis probability =   2.934392e-01

Photon flux (15-150 keV)    in 0.324 sec: 2.92663 ( -0.386472  0.387432 ) ph/cm2/s
Energy fluence (15-150 keV)             : 9.34918e-08 ( -1.26922e-08  1.27471e-08 ) ergs/cm2
Cutoff power-law model

Time interval is from   -0.008 sec. to    0.316 sec.
Spectral model in the cutoff power-law:
------------------------------------------------------------
Parameters  : value       lower 90%   higher 90%
Photon index: 0.629586     ( -1.01824   0.478812 )
Epeak [keV] : 331.096      ( -263.786 -263.786 )
Norm@50keV  : 3.25825E-02    ( -0.0125267   0.0506601 )
------------------------------------------------------------
#Fit statistic : Chi-Squared =          61.86 using 59 PHA bins.
# Reduced chi-squared =          1.105 for     56 degrees of freedom
# Null hypothesis probability =   2.749394e-01

Photon flux (15-150 keV)    in 0.324 sec: 2.89678 ( -0.19763  0.39449 ) ph/cm2/s
Energy fluence (15-150 keV)             : 9.26543e-08 ( -1.30925e-08  1.30157e-08 ) ergs/cm2
Band function
Time interval is from   -0.008 sec. to    0.316 sec.

Spectral model in the Band function:
------------------------------------------------------------
Parameters  : value       lower 90%   higher 90%
alpha       : 5.00000   ( -5   -5 )
beta        : -0.963602    ( -0.258771   0.254075 )
Epeak [keV] : 29.7645      ( -29.7629 9.68302 )
Norm@50keV   : 590.062    ( -74.5672   3.75213e+06 )
------------------------------------------------------------
#Fit statistic : Chi-Squared =          60.85 using 59 PHA bins.
# Reduced chi-squared =          1.106 for     55 degrees of freedom
# Null hypothesis probability =   2.736028e-01

Photon flux (15-150 keV)    in 0.324 sec:  (    ) ph/cm2/s
Energy fluence (15-150 keV)             : 0 ( 0  0 ) ergs/cm2
Single BB

Spectral model blackbody:
------------------------------------------------------------
Parameters  : value    Lower 90%  Upper 90%
kT [keV]    : 25.3930  (-4.03069  5.33013)
R^2/D10^2   : 7.03195E-02  (-0.030722   0.0496013)
(R is the radius in km and D10 is the distance to the source in units of 10 kpc)
------------------------------------------------------------
#Fit statistic : Chi-Squared =          69.62 using 59 PHA bins.
# Reduced chi-squared =          1.221 for     57 degrees of freedom
# Null hypothesis probability =   1.218781e-01

Energy  Fluence     90% Error
[keV]   [erg/cm2]   [erg/cm2]
15- 25  2.531e-09   6.948e-10
25- 50  1.447e-08   3.114e-09
50-150  6.903e-08   1.528e-08
15-150  8.603e-08   1.934e-08
Thermal bremsstrahlung (OTTB)
Spectral model: thermal bremsstrahlung
------------------------------------------------------------
Parameters  : value         Lower 90%    Upper 90%
kT [keV]    : 200.000       (      )
Norm        : 11.6660       (-1.60157     1.60152)
------------------------------------------------------------
#Fit statistic : Chi-Squared =          87.09 using 59 PHA bins.
# Reduced chi-squared =          1.528 for     57 degrees of freedom
# Null hypothesis probability =   6.298194e-03

Energy  Fluence     90% Error
[keV]   [erg/cm2]   [erg/cm2]
15- 25  9.413e-09   5.301e-09
25- 50  1.811e-08   1.029e-08
50-150  3.971e-08   2.249e-08
15-150  6.724e-08   3.810e-08
Double BB

Spectral model: bbodyrad<1> + bbodyrad<2>
------------------------------------------------------------
Parameters  : value         Lower 90%    Upper 90%
kT1 [keV]   : 6.89265        (-2.49892      4.51236)
R1^2/D10^2  : 1.90801        (-1.57699      7.62582)
kT2 [keV]   : 33.5348        (-7.62548      18.0332)
R2^2/D10^2  : 2.76270E-02    (-0.0195698   0.0342574)
------------------------------------------------------------
#Fit statistic : Chi-Squared =          59.85 using 59 PHA bins.
# Reduced chi-squared =          1.088 for     55 degrees of freedom
# Null hypothesis probability =   3.041811e-01

Energy  Fluence     90% Error
[keV]   [erg/cm2]   [erg/cm2]
15- 25  6.109e-09   3.468e-09
25- 50  1.561e-08   7.841e-09
50-150  7.221e-08   3.963e-08
15-150  9.393e-08   4.621e-08
Peak spectrum fit
Power-law model

Time interval is from   -0.344 sec. to    0.656 sec.

Spectral model in power-law:
------------------------------------------------------------
Parameters  : value       lower 90%   higher 90%
Photon index: 0.915957     ( -0.356974   0.32875 )
Norm@50keV  : 8.35252E-03    ( -0.00162185   0.00158356 )
------------------------------------------------------------
#Fit statistic : Chi-Squared =          56.39 using 59 PHA bins.
# Reduced chi-squared =         0.9894 for     57 degrees of freedom
# Null hypothesis probability =   4.977762e-01

Photon flux (15-150 keV)    in 1 sec: 0.958888 ( -0.184363  0.185486 ) ph/cm2/s
Energy fluence (15-150 keV)             : 9.31611e-08 ( -1.78676e-08  1.79894e-08 ) ergs/cm2
Cutoff power-law model

Time interval is from   -0.344 sec. to    0.656 sec.
Spectral model in the cutoff power-law:
------------------------------------------------------------
Parameters  : value       lower 90%   higher 90%
Photon index: 2.15267     (     )
Epeak [keV] : 51.0547      (   )
Norm@50keV  : 6.61990E-04    (     )
------------------------------------------------------------
#Fit statistic : Chi-Squared =          56.17 using 59 PHA bins.
# Reduced chi-squared =          1.003 for     56 degrees of freedom
# Null hypothesis probability =   4.683124e-01

Photon flux (15-150 keV)    in 1 sec: 0.960418 ( -0.187261  0.183772 ) ph/cm2/s
Energy fluence (15-150 keV)             : 9.31305e-08 ( -1.78415e-08  1.79495e-08 ) ergs/cm2
Band function
Time interval is from   -0.344 sec. to    0.656 sec.

Spectral model in the Band function:
------------------------------------------------------------
Parameters  : value       lower 90%   higher 90%
alpha       : -0.798522   ( 0.798521   0.798521 )
beta        : -0.915957    ( -0.328757   0.357405 )
Epeak [keV] : 33.7172      ( -33.7257 -33.7257 )
Norm@50keV   : 1.29275E-02    ( -0.0061045   0 )
------------------------------------------------------------
#Fit statistic : Chi-Squared =          56.39 using 59 PHA bins.
# Reduced chi-squared =          1.025 for     55 degrees of freedom
# Null hypothesis probability =   4.225869e-01

Photon flux (15-150 keV)    in 1 sec:  (    ) ph/cm2/s
Energy fluence (15-150 keV)             : 0 ( 0  0 ) ergs/cm2
Single BB

Spectral model blackbody:
------------------------------------------------------------
Parameters  : value    Lower 90%  Upper 90%
kT [keV]    : 25.8977  (-6.09377  9.60295)
R^2/D10^2   : 2.09814E-02  (-0.0126714   0.0272022)
(R is the radius in km and D10 is the distance to the source in units of 10 kpc)
------------------------------------------------------------
#Fit statistic : Chi-Squared =          62.55 using 59 PHA bins.
# Reduced chi-squared =          1.097 for     57 degrees of freedom
# Null hypothesis probability =   2.858928e-01

Energy  Fluence     90% Error
[keV]   [erg/cm2]   [erg/cm2]
15- 25  2.398e-09   9.435e-10
25- 50  1.385e-08   5.335e-09
50-150  6.847e-08   2.608e-08
15-150  8.472e-08   2.796e-08
Thermal bremsstrahlung (OTTB)

Spectral model: thermal bremsstrahlung
------------------------------------------------------------
Parameters  : value         Lower 90%    Upper 90%
kT [keV]    : 200.000       (      )
Norm        : 3.96019       (-0.766086     0.765995)
------------------------------------------------------------
#Fit statistic : Chi-Squared =          66.89 using 59 PHA bins.
# Reduced chi-squared =          1.173 for     57 degrees of freedom
# Null hypothesis probability =   1.738415e-01

Energy  Fluence     90% Error
[keV]   [erg/cm2]   [erg/cm2]
15- 25  9.861e-09   5.760e-09
25- 50  1.897e-08   1.118e-08
50-150  4.160e-08   2.381e-08
15-150  7.043e-08   4.056e-08
Double BB

Spectral model: bbodyrad<1> + bbodyrad<2>
------------------------------------------------------------
Parameters  : value         Lower 90%    Upper 90%
kT1 [keV]   : 8.20626        (-4.24934      7.91292)
R1^2/D10^2  : 0.434086        (-0.374612      5.53832)
kT2 [keV]   : 41.9420        (-20.0279      -41.9523)
R2^2/D10^2  : 4.52185E-03    (-0.00440623   0.0152747)
------------------------------------------------------------
#Fit statistic : Chi-Squared =          55.92 using 59 PHA bins.
# Reduced chi-squared =          1.017 for     55 degrees of freedom
# Null hypothesis probability =   4.402041e-01

Energy  Fluence     90% Error
[keV]   [erg/cm2]   [erg/cm2]
15- 25  6.375e-09   3.795e-09
25- 50  1.670e-08   9.060e-09
50-150  7.220e-08   4.064e-08
15-150  9.527e-08   4.880e-08
Pre-slew spectrum (Pre-slew PHA with pre-slew DRM)
Power-law model
Spectral model in power-law:
------------------------------------------------------------
Parameters  : value       lower 90%   higher 90%
Photon index: 0.878879     ( -0.229124   0.217597 )
Norm@50keV  : 2.54999E-02    ( -0.00339627   0.00335871 )
------------------------------------------------------------
#Fit statistic : Chi-Squared =          62.29 using 59 PHA bins.
# Reduced chi-squared =          1.093 for     57 degrees of freedom
# Null hypothesis probability =   2.934392e-01

Photon flux (15-150 keV)    in 0.324 sec: 2.92663 ( -0.386472  0.387432 ) ph/cm2/s
Energy fluence (15-150 keV)             : 9.34918e-08 ( -1.26922e-08  1.27471e-08 ) ergs/cm2
Cutoff power-law model

Spectral model in the cutoff power-law:
------------------------------------------------------------
Parameters  : value       lower 90%   higher 90%
Photon index: 0.629586     ( -1.01824   0.478812 )
Epeak [keV] : 331.096      ( -263.786 -263.786 )
Norm@50keV  : 3.25825E-02    ( -0.0125267   0.0506601 )
------------------------------------------------------------
#Fit statistic : Chi-Squared =          61.86 using 59 PHA bins.
# Reduced chi-squared =          1.105 for     56 degrees of freedom
# Null hypothesis probability =   2.749394e-01

Photon flux (15-150 keV)    in 0.324 sec: 2.89678 ( -0.19763  0.39449 ) ph/cm2/s
Energy fluence (15-150 keV)             : 9.26543e-08 ( -1.30925e-08  1.30157e-08 ) ergs/cm2
Band function

Spectral model in the Band function:
------------------------------------------------------------
Parameters  : value       lower 90%   higher 90%
alpha       : 5.00000   ( -5   -5 )
beta        : -0.963602    ( -0.258771   0.254075 )
Epeak [keV] : 29.7645      ( -29.7629 9.68302 )
Norm@50keV   : 590.062    ( -74.5672   3.75213e+06 )
------------------------------------------------------------
#Fit statistic : Chi-Squared =          60.85 using 59 PHA bins.
# Reduced chi-squared =          1.106 for     55 degrees of freedom
# Null hypothesis probability =   2.736028e-01

Photon flux (15-150 keV)    in 0.324 sec:  (    ) ph/cm2/s
Energy fluence (15-150 keV)             : 0 ( 0  0 ) ergs/cm2
S(25-50 keV) vs. S(50-100 keV) plot

S(25-50 keV)  = 1.59e-08
S(50-100 keV) = 3.47e-08
T90 vs. Hardness ratio plot

T90                                   = 0.291999936103821 sec.
Hardness ratio (energy fluence ratio) = 2.18239
Color vs. Color plot

Count Ratio  (25-50 keV) / (15-25 keV) = 1.65716
Count Ratio (50-100 keV) / (15-25 keV) = 2.46258
Mask shadow pattern

IMX = -6.322094570189947E-01, IMY = -1.129433774141745E-01
TIME vs. PHA plot around the trigger time
Blue+Cyan dotted lines: Time interval of the scaled map
From 0.000000 to 0.064000
TIME vs. DetID plot around the trigger time

Blue+Cyan dotted lines: Time interval of the scaled map
From 0.000000 to 0.064000
100 us light curve (15-350 keV)
Blue+Cyan dotted lines: Time interval of the scaled map
From 0.000000 to 0.064000
Spacecraft aspect plot

Bright source in the pre-burst/pre-slew/post-slew images
Pre-burst image of 15-350 keV band
Time interval of the image:
-239.024000 -0.008000

# RAcent  DECcent POSerr Theta    Phi  PeakCts   SNR AngSep     Name
#  [deg]    [deg]    ['] [deg]  [deg]                   [']
288.7678  10.9322    9.6  53.3  -38.8   1.1815   1.2    2.0	GRS 1915+105
299.5802  35.2070    0.4  43.4   -6.0  11.3969  32.0    0.6	Cyg X-1
308.1440  40.9493    3.0  39.2    5.8   1.1632   3.8    1.5	Cyg X-3
325.9324  38.3095    6.4  27.0   18.0   0.4033   1.8   11.3	Cyg X-2
 21.7346 -15.4813    2.7  49.3  177.6   1.9788   4.3 ------	UNKNOWN
 23.2629 -25.9129    3.2  57.2 -173.7   4.0230   3.7 ------	UNKNOWN
 23.4923 -27.7317    3.3  58.6 -172.3   4.8972   3.6 ------	UNKNOWN
 19.5304 -31.7290    2.4  59.1 -166.2   7.6029   4.9 ------	UNKNOWN
Pre-slew background subtracted image of 15-350 keV band
Time interval of the image:
-0.008000 0.316000

# RAcent  DECcent POSerr Theta    Phi  PeakCts   SNR AngSep     Name
#  [deg]    [deg]    ['] [deg]  [deg]                   [']
288.7896  11.0813    3.3  53.2  -38.6   0.1187   3.5    8.2	GRS 1915+105
299.6337  35.0885    3.9  43.4   -6.1   0.0369   2.9    7.1	Cyg X-1
308.1463  40.9835   33.0  39.3    5.9   0.0038   0.3    2.5	Cyg X-3
326.2377  38.1341    0.0  26.7   18.2   0.0065   0.8   11.7	Cyg X-2
 11.2802  -1.5866    0.8  32.7  169.9   0.1316  13.8 ------	UNKNOWN
Post-slew image of 15-350 keV band
Time interval of the image:
68.676590 663.136000

# RAcent  DECcent POSerr Theta    Phi  PeakCts   SNR AngSep     Name
#  [deg]    [deg]    ['] [deg]  [deg]                   [']
326.1423  38.1425    7.6  57.5  -20.0   2.0527   1.5   10.8	Cyg X-2
 10.4314  36.4025    2.6  38.0   20.3   1.9276   4.4 ------	UNKNOWN
343.9329  34.6366    2.4  44.3  -11.4   2.0767   4.8 ------	UNKNOWN
 29.5502 -57.0324    3.7  57.4 -170.3   4.1367   3.1 ------	UNKNOWN
355.5916 -30.4899    4.5  32.5 -133.0   1.0504   2.6 ------	UNKNOWN
332.5299 -16.6145    3.0  41.0  -92.5   5.8228   3.8 ------	UNKNOWN
Plot creation:
Sun May 31 02:21:45 EDT 2015