Special notes of this burst
Image
Pre-slew 15.0-350.0 keV image (Event data)
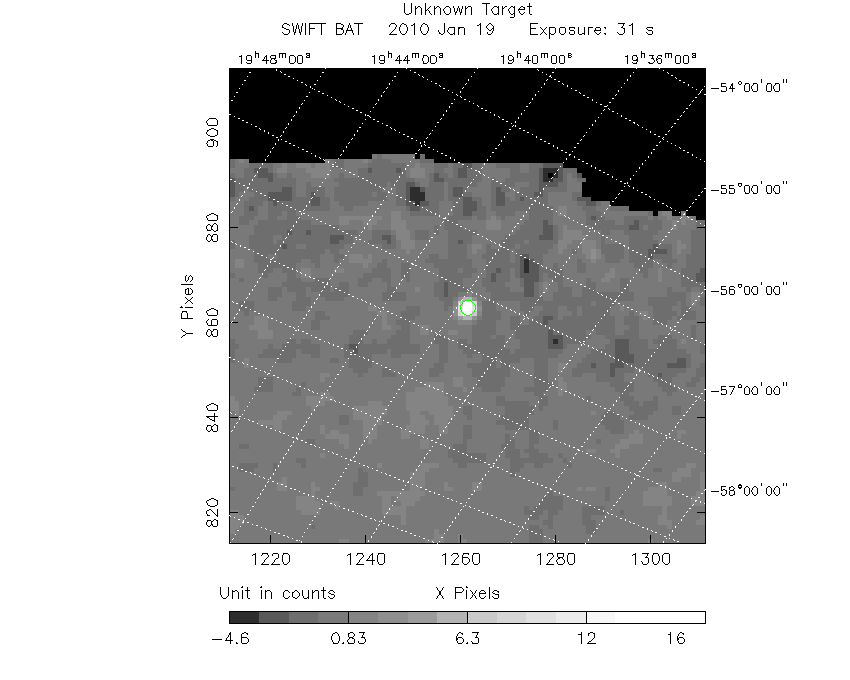
#   RAcent    DECcent   POSerr    Theta     Phi              Peak Cts       SNR   Name
  299.3068   -53.1500   0.0080    48.7835  -134.6594        19.4482090     24.159 TRIG_00383063

Foreground time interval of the image:
-15.760  15.452 (delta_t =  31.212 [sec])
Background time interval of the image:
-179.200 -15.760 (delta_t = 163.440 [sec])
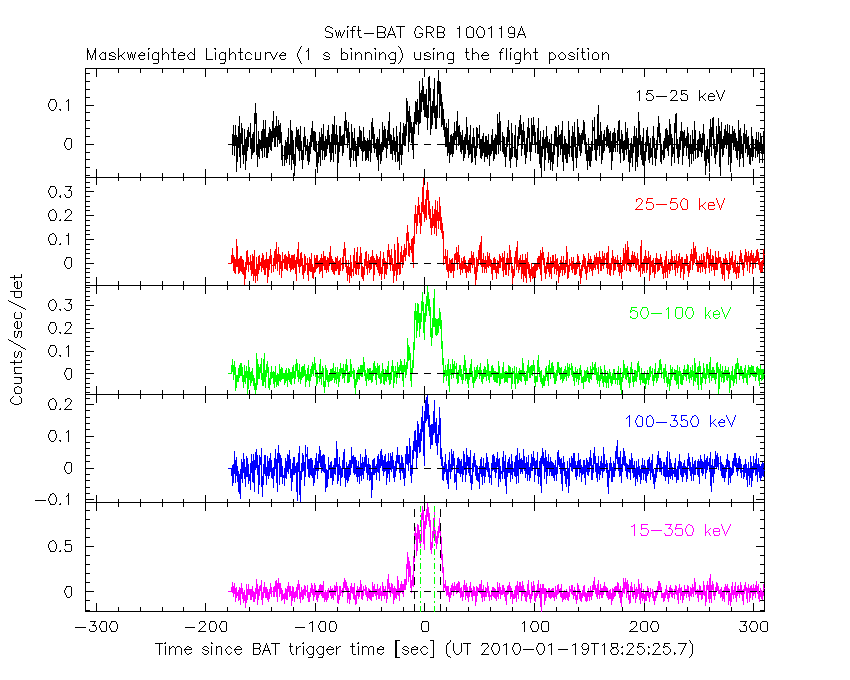
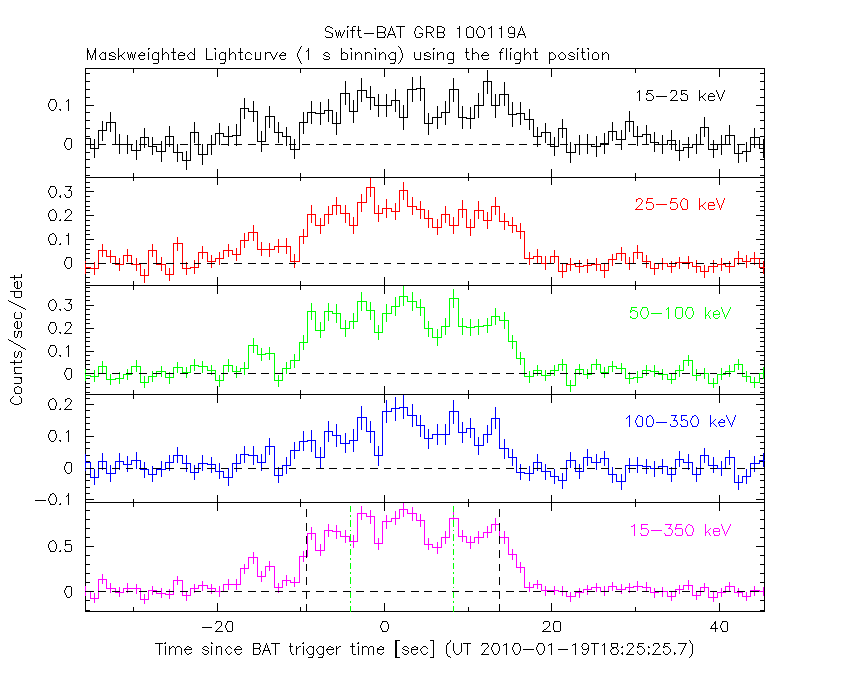
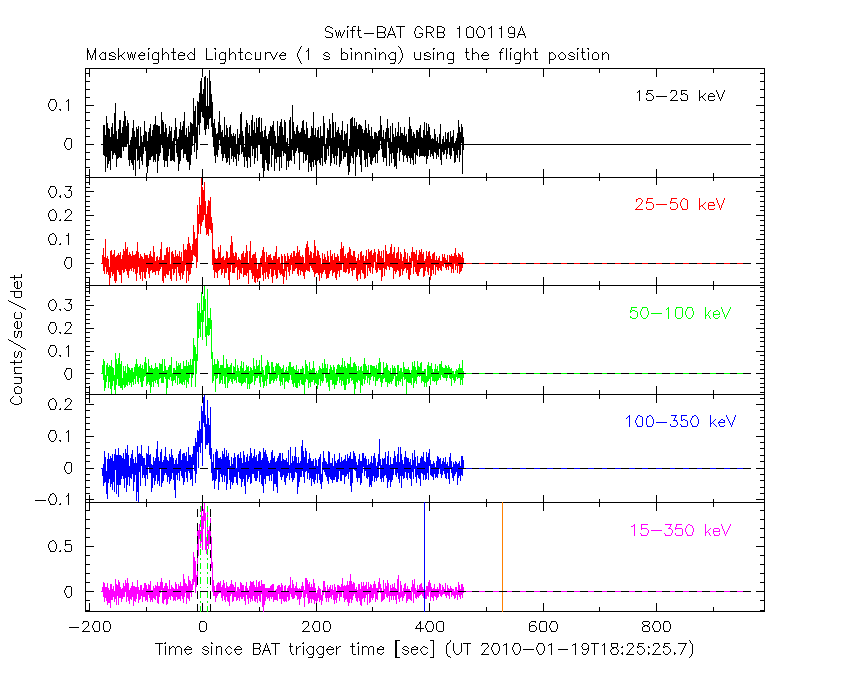
Lightcurves
Notes:
- 1) The mask-weighted light curves are using the flight position.
- 2) Multiple plots of different time binning/intervals are shown to cover all scenarios of short/long GRBs, rate/image triggers, and real/false positives.
- 3) For all the mask-weighted lightcurves, the y-axis units are counts/sec/det where a det is 0.4 x 0.4 = 0.16 sq cm.
- 4) The verticle lines correspond to following: green dotted lines are T50 interval, black dotted lines are T90 interval, blue solid line(s) is a spacecraft slew start time, and orange solid line(s) is a spacecraft slew end time.
- 5) Time of each bin is in the middle of the bin.
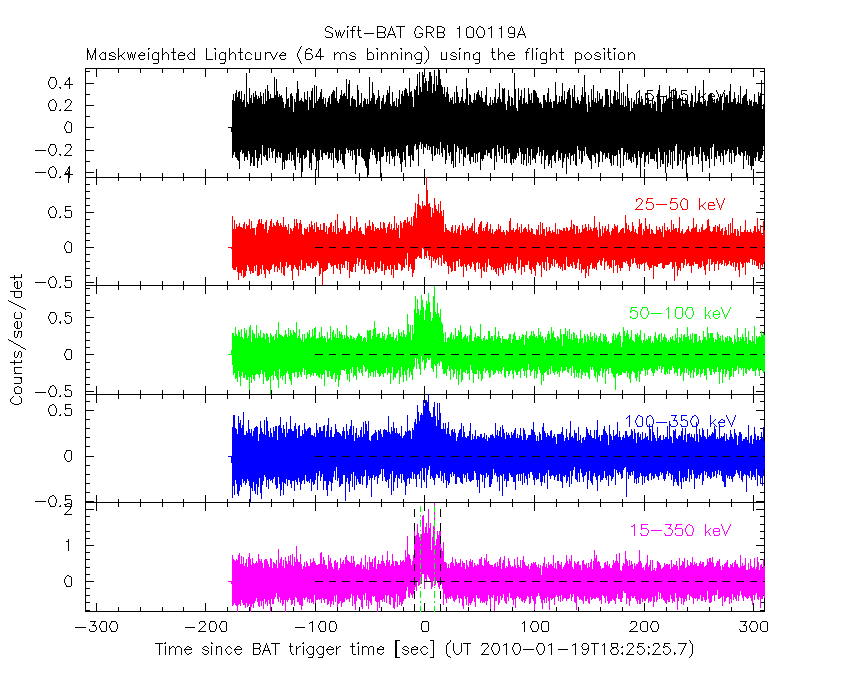
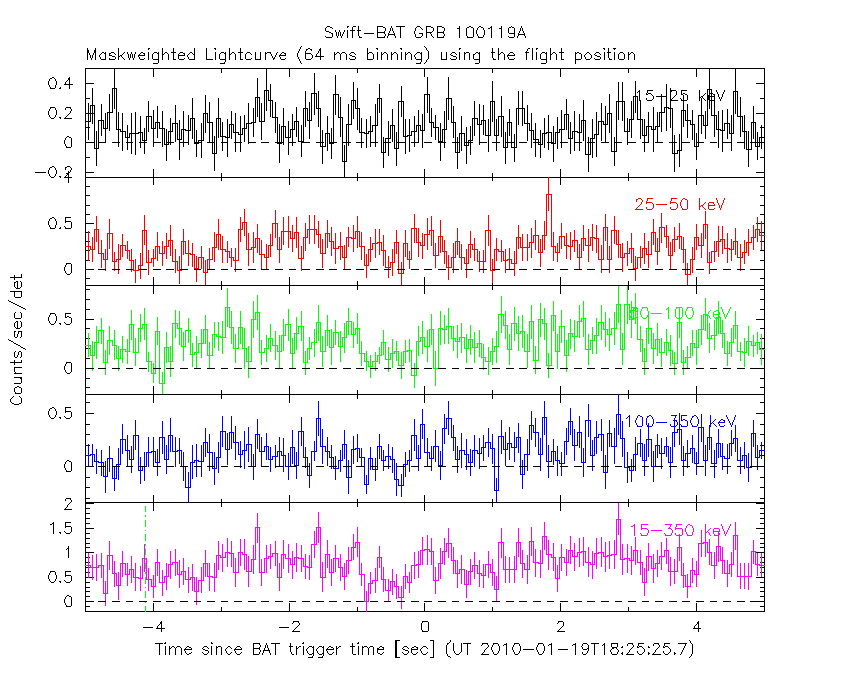
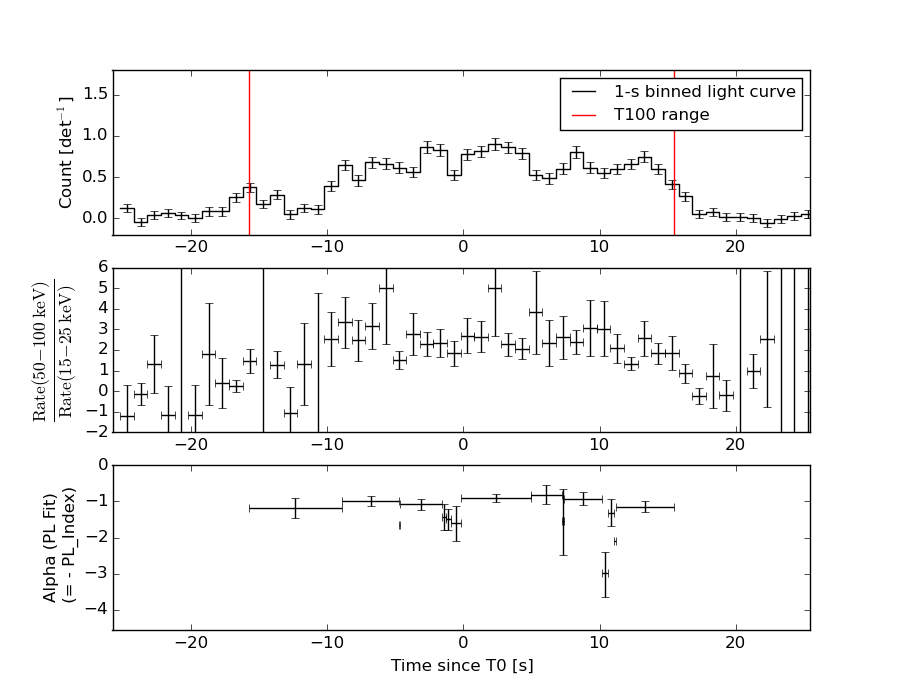
1 s binning
From T0-310 s to T0+310 s
From T100_start - 20 s to T100_end + 30 s
Full time interval
64 ms binning
Full time interval
From T100_start to T100_end
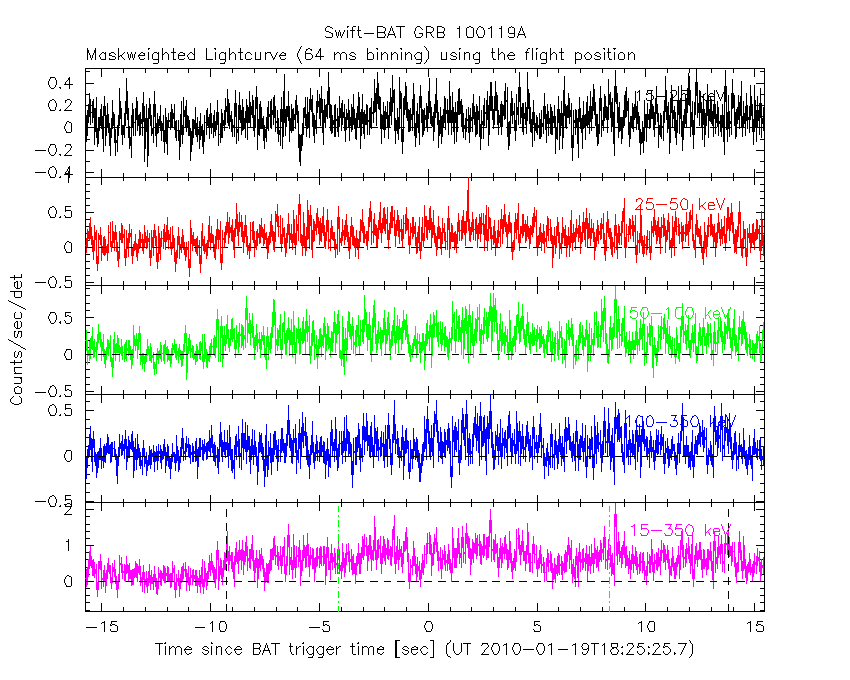
From T0-5 sec to T0+5 sec
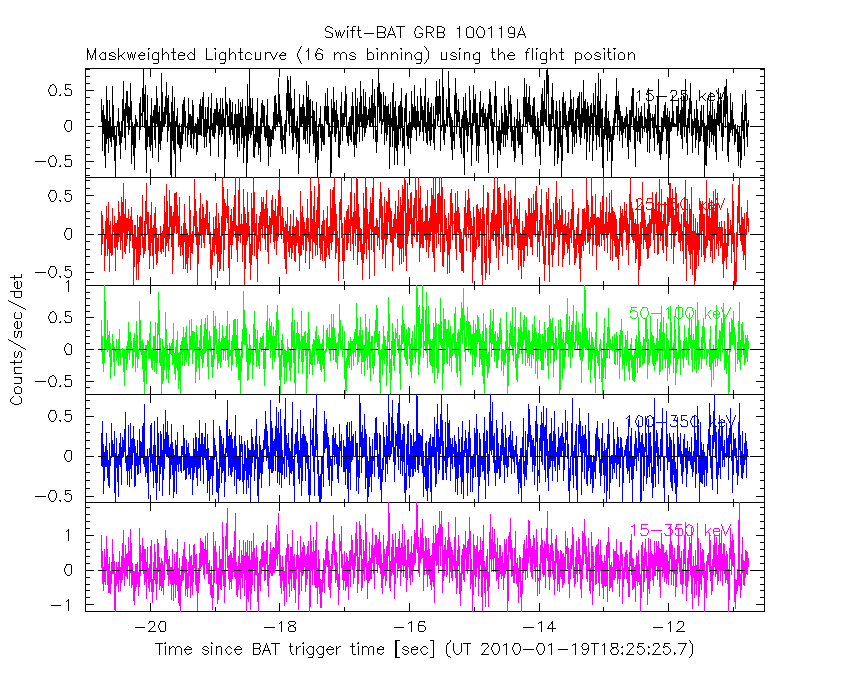
16 ms binning
From T100_start-5 s to T100_start+5 s
Blue+Cyan dotted lines: Time interval of the scaled map
From 0.000000 to 2.048000
8 ms binning
From T100_start-3 s to T100_start+3 s
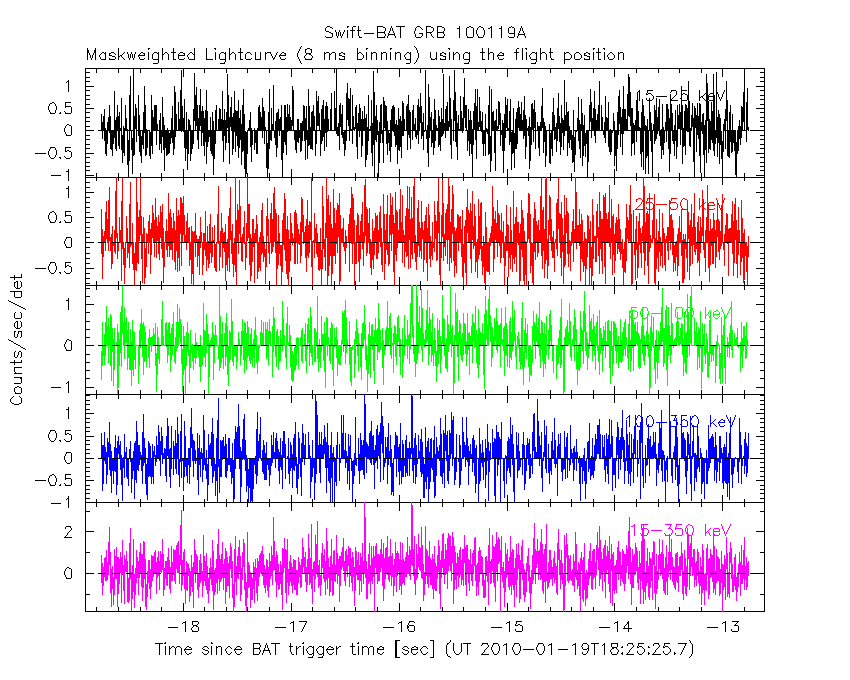
Blue+Cyan dotted lines: Time interval of the scaled map
From 0.000000 to 2.048000
2 ms binning
From T100_start-1 s to T100_start+1 s
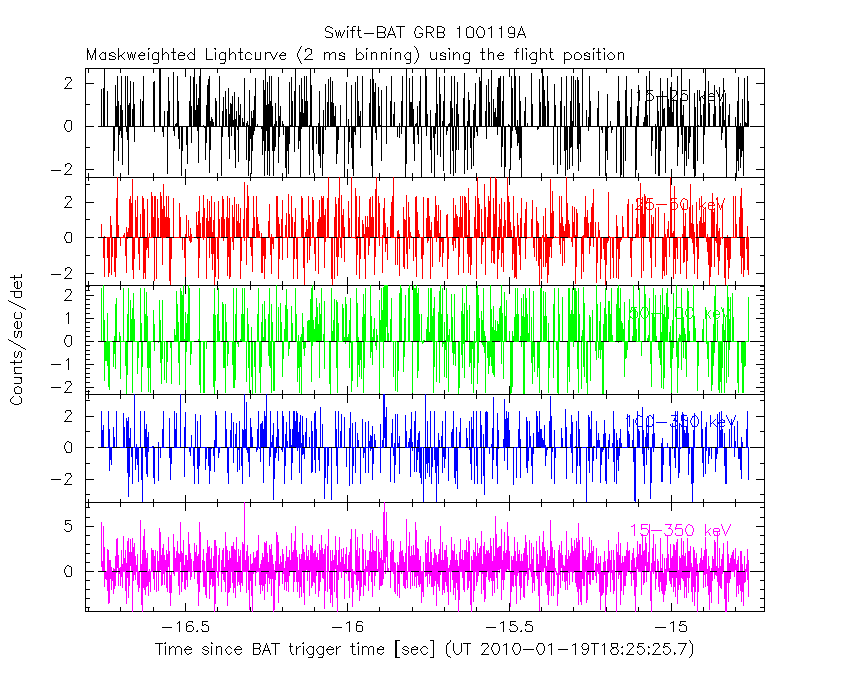
Blue+Cyan dotted lines: Time interval of the scaled map
From 0.000000 to 2.048000
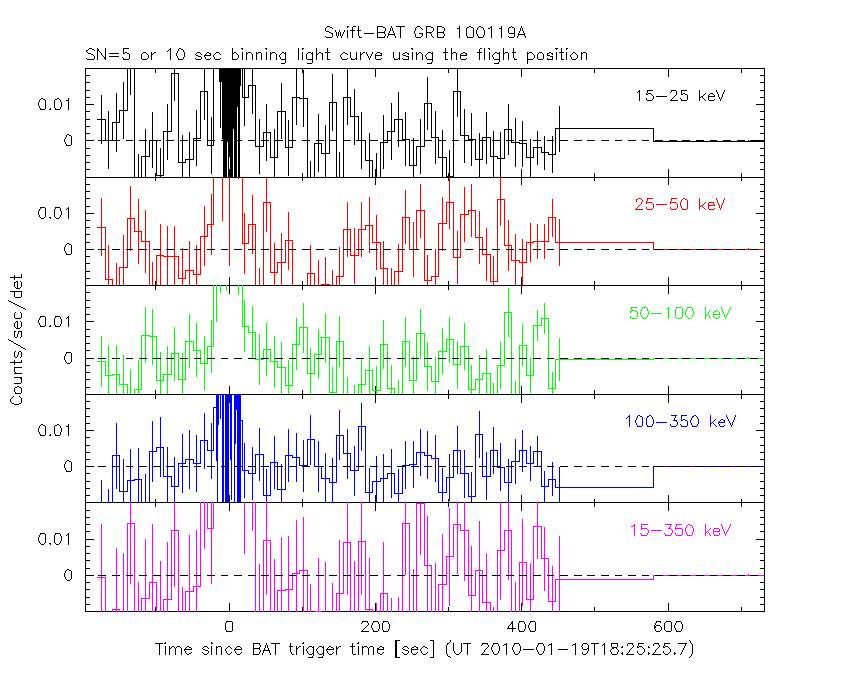
SN=5 or 10 sec. binning (whichever binning is satisfied first)
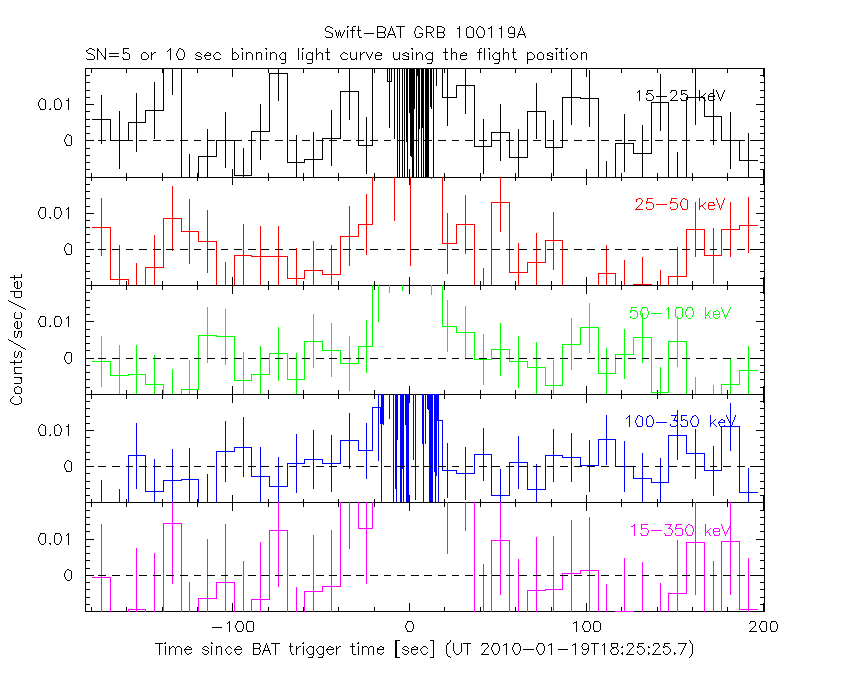
SN=5 or 10 sec. binning (T < 200 sec)
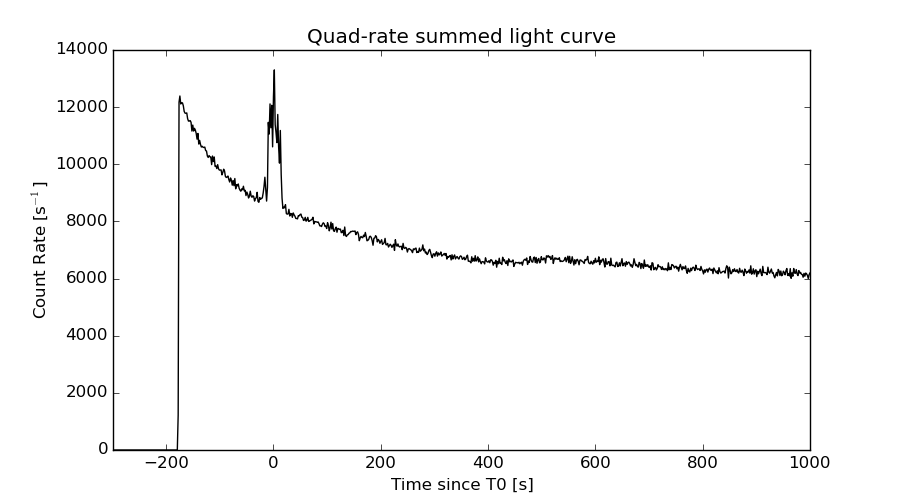
Quad-rate summed light curves (from T0-300s to T0+1000s)
Spectral Evolution
Spectra
Notes:
- 1) The fitting includes the systematic errors.
- 2) When the burst includes telescope slew time periods, the fitting uses an average response file made from multiple 5-s response files through out the slew time plus single time preiod for the non-slew times, and weighted by the total counts in the corresponding time period using addrmf. An average response file is needed becuase a spectral fit using the pre-slew DRM will introduce some errors in both a spectral shape and a normalization if the PHA file contains a lot of the slew/post-slew time interval.
- 3) For fits to more complicated models (e.g. a power-law over a cutoff power-law), the BAT team has decided to require a chi-square improvement of more than 6 for each extra dof.
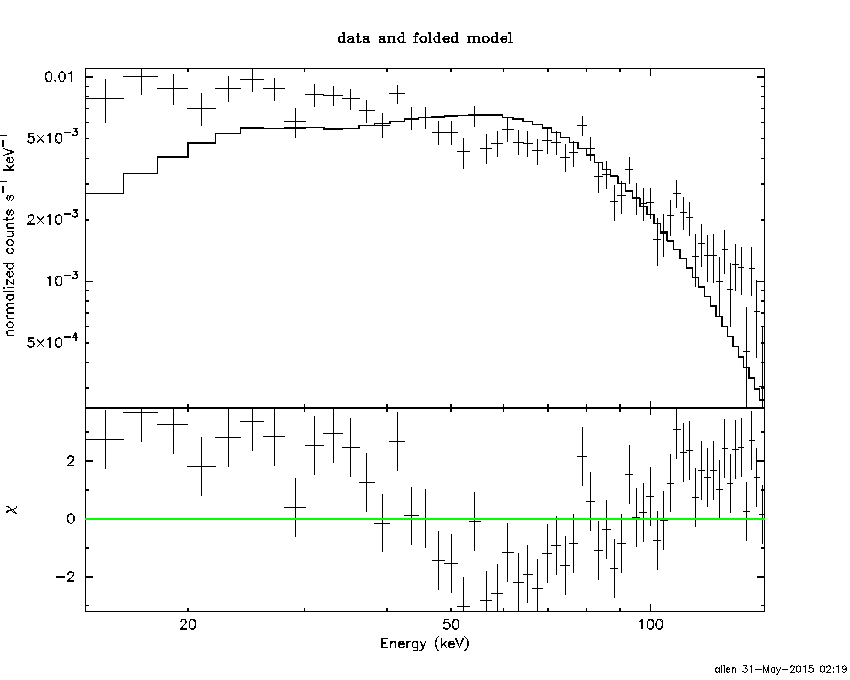
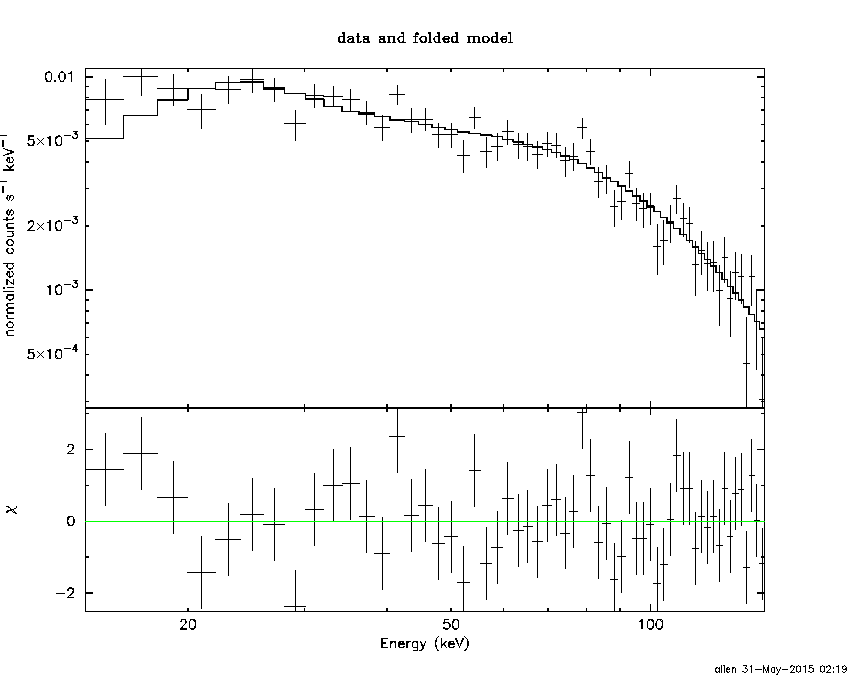
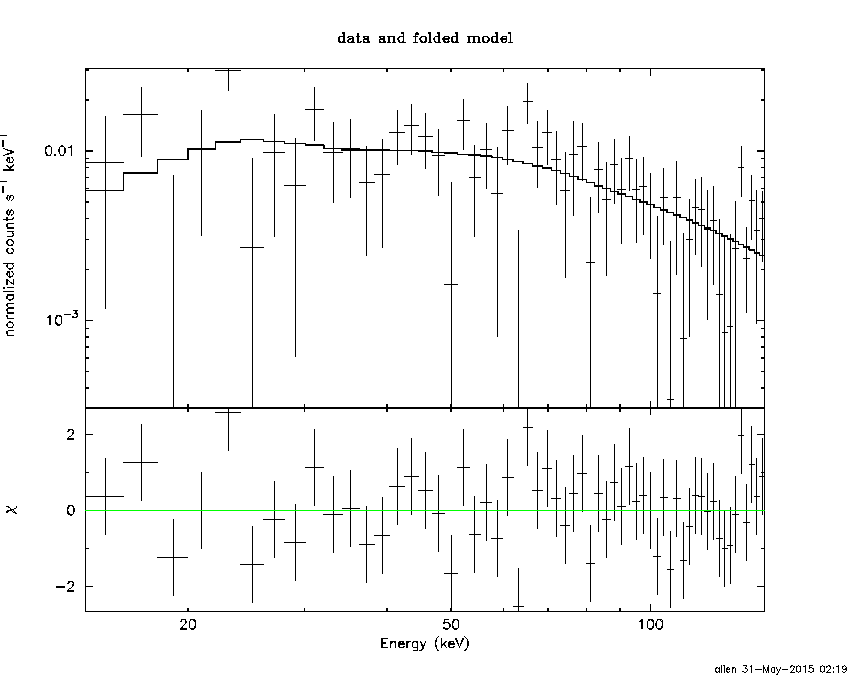
Time averaged spectrum fit using the average DRM
Power-law model

Time interval is from  -15.760 sec. to   15.452 sec.

Spectral model in power-law:
------------------------------------------------------------
Parameters  : value       lower 90%   higher 90%
Photon index: 1.01102     ( -0.0629294   0.0622624 )
Norm@50keV  : 4.11139E-02    ( -0.00148044   0.00147483 )
------------------------------------------------------------
#Fit statistic : Chi-Squared =          67.54 using 59 PHA bins.
# Reduced chi-squared =          1.185 for     57 degrees of freedom
# Null hypothesis probability =   1.600924e-01

Photon flux (15-150 keV)    in 31.21 sec: 4.73715 ( -0.177061  0.17577 ) ph/cm2/s
Energy fluence (15-150 keV)             : 1.38227e-05 ( -4.90056e-07  4.89941e-07 ) ergs/cm2
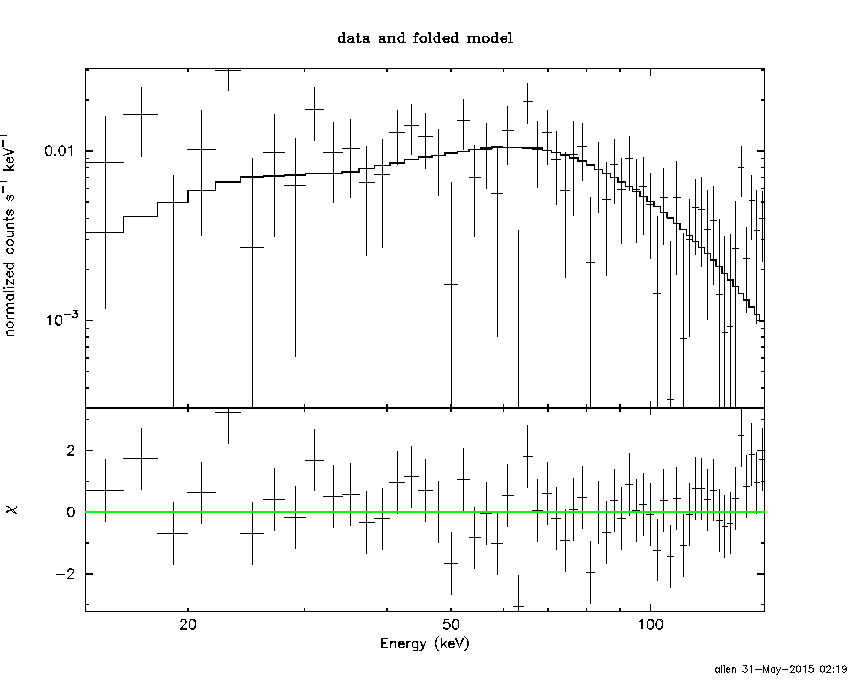
Cutoff power-law model

Time interval is from  -15.760 sec. to   15.452 sec.
Spectral model in the cutoff power-law:
------------------------------------------------------------
Parameters  : value       lower 90%   higher 90%
Photon index: 0.935530     ( -0.249411   0.100726 )
Epeak [keV] : 877.049      ( -877.05 -877.05 )
Norm@50keV  : 4.41586E-02    ( -0.0016783   0.011376 )
------------------------------------------------------------
#Fit statistic : Chi-Squared =          67.26 using 59 PHA bins.
# Reduced chi-squared =          1.201 for     56 degrees of freedom
# Null hypothesis probability =   1.441371e-01

Photon flux (15-150 keV)    in 31.21 sec: 4.71866 ( -0.18397  0.18452 ) ph/cm2/s
Energy fluence (15-150 keV)             : 1.38035e-05 ( -4.9936e-07  4.93898e-07 ) ergs/cm2
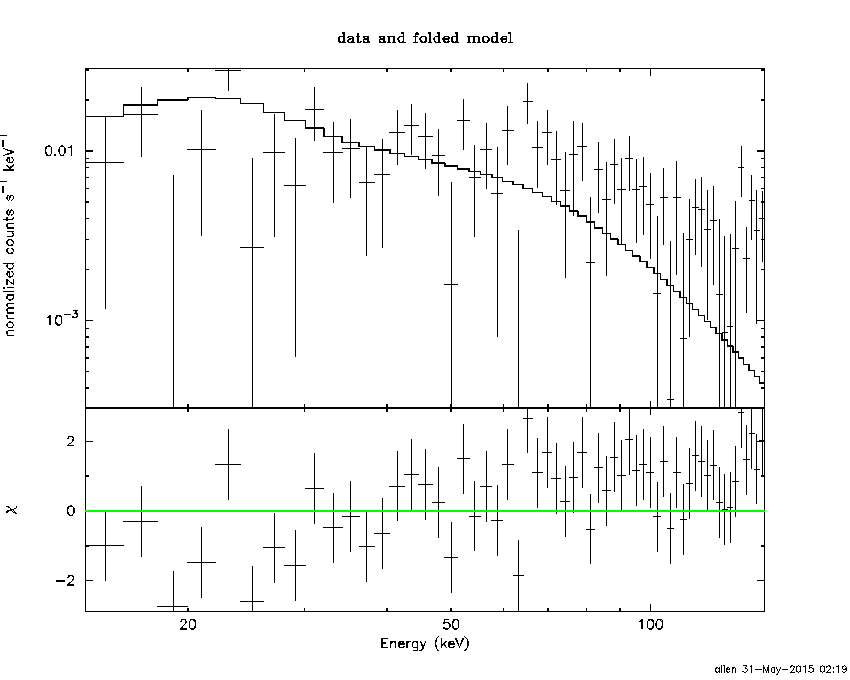
Band function

Time interval is from  -15.760 sec. to   15.452 sec.

Spectral model in the Band function:
------------------------------------------------------------
Parameters  : value       lower 90%   higher 90%
alpha       : -0.476153   ( 0.7966   0.7966 )
beta        : -1.05659    ( -0.0622535   0.0629395 )
Epeak [keV] : 113.399      ( -112.768 240.154 )
Norm@50keV   : 8.18665E-02    ( -0.0414355   907555 )
------------------------------------------------------------
#Fit statistic : Chi-Squared =          66.39 using 59 PHA bins.
# Reduced chi-squared =          1.207 for     55 degrees of freedom
# Null hypothesis probability =   1.397977e-01

Photon flux (15-150 keV)    in 31.21 sec:  (    ) ph/cm2/s
Energy fluence (15-150 keV)             : 0 ( 0  0 ) ergs/cm2
Single BB
Spectral model blackbody:
------------------------------------------------------------
Parameters  : value    Lower 90%  Upper 90%
kT [keV]    : 24.0982  (  )
R^2/D10^2   : 0.126385  (   )
(R is the radius in km and D10 is the distance to the source in units of 10 kpc)
------------------------------------------------------------
#Fit statistic : Chi-Squared =         214.87 using 59 PHA bins.
# Reduced chi-squared =         3.7697 for     57 degrees of freedom
# Null hypothesis probability =   3.679505e-20

Energy  Fluence     90% Error
[keV]   [erg/cm2]   [erg/cm2]
15- 25  4.056e-07   2.934e-08
25- 50  2.257e-06   1.308e-07
50-150  9.763e-06   4.775e-07
15-150  1.243e-05   4.682e-07
Thermal bremsstrahlung (OTTB)
Spectral model: thermal bremsstrahlung
------------------------------------------------------------
Parameters  : value         Lower 90%    Upper 90%
kT [keV]    : 199.363       (      )
Norm        : 20.2819       (     )
------------------------------------------------------------
#Fit statistic : Chi-Squared =         293.88 using 59 PHA bins.
# Reduced chi-squared =         5.1558 for     57 degrees of freedom
# Null hypothesis probability =   1.294070e-33

Energy  Fluence     90% Error
[keV]   [erg/cm2]   [erg/cm2]
15- 25  1.576e-06   6.336e-08
25- 50  3.032e-06   1.195e-07
50-150  6.650e-06   2.434e-07
15-150  1.126e-05   4.120e-07
Double BB
Spectral model: bbodyrad<1> + bbodyrad<2>
------------------------------------------------------------
Parameters  : value         Lower 90%    Upper 90%
kT1 [keV]   : 9.56232        (-1.29054      1.46169)
R1^2/D10^2  : 1.31583        (-0.441491      0.729668)
kT2 [keV]   : 41.1758        (-5.58208      9.05519)
R2^2/D10^2  : 2.09037E-02    (-0.00912081   0.0118808)
------------------------------------------------------------
#Fit statistic : Chi-Squared =          66.25 using 59 PHA bins.
# Reduced chi-squared =          1.205 for     55 degrees of freedom
# Null hypothesis probability =   1.423945e-01

Energy  Fluence     90% Error
[keV]   [erg/cm2]   [erg/cm2]
15- 25  8.917e-07   1.328e-07
25- 50  2.714e-06   2.854e-07
50-150  1.032e-05   1.451e-06
15-150  1.393e-05   1.688e-06
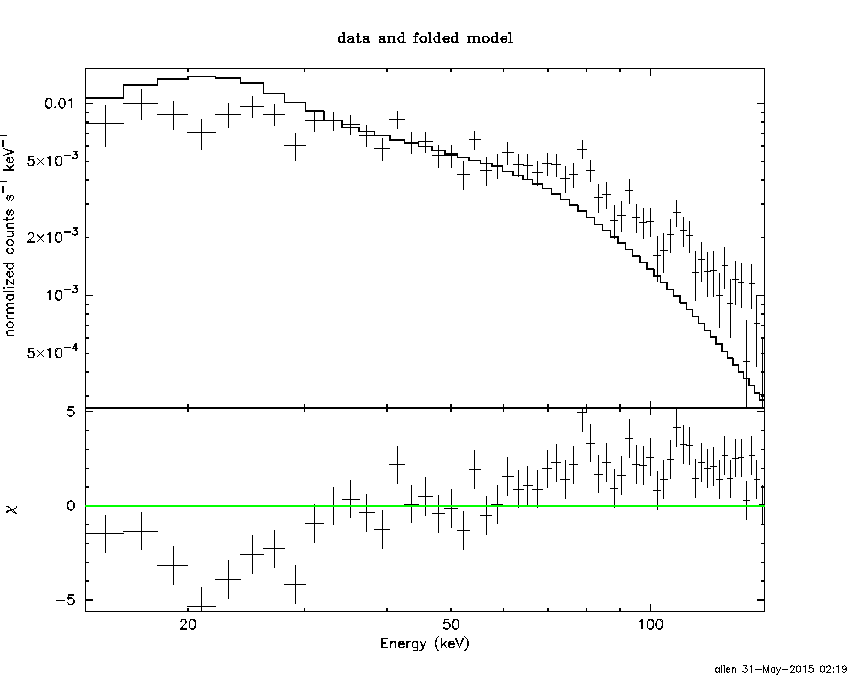
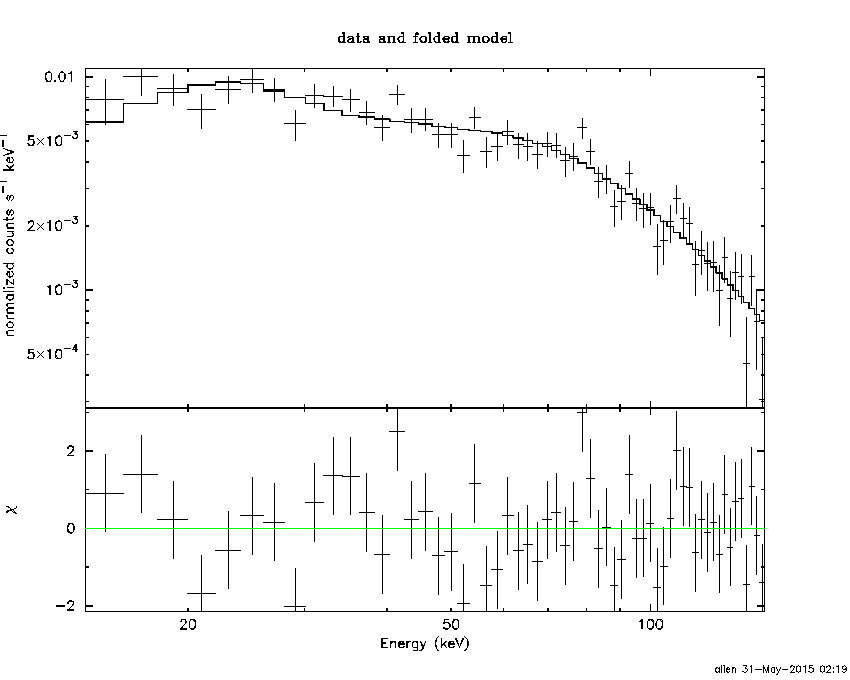
Peak spectrum fit
Power-law model
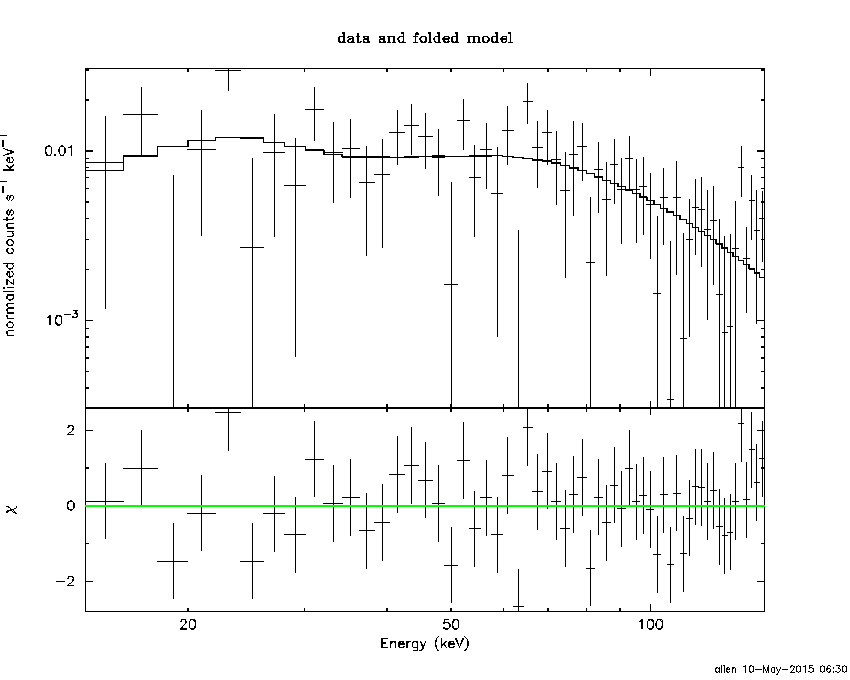
Time interval is from    2.120 sec. to    3.120 sec.

Spectral model in power-law:
------------------------------------------------------------
Parameters  : value       lower 90%   higher 90%
Photon index: 0.652143     ( -0.246187   0.229083 )
Norm@50keV  : 6.50581E-02    ( -0.00949041   0.00914798 )
------------------------------------------------------------
#Fit statistic : Chi-Squared =          57.12 using 59 PHA bins.
# Reduced chi-squared =          1.002 for     57 degrees of freedom
# Null hypothesis probability =   4.707830e-01

Photon flux (15-150 keV)    in 1 sec: 7.55227 ( -0.992308  0.997326 ) ph/cm2/s
Energy fluence (15-150 keV)             : 8.1172e-07 ( -1.01312e-07  1.01414e-07 ) ergs/cm2
Cutoff power-law model

Time interval is from    2.120 sec. to    3.120 sec.
Spectral model in the cutoff power-law:
------------------------------------------------------------
Parameters  : value       lower 90%   higher 90%
Photon index: 0.643273     ( -0.601754   0.320302 )
Epeak [keV] : 9999.36      (   )
Norm@50keV  : 6.55738E-02    ( -0.00877185   0.0445064 )
------------------------------------------------------------
#Fit statistic : Chi-Squared =          57.14 using 59 PHA bins.
# Reduced chi-squared =          1.020 for     56 degrees of freedom
# Null hypothesis probability =   4.323939e-01

Photon flux (15-150 keV)    in 1 sec: 7.57268 ( -1.01543  0.97601 ) ph/cm2/s
Energy fluence (15-150 keV)             : 8.09901e-07 ( -9.9522e-08  1.04044e-07 ) ergs/cm2
Band function

Time interval is from    2.120 sec. to    3.120 sec.

Spectral model in the Band function:
------------------------------------------------------------
Parameters  : value       lower 90%   higher 90%
alpha       : -1.01458   ( 1.01458   1.01458 )
beta        : -0.652144    ( -0.229082   0.246151 )
Epeak [keV] : 16.6500      ( -16.65 -16.65 )
Norm@50keV   : 8.70077E-02    ( -0.0300766   0 )
------------------------------------------------------------
#Fit statistic : Chi-Squared =          57.12 using 59 PHA bins.
# Reduced chi-squared =          1.038 for     55 degrees of freedom
# Null hypothesis probability =   3.964275e-01

Photon flux (15-150 keV)    in 1 sec:  (    ) ph/cm2/s
Energy fluence (15-150 keV)             : 0 ( 0  0 ) ergs/cm2
Single BB
Spectral model blackbody:
------------------------------------------------------------
Parameters  : value    Lower 90%  Upper 90%
kT [keV]    : 31.7228  (-5.6879  8.37506)
R^2/D10^2   : 0.100015  (-0.0473504   0.0767582)
(R is the radius in km and D10 is the distance to the source in units of 10 kpc)
------------------------------------------------------------
#Fit statistic : Chi-Squared =          69.03 using 59 PHA bins.
# Reduced chi-squared =          1.211 for     57 degrees of freedom
# Null hypothesis probability =   1.318401e-01

Energy  Fluence     90% Error
[keV]   [erg/cm2]   [erg/cm2]
15- 25  1.520e-08   4.546e-09
25- 50  9.590e-08   2.327e-08
50-150  6.656e-07   1.421e-07
15-150  7.767e-07   1.789e-07
Thermal bremsstrahlung (OTTB)
Spectral model: thermal bremsstrahlung
------------------------------------------------------------
Parameters  : value         Lower 90%    Upper 90%
kT [keV]    : 200.000       (      )
Norm        : 30.2950       (-4.16046     4.16018)
------------------------------------------------------------
#Fit statistic : Chi-Squared =          99.79 using 59 PHA bins.
# Reduced chi-squared =          1.751 for     57 degrees of freedom
# Null hypothesis probability =   3.955075e-04

Energy  Fluence     90% Error
[keV]   [erg/cm2]   [erg/cm2]
15- 25  7.546e-08   4.199e-08
25- 50  1.451e-07   8.240e-08
50-150  3.183e-07   1.788e-07
15-150  5.390e-07   2.964e-07
Double BB
------------------------------------------------------------
Parameters  : value         Lower 90%    Upper 90%
kT1 [keV]   : 14.3004        (-6.87965      8.96744)
R1^2/D10^2  : 0.661922        (-0.543818      2.98644)
kT2 [keV]   : 197.917        (      )
R2^2/D10^2  : 1.84029E-03    (-0.000593401   0.0032285)
------------------------------------------------------------
#Fit statistic : Chi-Squared =          57.88 using 59 PHA bins.
#Fit statistic : Chi-Squared =          56.08 using 59 PHA bins.
# Reduced chi-squared =          1.052 for     55 degrees of freedom
# Reduced chi-squared =          1.020 for     55 degrees of freedom
# Null hypothesis probability =   3.693032e-01
# Null hypothesis probability =   4.340995e-01

Energy  Fluence     90% Error
[keV]   [erg/cm2]   [erg/cm2]
15- 25  3.484e-08   2.241e-08
25- 50  1.197e-07   6.660e-08
50-150  6.254e-07   3.546e-07
15-150  7.800e-07   4.243e-07
Pre-slew spectrum (Pre-slew PHA with pre-slew DRM)
Power-law model

Spectral model in power-law:
------------------------------------------------------------
Parameters  : value       lower 90%   higher 90%
Photon index: 1.01102     ( -0.0629294   0.0622624 )
Norm@50keV  : 4.11139E-02    ( -0.00148044   0.00147483 )
------------------------------------------------------------
#Fit statistic : Chi-Squared =          67.54 using 59 PHA bins.
# Reduced chi-squared =          1.185 for     57 degrees of freedom
# Null hypothesis probability =   1.600924e-01

Photon flux (15-150 keV)    in 31.21 sec: 4.73715 ( -0.177061  0.17577 ) ph/cm2/s
Energy fluence (15-150 keV)             : 1.38227e-05 ( -4.90056e-07  4.89941e-07 ) ergs/cm2
Cutoff power-law model

Spectral model in the cutoff power-law:
------------------------------------------------------------
Parameters  : value       lower 90%   higher 90%
Photon index: 0.935530     ( -0.249411   0.100726 )
Epeak [keV] : 877.049      ( -877.05 -877.05 )
Norm@50keV  : 4.41586E-02    ( -0.0016783   0.011376 )
------------------------------------------------------------
#Fit statistic : Chi-Squared =          67.26 using 59 PHA bins.
# Reduced chi-squared =          1.201 for     56 degrees of freedom
# Null hypothesis probability =   1.441371e-01

Photon flux (15-150 keV)    in 31.21 sec: 4.71866 ( -0.18397  0.18452 ) ph/cm2/s
Energy fluence (15-150 keV)             : 1.38035e-05 ( -4.9936e-07  4.93898e-07 ) ergs/cm2
Band function
Spectral model in the Band function:
------------------------------------------------------------
Parameters  : value       lower 90%   higher 90%
alpha       : -0.476153   ( 0.7966   0.7966 )
beta        : -1.05659    ( -0.0622535   0.0629395 )
Epeak [keV] : 113.399      ( -112.768 244.17 )
Norm@50keV   : 8.18665E-02    ( -0.0418463   0 )
------------------------------------------------------------
#Fit statistic : Chi-Squared =          66.39 using 59 PHA bins.
# Reduced chi-squared =          1.207 for     55 degrees of freedom
# Null hypothesis probability =   1.397977e-01

Photon flux (15-150 keV)    in 31.21 sec:  (    ) ph/cm2/s
Energy fluence (15-150 keV)             : 0 ( 0  0 ) ergs/cm2
S(25-50 keV) vs. S(50-100 keV) plot
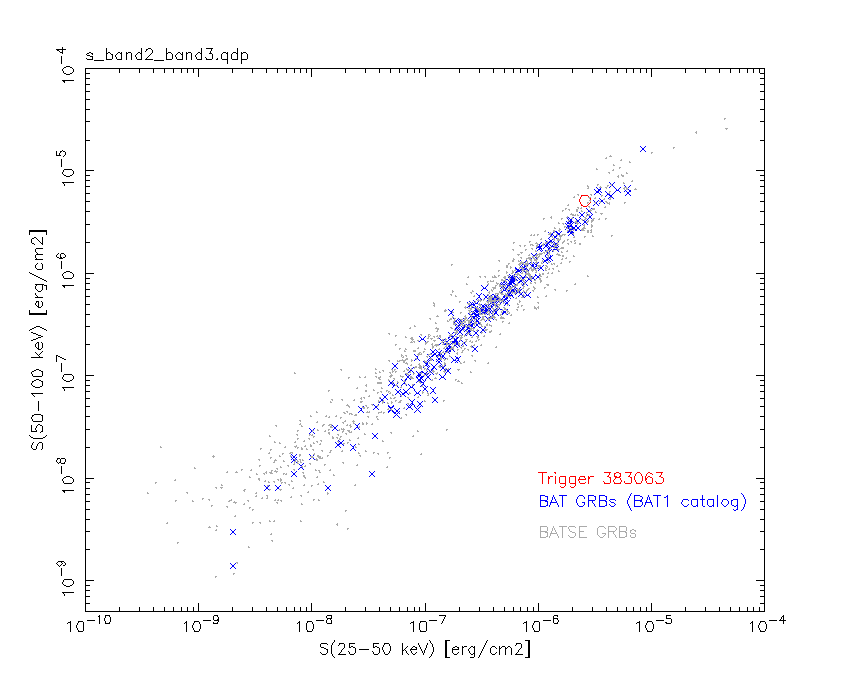
S(25-50 keV)  = 2.58e-06
S(50-100 keV) = 5.12e-06
T90 vs. Hardness ratio plot
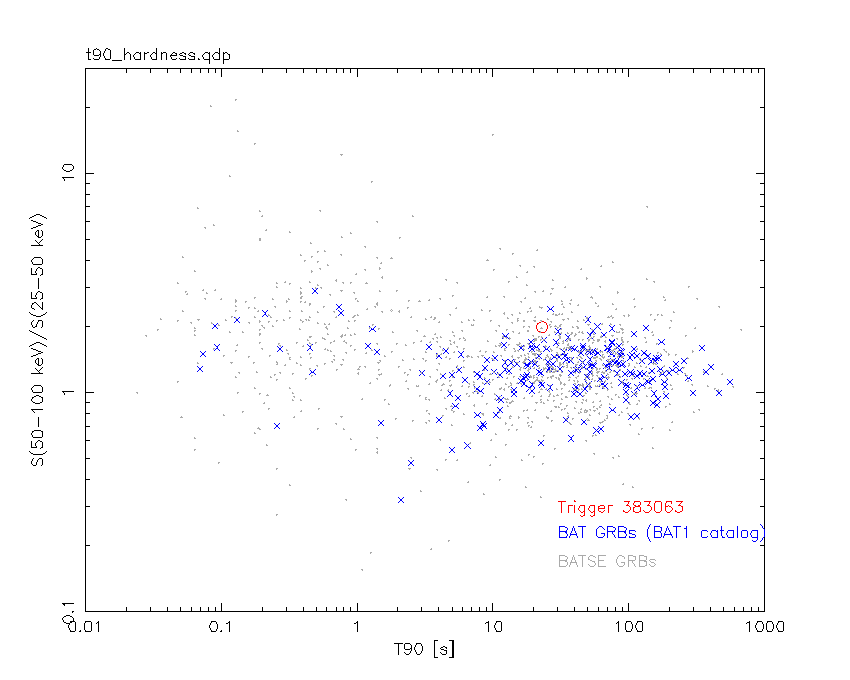
T90                                   = 23.0679998993874 sec.
Hardness ratio (energy fluence ratio) = 1.9845
Color vs. Color plot
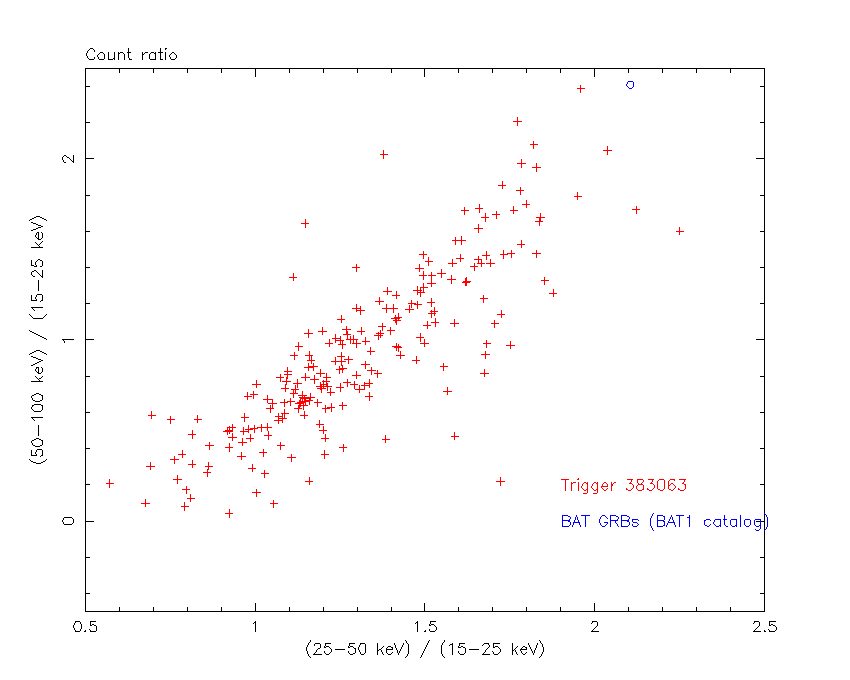
Count Ratio  (25-50 keV) / (15-25 keV) = 2.10409
Count Ratio (50-100 keV) / (15-25 keV) = 2.4101
Mask shadow pattern
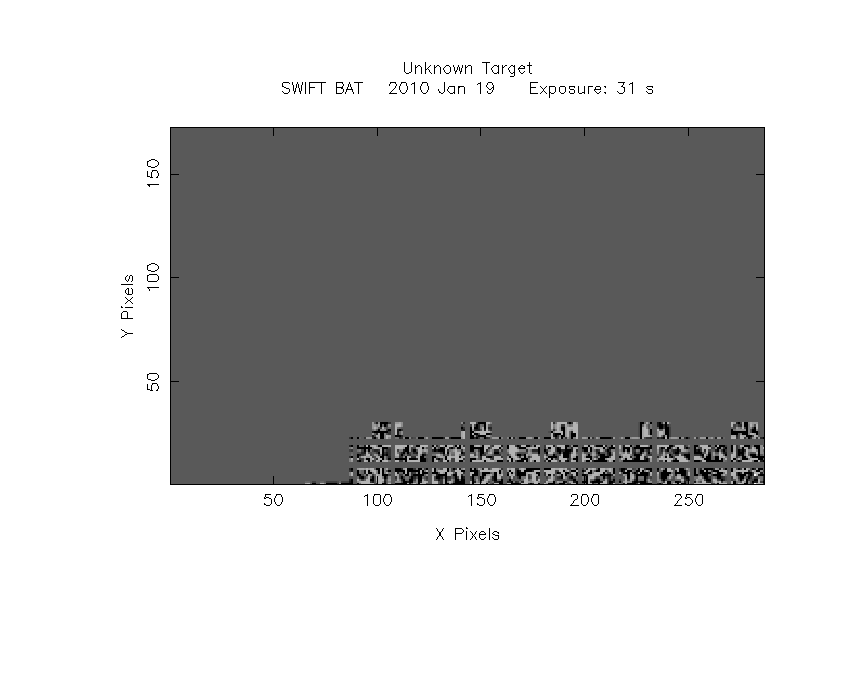
IMX = -8.024386640723181E-01, IMY = 8.120364178031654E-01
TIME vs. PHA plot around the trigger time
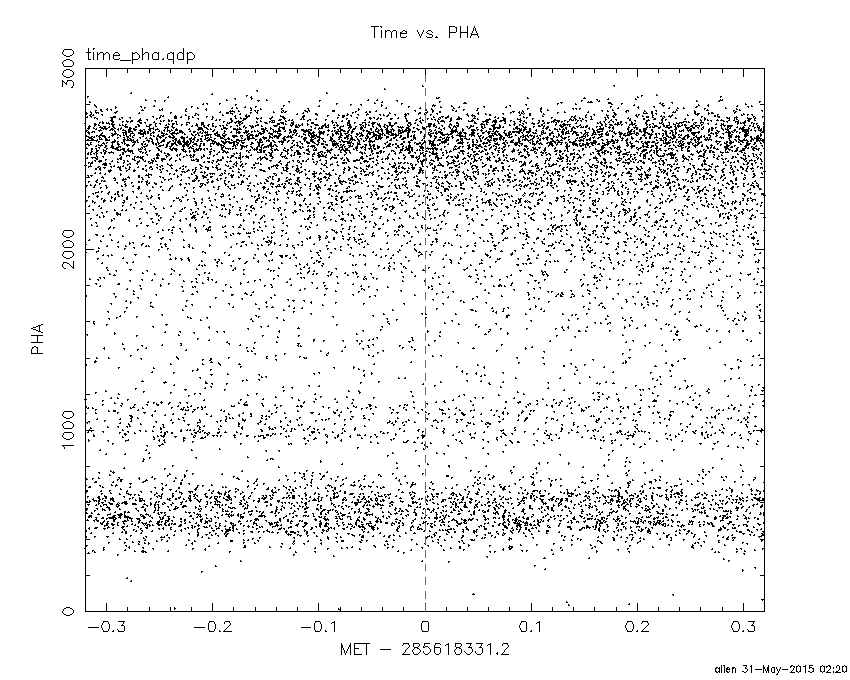
Blue+Cyan dotted lines: Time interval of the scaled map
From 0.000000 to 2.048000
TIME vs. DetID plot around the trigger time
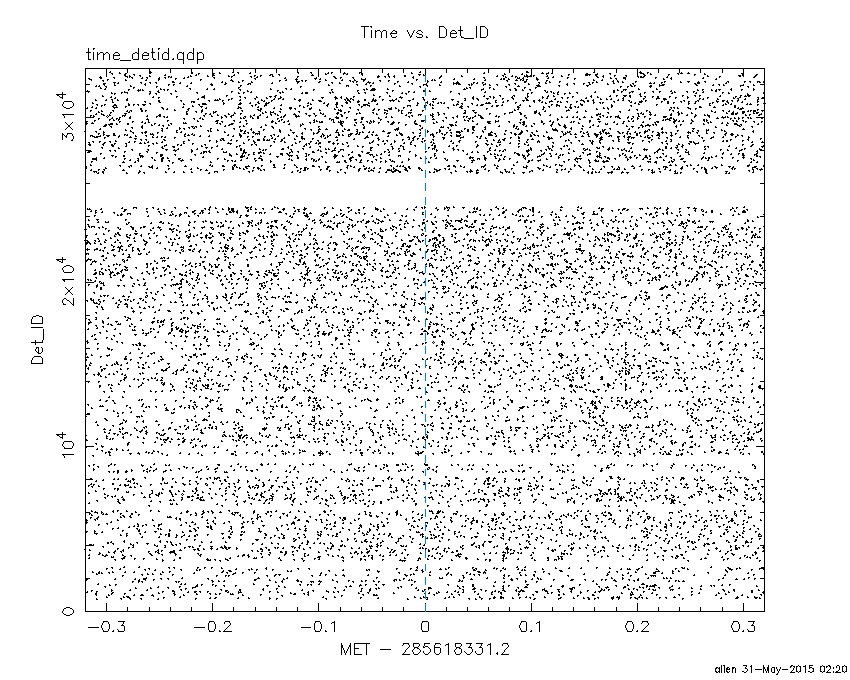
Blue+Cyan dotted lines: Time interval of the scaled map
From 0.000000 to 2.048000
100 us light curve (15-350 keV)
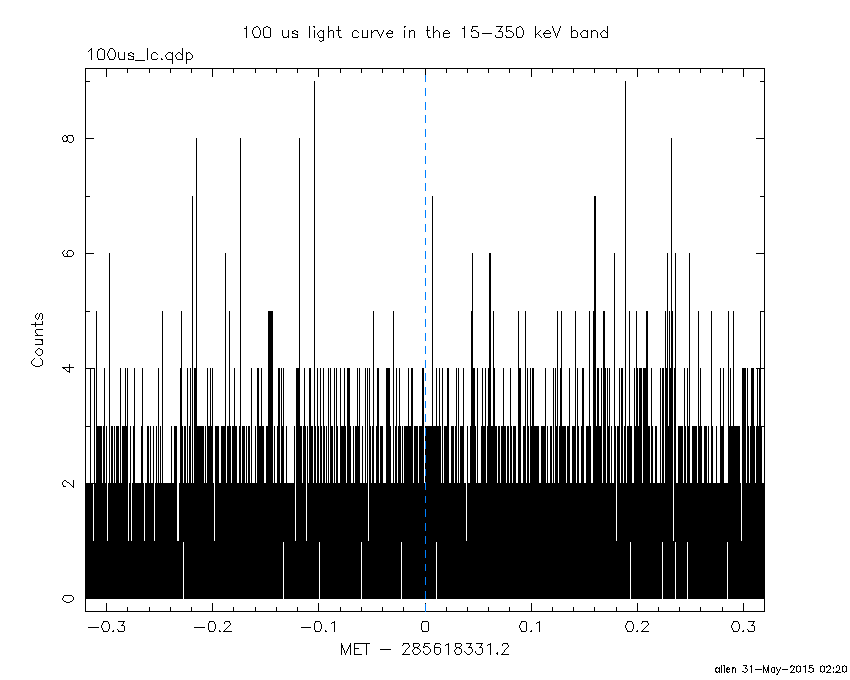
Blue+Cyan dotted lines: Time interval of the scaled map
From 0.000000 to 2.048000
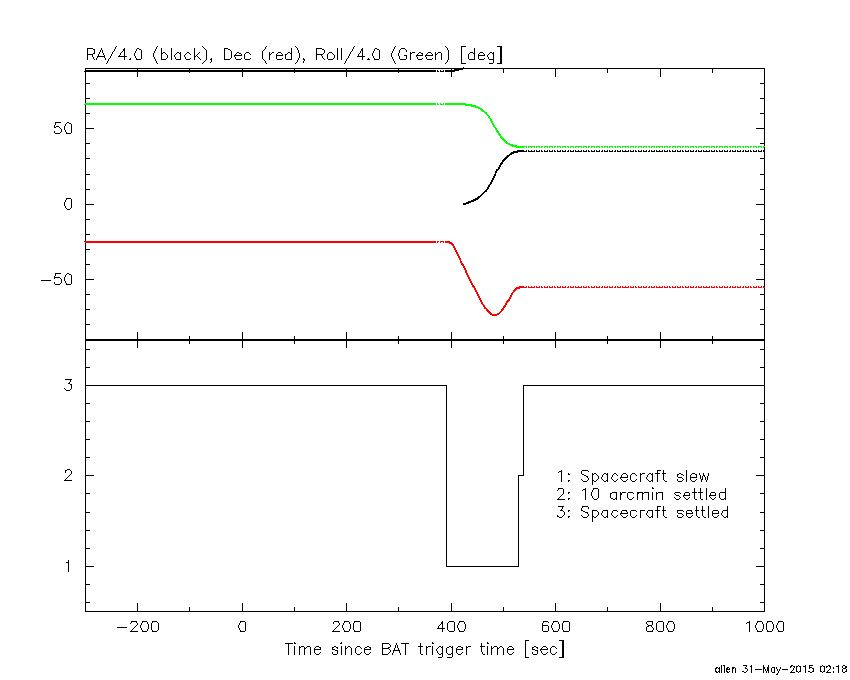
Spacecraft aspect plot
Bright source in the pre-burst/pre-slew/post-slew images
Pre-burst image of 15-350 keV band
Time interval of the image:
-179.200000 -15.760000

# RAcent  DECcent POSerr Theta    Phi  PeakCts   SNR AngSep     Name
#  [deg]    [deg]    ['] [deg]  [deg]                   [']
 10.5218  -5.0012    2.4  26.0   48.1   2.6267   4.9 ------	UNKNOWN
346.9851   9.3895    2.5  34.9   -5.3   2.3590   4.5 ------	UNKNOWN
338.6932  30.7232    3.2  57.4   -9.4   8.2809   3.7 ------	UNKNOWN
326.8030 -81.4081    3.1  57.4 -170.2   8.3334   3.7 ------	UNKNOWN
322.0800 -76.6061    2.2  53.8 -166.2   7.1839   5.2 ------	UNKNOWN
314.7630   5.5362    2.4  48.2  -50.7  10.2779   4.8 ------	UNKNOWN
Pre-slew background subtracted image of 15-350 keV band
Time interval of the image:
-15.760000 15.452000

# RAcent  DECcent POSerr Theta    Phi  PeakCts   SNR AngSep     Name
#  [deg]    [deg]    ['] [deg]  [deg]                   [']
347.9754  12.4502    2.9  37.8   -2.9   0.5041   3.9 ------	UNKNOWN
330.7157  -5.7354    2.8  28.8  -46.5   0.5983   4.2 ------	UNKNOWN
318.3168 -44.9780    3.2  34.4 -129.1   0.6477   3.6 ------	UNKNOWN
316.0584   0.3517    3.1  43.9  -55.1   2.1904   3.8 ------	UNKNOWN
299.3068 -53.1499    0.5  48.8 -134.7  19.4487  22.5 ------	UNKNOWN
Post-slew image of 15-350 keV band
Time interval of the image:
528.100630 962.893400

# RAcent  DECcent POSerr Theta    Phi  PeakCts   SNR AngSep     Name
#  [deg]    [deg]    ['] [deg]  [deg]                   [']
135.4534 -40.7431   15.9  14.7  103.6  -0.2154  -0.7   11.8	Vela X-1
170.3208 -60.5973    0.9  16.8 -121.3   4.0744  13.2    1.5	Cen X-3
186.6731 -62.7812    2.3  24.6 -115.5   2.1395   5.0    0.8	GX 301-2
159.2259 -14.9716    3.5  42.8  145.3   2.7014   3.3 ------	UNKNOWN
113.1221 -35.3810    2.7  27.1   63.2   1.8559   4.2 ------	UNKNOWN
160.3388 -21.9199    3.0  36.5  150.2   2.1243   3.8 ------	UNKNOWN
201.1806 -17.8182    3.5  59.1 -166.2   6.6626   3.3 ------	UNKNOWN
 29.8424 -52.0440    3.0  58.3  -19.7   6.8161   3.9 ------	UNKNOWN
235.2930 -70.2081    2.8  41.0  -93.4   7.0642   4.1 ------	UNKNOWN
Plot creation:
Sun May 31 02:20:12 EDT 2015