Special notes of this burst
Image
Pre-slew 15.0-350.0 keV image (Event data)

#   RAcent    DECcent   POSerr    Theta     Phi              Peak Cts       SNR   Name
  141.3850    31.7434   0.0166    18.2570   125.8385         0.6352899     11.495 TRIG_00411248

Foreground time interval of the image:
 -6.180  23.684 (delta_t =  29.864 [sec])
Background time interval of the image:
-239.576  -6.180 (delta_t = 233.396 [sec])
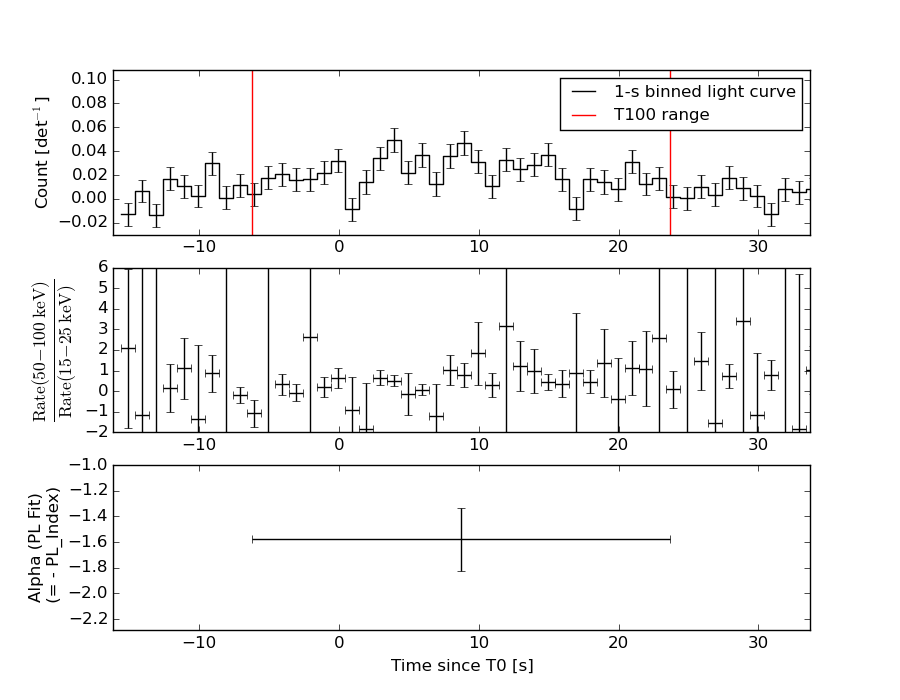
Lightcurves
Notes:
- 1) The mask-weighted light curves are using the flight position.
- 2) Multiple plots of different time binning/intervals are shown to cover all scenarios of short/long GRBs, rate/image triggers, and real/false positives.
- 3) For all the mask-weighted lightcurves, the y-axis units are counts/sec/det where a det is 0.4 x 0.4 = 0.16 sq cm.
- 4) The verticle lines correspond to following: green dotted lines are T50 interval, black dotted lines are T90 interval, blue solid line(s) is a spacecraft slew start time, and orange solid line(s) is a spacecraft slew end time.
- 5) Time of each bin is in the middle of the bin.
1 s binning
From T0-310 s to T0+310 s

From T100_start - 20 s to T100_end + 30 s

Full time interval

64 ms binning
Full time interval

From T100_start to T100_end

From T0-5 sec to T0+5 sec

16 ms binning
From T100_start-5 s to T100_start+5 s

8 ms binning
From T100_start-3 s to T100_start+3 s

2 ms binning
From T100_start-1 s to T100_start+1 s

SN=5 or 10 sec. binning (whichever binning is satisfied first)

SN=5 or 10 sec. binning (T < 200 sec)

Quad-rate summed light curves (from T0-300s to T0+1000s)

Spectral Evolution
Spectra
Notes:
- 1) The fitting includes the systematic errors.
- 2) When the burst includes telescope slew time periods, the fitting uses an average response file made from multiple 5-s response files through out the slew time plus single time preiod for the non-slew times, and weighted by the total counts in the corresponding time period using addrmf. An average response file is needed becuase a spectral fit using the pre-slew DRM will introduce some errors in both a spectral shape and a normalization if the PHA file contains a lot of the slew/post-slew time interval.
- 3) For fits to more complicated models (e.g. a power-law over a cutoff power-law), the BAT team has decided to require a chi-square improvement of more than 6 for each extra dof.
Time averaged spectrum fit using the average DRM
Power-law model

Time interval is from   -6.180 sec. to   23.684 sec.

Spectral model in power-law:
------------------------------------------------------------
Parameters  : value       lower 90%   higher 90%
Photon index: 1.57800     ( -0.242973   0.250436 )
Norm@50keV  : 1.30009E-03    ( -0.000196586   0.000192431 )
------------------------------------------------------------
#Fit statistic : Chi-Squared =          50.65 using 59 PHA bins.
# Reduced chi-squared =         0.8886 for     57 degrees of freedom
# Null hypothesis probability =   7.106665e-01

Photon flux (15-150 keV)    in 29.86 sec: 0.165949 ( -0.0224239  0.0224297 ) ph/cm2/s
Energy fluence (15-150 keV)             : 3.64065e-07 ( -5.94689e-08  6.09965e-08 ) ergs/cm2
Cutoff power-law model

Time interval is from   -6.180 sec. to   23.684 sec.
Spectral model in the cutoff power-law:
------------------------------------------------------------
Parameters  : value       lower 90%   higher 90%
Photon index: 1.37946     ( -1.1158   0.440091 )
Epeak [keV] : 142.423      ( -143.301 -143.301 )
Norm@50keV  : 1.66932E-03    ( -0.00166599   0.00501323 )
------------------------------------------------------------
#Fit statistic : Chi-Squared =          50.52 using 59 PHA bins.
# Reduced chi-squared =         0.9022 for     56 degrees of freedom
# Null hypothesis probability =   6.815298e-01

Photon flux (15-150 keV)    in 29.86 sec: 0.164521 ( -0.023465  0.02328 ) ph/cm2/s
Energy fluence (15-150 keV)             : 3.5623e-07 ( -7.00772e-08  6.73791e-08 ) ergs/cm2
Band function

Time interval is from   -6.180 sec. to   23.684 sec.

Spectral model in the Band function:
------------------------------------------------------------
Parameters  : value       lower 90%   higher 90%
alpha       : 4.97368   ( -4.97368   -4.97368 )
beta        : -1.62317    ( -0.283283   0.260216 )
Epeak [keV] : 20.9670      ( -20.967 6.74652 )
Norm@50keV   : 426.482    ( -57.4214   867804 )
------------------------------------------------------------
#Fit statistic : Chi-Squared =          50.25 using 59 PHA bins.
# Reduced chi-squared =         0.9137 for     55 degrees of freedom
# Null hypothesis probability =   6.562983e-01

Photon flux (15-150 keV)    in 29.86 sec:  (    ) ph/cm2/s
Energy fluence (15-150 keV)             : 3.5568e-07 ( 0  0 ) ergs/cm2
Single BB

Spectral model blackbody:
------------------------------------------------------------
Parameters  : value    Lower 90%  Upper 90%
kT [keV]    : 12.8726  (-2.09239  2.58949)
R^2/D10^2   : 3.15644E-02  (-0.0150811   0.0278858)
(R is the radius in km and D10 is the distance to the source in units of 10 kpc)
------------------------------------------------------------
#Fit statistic : Chi-Squared =          62.36 using 59 PHA bins.
# Reduced chi-squared =          1.094 for     57 degrees of freedom
# Null hypothesis probability =   2.915259e-01

Energy  Fluence     90% Error
[keV]   [erg/cm2]   [erg/cm2]
15- 25  3.313e-08   9.057e-09
25- 50  1.129e-07   2.474e-08
50-150  1.176e-07   3.867e-08
15-150  2.636e-07   5.324e-08
Thermal bremsstrahlung (OTTB)

Spectral model: thermal bremsstrahlung
------------------------------------------------------------
Parameters  : value         Lower 90%    Upper 90%
kT [keV]    : 177.141       (      )
Norm        : 0.678370       (-0.0940562     0.113707)
------------------------------------------------------------
#Fit statistic : Chi-Squared =          50.55 using 59 PHA bins.
# Reduced chi-squared =         0.8869 for     57 degrees of freedom
# Null hypothesis probability =   7.140369e-01

Energy  Fluence     90% Error
[keV]   [erg/cm2]   [erg/cm2]
15- 25  5.070e-08   2.861e-08
25- 50  9.675e-08   5.220e-08
50-150  2.074e-07   1.165e-07
15-150  3.549e-07   1.917e-07
Double BB

Spectral model: bbodyrad<1> + bbodyrad<2>
------------------------------------------------------------
Parameters  : value         Lower 90%    Upper 90%
kT1 [keV]   : 5.44004        (-2.58496      -5.45039)
R1^2/D10^2  : 0.407286        (-0.35122      1.16476)
kT2 [keV]   : 20.4246        (-6.27614      -20.4855)
R2^2/D10^2  : 5.02423E-03    (-0.00494672   0.00669317)
------------------------------------------------------------
#Fit statistic : Chi-Squared =          51.62 using 59 PHA bins.
# Reduced chi-squared =         0.9386 for     55 degrees of freedom
# Null hypothesis probability =   6.043967e-01

Energy  Fluence     90% Error
[keV]   [erg/cm2]   [erg/cm2]
15- 25  5.293e-08   2.904e-08
25- 50  9.317e-08   4.948e-08
50-150  1.893e-07   1.078e-07
15-150  3.354e-07   1.788e-07
Peak spectrum fit
Power-law model

Time interval is from    8.116 sec. to    9.116 sec.

Spectral model in power-law:
------------------------------------------------------------
Parameters  : value       lower 90%   higher 90%
Photon index: 1.31696     ( -0.633413   0.60323 )
Norm@50keV  : 3.06110E-03    ( -0.00102008   0.00100506 )
------------------------------------------------------------
#Fit statistic : Chi-Squared =          59.00 using 59 PHA bins.
# Reduced chi-squared =          1.035 for     57 degrees of freedom
# Null hypothesis probability =   4.023156e-01

Photon flux (15-150 keV)    in 1 sec: 0.366362 ( -0.120768  0.121101 ) ph/cm2/s
Energy fluence (15-150 keV)             : 3.01257e-08 ( -1.10915e-08  1.15264e-08 ) ergs/cm2
Cutoff power-law model

Time interval is from    8.116 sec. to    9.116 sec.
Spectral model in the cutoff power-law:
------------------------------------------------------------
Parameters  : value       lower 90%   higher 90%
Photon index: 1.32558     ( -2.05398   0.598241 )
Epeak [keV] : 9999.36      ( -9999.36 -9999.36 )
Norm@50keV  : 3.06005E-03    ( -0.00307148   0.0530297 )
------------------------------------------------------------
#Fit statistic : Chi-Squared =          59.00 using 59 PHA bins.
# Reduced chi-squared =          1.054 for     56 degrees of freedom
# Null hypothesis probability =   3.663716e-01

Photon flux (15-150 keV)    in 1 sec: 0.366527 ( -0.121111  0.120738 ) ph/cm2/s
Energy fluence (15-150 keV)             : 2.99378e-08 ( -1.18898e-08  1.15766e-08 ) ergs/cm2
Band function

Time interval is from    8.116 sec. to    9.116 sec.

Spectral model in the Band function:
------------------------------------------------------------
Parameters  : value       lower 90%   higher 90%
alpha       : 4.97254   ( -4.97254   -4.97254 )
beta        : -1.54392    ( -1.13703   0.770554 )
Epeak [keV] : 29.5691      ( -29.5691 54.3466 )
Norm@50keV   : 103.678    ( -33.4559   2.1391e+06 )
------------------------------------------------------------
#Fit statistic : Chi-Squared =          58.64 using 59 PHA bins.
# Reduced chi-squared =          1.066 for     55 degrees of freedom
# Null hypothesis probability =   3.435790e-01

Photon flux (15-150 keV)    in 1 sec:  (    ) ph/cm2/s
Energy fluence (15-150 keV)             : 0 ( 0  0 ) ergs/cm2
Single BB

Spectral model blackbody:
------------------------------------------------------------
Parameters  : value    Lower 90%  Upper 90%
kT [keV]    : 15.0185  (-6.2879  14.3288)
R^2/D10^2   : 4.11218E-02  (-0.0404406   0.229487)
(R is the radius in km and D10 is the distance to the source in units of 10 kpc)
------------------------------------------------------------
#Fit statistic : Chi-Squared =          62.38 using 59 PHA bins.
# Reduced chi-squared =          1.094 for     57 degrees of freedom
# Null hypothesis probability =   2.909068e-01

Energy  Fluence     90% Error
[keV]   [erg/cm2]   [erg/cm2]
15- 25  1.941e-09   1.262e-09
25- 50  7.723e-09   4.895e-09
50-150  1.186e-08   7.855e-09
15-150  2.153e-08   1.367e-08
Thermal bremsstrahlung (OTTB)

Spectral model: thermal bremsstrahlung
------------------------------------------------------------
Parameters  : value         Lower 90%    Upper 90%
kT [keV]    : 199.363       (-199.363      -199.363)
Norm        : 1.50315       (-0.493521     0.493521)
------------------------------------------------------------
#Fit statistic : Chi-Squared =          59.52 using 59 PHA bins.
# Reduced chi-squared =          1.044 for     57 degrees of freedom
# Null hypothesis probability =   3.839980e-01

Energy  Fluence     90% Error
[keV]   [erg/cm2]   [erg/cm2]
15- 25  3.743e-09   2.390e-09
25- 50  7.200e-09   4.606e-09
50-150  1.579e-08   9.885e-09
15-150  2.673e-08   1.670e-08
Double BB

Spectral model: bbodyrad<1> + bbodyrad<2>
------------------------------------------------------------
Parameters  : value         Lower 90%    Upper 90%
kT1 [keV]   : 8.23227        (-4.56036      7.38787)
R1^2/D10^2  : 0.260635        (-0.229867      3.81658)
kT2 [keV]   : 60.8049        (-62.2046      -62.2047)
R2^2/D10^2  : 5.14495E-04    (-0.000472216   0.0267064)
------------------------------------------------------------
#Fit statistic : Chi-Squared =          58.20 using 59 PHA bins.
# Reduced chi-squared =          1.058 for     55 degrees of freedom
# Null hypothesis probability =   3.582839e-01

Energy  Fluence     90% Error
[keV]   [erg/cm2]   [erg/cm2]
15- 25  3.438e-09   2.101e-09
25- 50  7.329e-09   4.564e-09
50-150  2.112e-08   1.243e-08
15-150  3.188e-08   1.632e-08
Pre-slew spectrum (Pre-slew PHA with pre-slew DRM)
Power-law model
Spectral model in power-law:
------------------------------------------------------------
Parameters  : value       lower 90%   higher 90%
Photon index: 1.57800     ( -0.242973   0.250436 )
Norm@50keV  : 1.30009E-03    ( -0.000196586   0.000192431 )
------------------------------------------------------------
#Fit statistic : Chi-Squared =          50.65 using 59 PHA bins.
# Reduced chi-squared =         0.8886 for     57 degrees of freedom
# Null hypothesis probability =   7.106665e-01

Photon flux (15-150 keV)    in 29.86 sec: 0.165949 ( -0.0224239  0.0224297 ) ph/cm2/s
Energy fluence (15-150 keV)             : 3.64065e-07 ( -5.94689e-08  6.09965e-08 ) ergs/cm2
Cutoff power-law model
Spectral model in the cutoff power-law:
------------------------------------------------------------
Parameters  : value       lower 90%   higher 90%
Photon index: 1.37946     ( -1.1158   0.440091 )
Epeak [keV] : 142.423      ( -143.301 -143.301 )
Norm@50keV  : 1.66932E-03    ( -0.00166599   0.00501323 )
------------------------------------------------------------
#Fit statistic : Chi-Squared =          50.52 using 59 PHA bins.
# Reduced chi-squared =         0.9022 for     56 degrees of freedom
# Null hypothesis probability =   6.815298e-01

Photon flux (15-150 keV)    in 29.86 sec: 0.164521 ( -0.023465  0.02328 ) ph/cm2/s
Energy fluence (15-150 keV)             : 3.5623e-07 ( -7.00772e-08  6.73791e-08 ) ergs/cm2
Band function
Spectral model in the Band function:
------------------------------------------------------------
Parameters  : value       lower 90%   higher 90%
alpha       : 4.97368   ( -4.97368   -4.97368 )
beta        : -1.62317    ( -0.283283   0.260216 )
Epeak [keV] : 20.9670      ( -20.967 6.74652 )
Norm@50keV   : 426.482    ( -57.4214   867804 )
------------------------------------------------------------
#Fit statistic : Chi-Squared =          50.25 using 59 PHA bins.
# Reduced chi-squared =         0.9137 for     55 degrees of freedom
# Null hypothesis probability =   6.562983e-01

Photon flux (15-150 keV)    in 29.86 sec:  (    ) ph/cm2/s
Energy fluence (15-150 keV)             : 3.5568e-07 ( 0  0 ) ergs/cm2
S(25-50 keV) vs. S(50-100 keV) plot

S(25-50 keV)  = 9.34e-08
S(50-100 keV) = 1.25e-07
T90 vs. Hardness ratio plot

T90                                   = 25.8439999222755 sec.
Hardness ratio (energy fluence ratio) = 1.33833
Color vs. Color plot

Count Ratio  (25-50 keV) / (15-25 keV) = 1.13521
Count Ratio (50-100 keV) / (15-25 keV) = 0.781128
Mask shadow pattern

IMX = -1.931497594487454E-01, IMY = -2.674294408718210E-01
TIME vs. PHA plot around the trigger time
TIME vs. DetID plot around the trigger time

100 us light curve (15-350 keV)

Spacecraft aspect plot
Bright source in the pre-burst/pre-slew/post-slew images
Pre-burst image of 15-350 keV band
Time interval of the image:
-239.576000 -6.180000

# RAcent  DECcent POSerr Theta    Phi  PeakCts   SNR AngSep     Name
#  [deg]    [deg]    ['] [deg]  [deg]                   [']
135.4647 -40.5509    9.2  58.7  -10.4   1.2541   1.3    2.9	Vela X-1
Pre-slew background subtracted image of 15-350 keV band
Time interval of the image:
-6.180000 23.684000

# RAcent  DECcent POSerr Theta    Phi  PeakCts   SNR AngSep     Name
#  [deg]    [deg]    ['] [deg]  [deg]                   [']
135.6346 -40.5840    7.4  58.6  -10.6   0.5045   1.6    5.1	Vela X-1
141.3850  31.7434    1.0  18.3  125.8   0.6353  11.5 ------	UNKNOWN
Post-slew image of 15-350 keV band
Time interval of the image:
154.124600 962.452300

# RAcent  DECcent POSerr Theta    Phi  PeakCts   SNR AngSep     Name
#  [deg]    [deg]    ['] [deg]  [deg]                   [']
 83.6281  22.0124    0.4  51.9  175.0  30.8528  27.0    0.3	Crab
 87.3452  26.7752    2.7  47.0  179.2   3.3576   4.3 ------	UNKNOWN
200.7851  52.1856    3.5  47.0  -53.2   7.2305   3.3 ------	UNKNOWN
Plot creation:
Sun May 31 02:18:05 EDT 2015