Click here for the BAT GCN circular template
Image
Pre-slew 15.0-350.0 keV image (Event data)

#   RAcent    DECcent   POSerr    Theta     Phi              Peak Cts       SNR   Name
  356.4684    49.4880   0.0146    15.5643  -102.3370         1.2339771     13.134 TRIG_00412081

Foreground time interval of the image:
-44.116  10.149 (delta_t =  54.265 [sec])
Background time interval of the image:
-314.851 -44.116 (delta_t = 270.735 [sec])
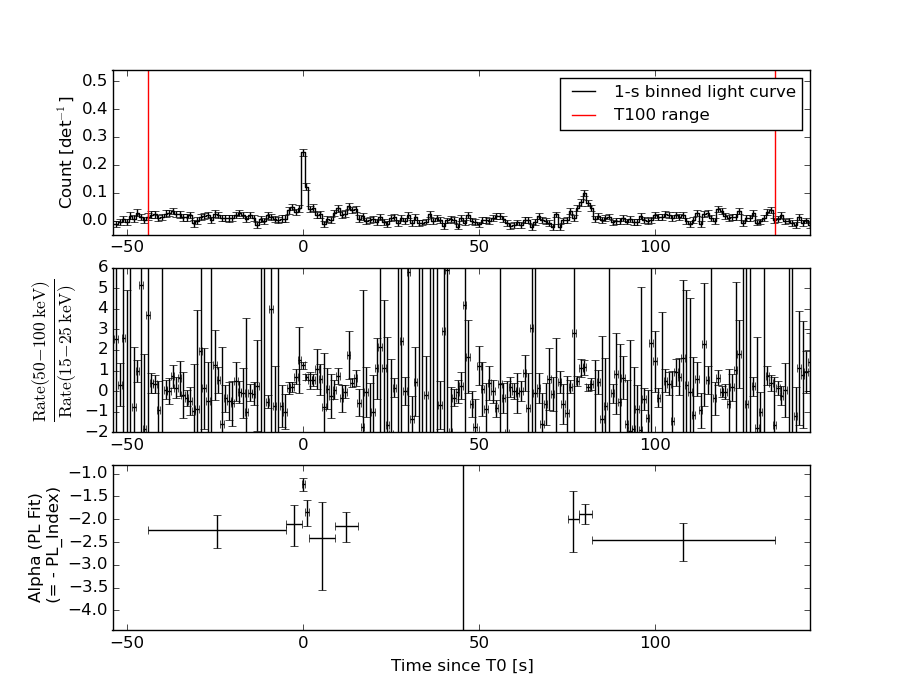
Lightcurves
Notes:
- 1) The mask-weighted light curves are using the flight position.
- 2) Multiple plots of different time binning/intervals are shown to cover all scenarios of short/long GRBs, rate/image triggers, and real/false positives.
- 3) For all the mask-weighted lightcurves, the y-axis units are counts/sec/det where a det is 0.4 x 0.4 = 0.16 sq cm.
- 4) The verticle lines correspond to following: green dotted lines are T50 interval, black dotted lines are T90 interval, blue solid line(s) is a spacecraft slew start time, and orange solid line(s) is a spacecraft slew end time.
- 5) Time of each bin is in the middle of the bin.
1 s binning
From T0-310 s to T0+310 s

From T100_start - 20 s to T100_end + 30 s

Full time interval

64 ms binning
Full time interval
From T100_start to T100_end
From T0-5 sec to T0+5 sec
16 ms binning
From T100_start-5 s to T100_start+5 s
8 ms binning
From T100_start-3 s to T100_start+3 s

2 ms binning
From T100_start-1 s to T100_start+1 s
SN=5 or 10 sec. binning (whichever binning is satisfied first)
SN=5 or 10 sec. binning (T < 200 sec)
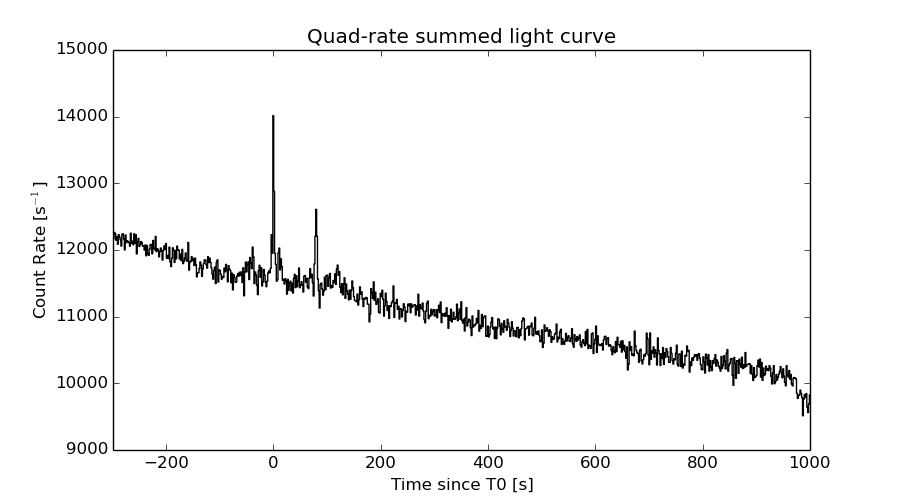
Quad-rate summed light curves (from T0-300s to T0+1000s)
Spectral Evolution
Spectra
Notes:
- 1) The fitting includes the systematic errors.
- 2) When the burst includes telescope slew time periods, the fitting uses an average response file made from multiple 5-s response files through out the slew time plus single time preiod for the non-slew times, and weighted by the total counts in the corresponding time period using addrmf. An average response file is needed becuase a spectral fit using the pre-slew DRM will introduce some errors in both a spectral shape and a normalization if the PHA file contains a lot of the slew/post-slew time interval.
- 3) For fits to more complicated models (e.g. a power-law over a cutoff power-law), the BAT team has decided to require a chi-square improvement of more than 6 for each extra dof.
Time averaged spectrum fit using the average DRM
Power-law model

Time interval is from  -44.116 sec. to  134.052 sec.

Spectral model in power-law:
------------------------------------------------------------
Parameters  : value       lower 90%   higher 90%
Photon index: 2.24049     ( -0.186806   0.198631 )
Norm@50keV  : 6.78370E-04    ( -9.42176e-05   9.32692e-05 )
------------------------------------------------------------
#Fit statistic : Chi-Squared =          58.28 using 59 PHA bins.
# Reduced chi-squared =          1.022 for     57 degrees of freedom
# Null hypothesis probability =   4.279677e-01

Photon flux (15-150 keV)    in 178.2 sec: 0.114752 ( -0.0101716  0.0101722 ) ph/cm2/s
Energy fluence (15-150 keV)             : 1.14348e-06 ( -1.30777e-07  1.35716e-07 ) ergs/cm2
Cutoff power-law model

Time interval is from  -44.116 sec. to  134.052 sec.
Spectral model in the cutoff power-law:
------------------------------------------------------------
Parameters  : value       lower 90%   higher 90%
Photon index: 1.34888     ( -1.08179   0.603037 )
Epeak [keV] : 26.2853      ( -21.6675 9.12685 )
Norm@50keV  : 2.46039E-03    ( -0.0015523   0.00973247 )
------------------------------------------------------------
#Fit statistic : Chi-Squared =          55.12 using 59 PHA bins.
# Reduced chi-squared =         0.9842 for     56 degrees of freedom
# Null hypothesis probability =   5.082428e-01

Photon flux (15-150 keV)    in 178.2 sec: 0.110487 ( -0.0106608  0.010804 ) ph/cm2/s
Energy fluence (15-150 keV)             : 1.02052e-06 ( -1.44053e-07  1.71054e-07 ) ergs/cm2
Band function
Time interval is from  -44.116 sec. to  134.052 sec.

Spectral model in the Band function:
------------------------------------------------------------
Parameters  : value       lower 90%   higher 90%
alpha       : -2.53425E-03   ( -1.98839   0.736988 )
beta        : -2.62874    ( 2.60056   0.387535 )
Epeak [keV] : 26.3382      ( -7.31698 8.69192 )
Norm@50keV   : 2.37295E-02    ( -0.0228523   95.0185 )
------------------------------------------------------------
#Fit statistic : Chi-Squared =          54.57 using 59 PHA bins.
# Reduced chi-squared =         0.9922 for     55 degrees of freedom
# Null hypothesis probability =   4.908757e-01

Photon flux (15-150 keV)    in 178.2 sec:  (    ) ph/cm2/s
Energy fluence (15-150 keV)             : 0 ( 0  0 ) ergs/cm2
Single BB

Spectral model blackbody:
------------------------------------------------------------
Parameters  : value    Lower 90%  Upper 90%
kT [keV]    : 7.90229  (-0.777795  0.877292)
R^2/D10^2   : 0.129805  (-0.0447564   0.0677645)
(R is the radius in km and D10 is the distance to the source in units of 10 kpc)
------------------------------------------------------------
#Fit statistic : Chi-Squared =          69.18 using 59 PHA bins.
# Reduced chi-squared =          1.214 for     57 degrees of freedom
# Null hypothesis probability =   1.293152e-01

Energy  Fluence     90% Error
[keV]   [erg/cm2]   [erg/cm2]
15- 25  2.588e-07   3.715e-08
25- 50  4.433e-07   5.480e-08
50-150  1.118e-07   3.423e-08
15-150  8.139e-07   9.427e-08
Thermal bremsstrahlung (OTTB)

Spectral model: thermal bremsstrahlung
------------------------------------------------------------
Parameters  : value         Lower 90%    Upper 90%
kT [keV]    : 41.7387       (-9.18517      13.5737)
Norm        : 0.717224       (-0.118448     0.148671)
------------------------------------------------------------
#Fit statistic : Chi-Squared =          55.10 using 59 PHA bins.
# Reduced chi-squared =         0.9668 for     57 degrees of freedom
# Null hypothesis probability =   5.465011e-01

Energy  Fluence     90% Error
[keV]   [erg/cm2]   [erg/cm2]
15- 25  2.976e-07   3.315e-08
25- 50  3.987e-07   4.402e-08
50-150  3.229e-07   1.092e-07
15-150  1.019e-06   1.374e-07
Double BB

Spectral model: bbodyrad<1> + bbodyrad<2>
------------------------------------------------------------
Parameters  : value         Lower 90%    Upper 90%
kT1 [keV]   : 5.43379        (-1.46044      1.33306)
R1^2/D10^2  : 0.420882        (-0.221927      0.865914)
kT2 [keV]   : 15.6553        (-4.67669      10.6077)
R2^2/D10^2  : 5.09389E-03    (-0.0044776   0.00979483)
------------------------------------------------------------
#Fit statistic : Chi-Squared =          54.31 using 59 PHA bins.
# Reduced chi-squared =         0.9875 for     55 degrees of freedom
# Null hypothesis probability =   5.009338e-01

Energy  Fluence     90% Error
[keV]   [erg/cm2]   [erg/cm2]
15- 25  2.978e-07   1.335e-07
25- 50  3.914e-07   1.583e-07
50-150  3.361e-07   1.922e-07
15-150  1.025e-06   4.663e-07
Peak spectrum fit
Power-law model

Time interval is from   -0.340 sec. to    0.660 sec.

Spectral model in power-law:
------------------------------------------------------------
Parameters  : value       lower 90%   higher 90%
Photon index: 1.28417     ( -0.139866   0.140579 )
Norm@50keV  : 1.80901E-02    ( -0.00140991   0.00140607 )
------------------------------------------------------------
#Fit statistic : Chi-Squared =          77.38 using 59 PHA bins.
# Reduced chi-squared =          1.358 for     57 degrees of freedom
# Null hypothesis probability =   3.752043e-02

Photon flux (15-150 keV)    in 1 sec: 2.15203 ( -0.166241  0.166366 ) ph/cm2/s
Energy fluence (15-150 keV)             : 1.79464e-07 ( -1.62246e-08  1.63958e-08 ) ergs/cm2
Cutoff power-law model

Time interval is from   -0.340 sec. to    0.660 sec.
Spectral model in the cutoff power-law:
------------------------------------------------------------
Parameters  : value       lower 90%   higher 90%
Photon index: 1.11412     ( -0.548157   0.292864 )
Epeak [keV] : 273.078      ( -273.358 -273.358 )
Norm@50keV  : 2.18761E-02    ( -0.00502686   0.0176836 )
------------------------------------------------------------
#Fit statistic : Chi-Squared =          77.04 using 59 PHA bins.
# Reduced chi-squared =          1.376 for     56 degrees of freedom
# Null hypothesis probability =   3.258106e-02

Photon flux (15-150 keV)    in 1 sec: 2.13368 ( -0.17451  0.17352 ) ph/cm2/s
Energy fluence (15-150 keV)             : 1.77203e-07 ( -1.7786e-08  1.7593e-08 ) ergs/cm2
Band function
Time interval is from   -0.340 sec. to    0.660 sec.

Spectral model in the Band function:
------------------------------------------------------------
Parameters  : value       lower 90%   higher 90%
alpha       : -1.11470   ( -0.214902   0.468628 )
beta        : -10.00000    ( 10   6.03961e-14 )
Epeak [keV] : 266.593      ( -164.289 -266.593 )
Norm@50keV   : 2.19614E-02    ( -0.00168003   0.0176108 )
------------------------------------------------------------
#Fit statistic : Chi-Squared =          77.05 using 59 PHA bins.
# Reduced chi-squared =          1.401 for     55 degrees of freedom
# Null hypothesis probability =   2.652267e-02

Photon flux (15-150 keV)    in 1 sec: 2.12856 (    ) ph/cm2/s
Energy fluence (15-150 keV)             : 0 ( 0  0 ) ergs/cm2
Single BB

Spectral model blackbody:
------------------------------------------------------------
Parameters  : value    Lower 90%  Upper 90%
kT [keV]    : 17.4279  (-1.85614  2.12391)
R^2/D10^2   : 0.150794  (-0.047225   0.0679075)
(R is the radius in km and D10 is the distance to the source in units of 10 kpc)
------------------------------------------------------------
#Fit statistic : Chi-Squared =         113.53 using 59 PHA bins.
# Reduced chi-squared =         1.9917 for     57 degrees of freedom
# Null hypothesis probability =   1.264048e-05

Energy  Fluence     90% Error
[keV]   [erg/cm2]   [erg/cm2]
15- 25  9.262e-09   1.372e-09
25- 50  4.179e-08   4.460e-09
50-150  9.132e-08   1.401e-08
15-150  1.424e-07   1.475e-08
Thermal bremsstrahlung (OTTB)

Spectral model: thermal bremsstrahlung
------------------------------------------------------------
Parameters  : value         Lower 90%    Upper 90%
kT [keV]    : 200.000       (      )
Norm        : 8.70817       (-0.680724     0.680728)
------------------------------------------------------------
#Fit statistic : Chi-Squared =          86.97 using 59 PHA bins.
# Reduced chi-squared =          1.526 for     57 degrees of freedom
# Null hypothesis probability =   6.457105e-03

Energy  Fluence     90% Error
[keV]   [erg/cm2]   [erg/cm2]
15- 25  2.183e-08   2.155e-09
25- 50  4.199e-08   8.195e-09
50-150  9.209e-08   4.055e-08
15-150  1.559e-07   4.625e-08
Double BB

Spectral model: bbodyrad<1> + bbodyrad<2>
------------------------------------------------------------
Parameters  : value         Lower 90%    Upper 90%
kT1 [keV]   : 6.60830        (-2.09573      2.37394)
R1^2/D10^2  : 2.23192        (-1.40068      7.10942)
kT2 [keV]   : 27.6577        (-5.57722      10.2228)
R2^2/D10^2  : 2.82752E-02    (-0.0182442   0.0335781)
------------------------------------------------------------
#Fit statistic : Chi-Squared =          77.38 using 59 PHA bins.
# Reduced chi-squared =          1.407 for     55 degrees of freedom
# Null hypothesis probability =   2.501397e-02

Energy  Fluence     90% Error
[keV]   [erg/cm2]   [erg/cm2]
15- 25  1.824e-08   7.707e-09
25- 50  3.910e-08   1.161e-08
50-150  1.199e-07   3.889e-08
15-150  1.772e-07   5.624e-08
Pre-slew spectrum (Pre-slew PHA with pre-slew DRM)
Power-law model

Spectral model in power-law:
------------------------------------------------------------
Parameters  : value       lower 90%   higher 90%
Photon index: 2.03626     ( -0.193809   0.20427 )
Norm@50keV  : 1.28676E-03    ( -0.000179352   0.00017631 )
------------------------------------------------------------
#Fit statistic : Chi-Squared =          69.24 using 59 PHA bins.
# Reduced chi-squared =          1.215 for     57 degrees of freedom
# Null hypothesis probability =   1.282170e-01

Photon flux (15-150 keV)    in 54.26 sec: 0.196303 ( -0.0190296  0.019032 ) ph/cm2/s
Energy fluence (15-150 keV)             : 6.45287e-07 ( -8.15446e-08  8.46364e-08 ) ergs/cm2
Cutoff power-law model

Spectral model in the cutoff power-law:
------------------------------------------------------------
Parameters  : value       lower 90%   higher 90%
Photon index: 1.66708     ( -1.09833   0.454552 )
Epeak [keV] : 33.2330      (   )
Norm@50keV  : 2.18884E-03    (     )
------------------------------------------------------------
#Fit statistic : Chi-Squared =          68.64 using 59 PHA bins.
# Reduced chi-squared =          1.226 for     56 degrees of freedom
# Null hypothesis probability =   1.195829e-01

Photon flux (15-150 keV)    in 54.26 sec: 0.192797 ( -0.020441  0.020012 ) ph/cm2/s
Energy fluence (15-150 keV)             : 6.06741e-07 ( -1.10734e-07  1.13213e-07 ) ergs/cm2
Band function

Spectral model in the Band function:
------------------------------------------------------------
Parameters  : value       lower 90%   higher 90%
alpha       : 0.792910   ( -1.54324   0.331876 )
beta        : -2.33456    ( 2.35289   0.388221 )
Epeak [keV] : 26.8430      ( -11.2832 12.6576 )
Norm@50keV   : 0.140341    ( -0.137253   169.671 )
------------------------------------------------------------
#Fit statistic : Chi-Squared =          65.97 using 59 PHA bins.
# Reduced chi-squared =          1.199 for     55 degrees of freedom
# Null hypothesis probability =   1.478290e-01

Photon flux (15-150 keV)    in 54.26 sec:  (    ) ph/cm2/s
Energy fluence (15-150 keV)             : 0 ( 0  0 ) ergs/cm2
S(25-50 keV) vs. S(50-100 keV) plot

S(25-50 keV)  = 3.65e-07
S(50-100 keV) = 3.09e-07
T90 vs. Hardness ratio plot
T90                                   = 163.763999938965 sec.
Hardness ratio (energy fluence ratio) = 0.846575
Color vs. Color plot
Count Ratio  (25-50 keV) / (15-25 keV) = 0.957797
Count Ratio (50-100 keV) / (15-25 keV) = 0.345183
Mask shadow pattern

IMX = -5.951191007813444E-02, IMY = 2.721016923148862E-01
TIME vs. PHA plot around the trigger time

TIME vs. DetID plot around the trigger time

100 us light curve (15-350 keV)

Spacecraft aspect plot

Bright source in the pre-burst/pre-slew/post-slew images
Pre-burst image of 15-350 keV band
Time interval of the image:
-314.851400 -44.116000

# RAcent  DECcent POSerr Theta    Phi  PeakCts   SNR AngSep     Name
#  [deg]    [deg]    ['] [deg]  [deg]                   [']
299.6120  35.1855    0.7  48.7  -39.8  13.9939  17.8    1.4	Cyg X-1
308.1725  40.9607    2.6  40.2  -43.2   1.8318   4.5    2.9	Cyg X-3
326.1173  38.2998    7.4  35.0  -64.8   0.6612   1.6    2.9	Cyg X-2
341.4732  65.4911    3.1  10.6  -18.3   0.7610   3.7 ------	UNKNOWN
 28.4554  32.1514    2.3  34.8 -160.8   1.2442   5.0 ------	UNKNOWN
 38.0285  18.3084    2.9  50.6 -167.0   2.2049   3.9 ------	UNKNOWN
358.6502  41.7394    2.5  22.8 -111.9   1.1537   4.6 ------	UNKNOWN
 11.9618  31.2684    2.2  33.1 -135.7   1.5499   5.3 ------	UNKNOWN
Pre-slew background subtracted image of 15-350 keV band
Time interval of the image:
-44.116000 10.148600

# RAcent  DECcent POSerr Theta    Phi  PeakCts   SNR AngSep     Name
#  [deg]    [deg]    ['] [deg]  [deg]                   [']
299.5788  35.2976    6.3  48.7  -39.7   0.4804   1.8    5.8	Cyg X-1
308.1729  40.8431    7.2  40.3  -43.4   0.2475   1.6    7.2	Cyg X-3
326.0925  38.1837    5.6  35.1  -64.8  -0.3227  -2.1    9.1	Cyg X-2
220.6416  64.7796    2.0  48.7   34.6   2.2931   5.7 ------	UNKNOWN
356.4684  49.4880    0.9  15.6 -102.3   1.2340  13.1 ------	UNKNOWN
 31.5200  18.2252    2.1  49.0 -159.2   1.0203   5.6 ------	UNKNOWN
Post-slew image of 15-350 keV band
Time interval of the image:
47.148600 842.504400

# RAcent  DECcent POSerr Theta    Phi  PeakCts   SNR AngSep     Name
#  [deg]    [deg]    ['] [deg]  [deg]                   [']
299.5893  35.2025    0.2  43.2  -28.8  41.9152  47.6    0.1	Cyg X-1
308.1356  40.9828    1.3  34.4  -27.2   5.8397   9.0    2.1	Cyg X-3
326.1286  38.4773    4.6  24.2  -47.2   1.4803   2.5    9.6	Cyg X-2
 57.0597  34.4430    3.1  46.1  143.6   5.9197   3.7 ------	UNKNOWN
 33.0249  27.6551    3.1  35.4  172.8   2.8736   3.8 ------	UNKNOWN
276.3664  49.0602    3.1  49.6    0.4   4.4372   3.8 ------	UNKNOWN
 35.7106  14.9459    2.6  47.0 -178.4   4.2874   4.4 ------	UNKNOWN
348.7430  23.9179    3.2  26.3 -105.6   2.1896   3.6 ------	UNKNOWN
341.9980  26.3055    3.2  25.8  -90.7   2.4330   3.5 ------	UNKNOWN
Plot creation:
Sun May 31 02:14:14 EDT 2015