Click here for the BAT GCN circular template
Image
Pre-slew 15-350 keV image (Event data; bkg subtracted)

#   RAcent  DECcent POSerr  Theta    Phi     Peak Cts     SNR  Name
  268.6275 -26.3382 0.0313   24.6 -161.2       1.8638     6.1  TRIG_00414875
------------------------------------------

Foreground time interval of the image:
  0.000 320.000 (delta_t = 320.000 [sec])
Background time interval of the image:
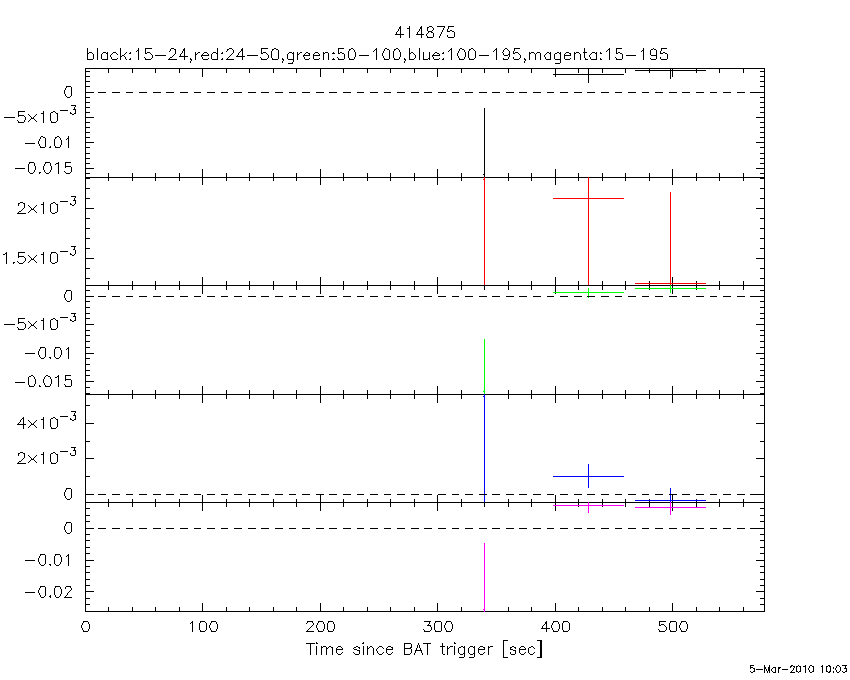
Lightcurves
Notes:
- 1) All plots contain as much data as has been downloaded to date.
- 2) Multiple plots of different time binning/intervals are shown to cover all scenarios of short/long GRBs, rate/image triggers, and real/false positives.
- 3) For all the mask-weighted lightcurves, the y-axis units are counts/sec/det where a det is 0.4 x 0.4 = 0.16 sq cm.
- 4) The verticle lines correspond to following: green dotted lines are T50 interval, black dotted lines are T90 interval, blue solid line(s) is a spacecraft slew start time, and orange solid line(s) is a spacecraft slew end time.
- 5) Time of each bin is in the middle of the bin.
1 s binning
From T0-310 s to T0+310 s

From T100_start - 20 s to T100_end + 30 s

Full time interval

64 ms binning
Full time interval

From T100_start to T100_end

From T0-5 sec to T0+5 sec

16 ms binning
From T100_start-5 s to T100_start+5 s

8 ms binning
From T100_start-3 s to T100_start+3 s

2 ms binning
From T100_start-1 s to T100_start+1 s

SN=5 or 10 sec. binning (whichever binning is satisfied first)

SN=5 or 10 sec. binning (T < 200 sec)

The mask-weighted light curves based on cleaned DPHs
Spectra
Notes:
- 1) The fitting includes the systematic errors.
- 2) For long bursts, a spectral fit of the pre-slew DRM will introduce some errors in both a spectral shape and a normalization if the PHA file contains a lot of the slew/post-slew time interval.
- 3) For fits to more complicated models (e.g. a power-law over a cutoff power-law), the BAT team has decided to require a chi-square improvement of more than 6 for each extra dof.
- 4) For short bursts (T90<1sec), the specrtum is also fit with Blackbody, OTTB, and Double Blackbody.
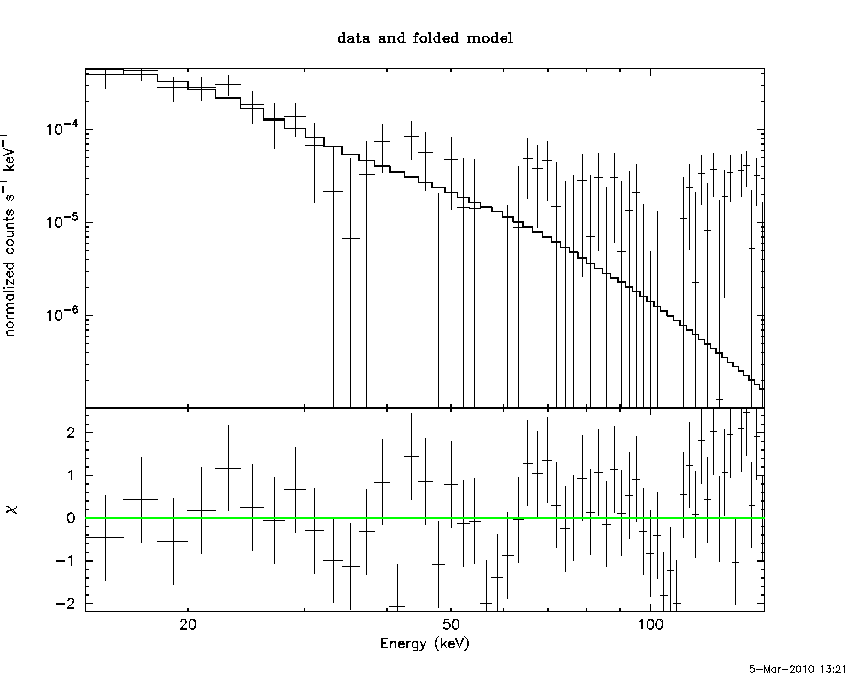
Time averaged spectrum fit using the pre-slew DRM
Power-law model

Time interval is from    0.000 sec. to  320.000 sec.

Spectral model in power-law:
------------------------------------------------------------
Parameters  : value       lower 90%   higher 90%
Photon index: 3.20232     ( -0.50598   0.604348 )
Norm@50keV  : 1.47118E-04    ( -6.43391e-05   7.6007e-05 )
------------------------------------------------------------
# Chi-Squared =          70.08 using 59 PHA bins.
# Reduced chi-squared =          1.230 for     57 degrees of freedom
# Null hypothesis probability =   1.143308e-01

Photon flux (15-150 keV)    in 320 sec: 4.70508E-02 ( -0.00814731  0.00817854 ) ph/cm2/s
Energy fluence (15-150 keV)             : 6.25053e-07 ( -1.40387e-07  1.57564e-07 ) ergs/cm2
Cutoff power-law model

Time interval is from    0.000 sec. to  320.000 sec.
Spectral model in the cutoff power-law:
------------------------------------------------------------
Parameters  : value       lower 90%   higher 90%
Photon index: 1.00000     (     )
Epeak [keV] : 50.0000      (   )
Norm@50keV  : 8.54540E-04    (     )
------------------------------------------------------------
# Chi-Squared =          98.96 using 59 PHA bins.
# Reduced chi-squared =          1.767 for     56 degrees of freedom
# Null hypothesis probability =   3.522297e-04

Photon flux (15-150 keV)    in 320 sec: 4.70264E-02 ( -0.008144  0.0081752 ) ph/cm2/s
Energy fluence (15-150 keV)             : 6.24874e-07 ( -1.4033e-07  1.57472e-07 ) ergs/cm2
Band function

Time interval is from    0.000 sec. to  320.000 sec.

Spectral model in the Band function:
------------------------------------------------------------
Parameters  : value       lower 90%   higher 90%
alpha       : -1.55789   ( 1.5579   1.5579 )
beta        : -3.46679    ( 3.47145   0.738306 )
Epeak [keV] : 6.09362      ( -6.08437 12.7932 )
Norm@50keV   : 2.96533E-03    ( -0.00298295   16.6824 )
------------------------------------------------------------
# Chi-Squared =          69.70 using 59 PHA bins.
# Reduced chi-squared =          1.267 for     55 degrees of freedom
# Null hypothesis probability =   8.762281e-02

Photon flux (15-150 keV)    in 320 sec:  (    ) ph/cm2/s
Energy fluence (15-150 keV)             : 0 ( 0  0 ) ergs/cm2
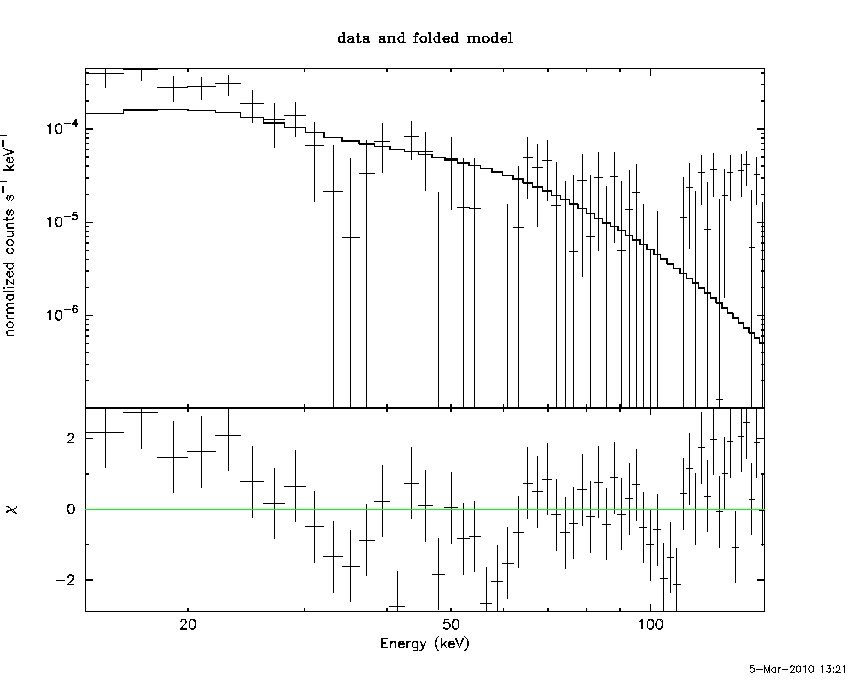
Peak spectrum fit
Power-law model

Time interval is from    0.000 sec. to  320.000 sec.

Spectral model in power-law:
------------------------------------------------------------
Parameters  : value       lower 90%   higher 90%
Photon index: 3.17261     ( -0.453232   0.543484 )
Norm@50keV  : 1.50374E-04    ( -6.26422e-05   7.37378e-05 )
------------------------------------------------------------
# Chi-Squared =          70.83 using 59 PHA bins.
# Reduced chi-squared =          1.243 for     57 degrees of freedom
# Null hypothesis probability =   1.030647e-01

Photon flux (15-150 keV)    in 320 sec: 4.70249E-02 ( -0.00761408  0.00766057 ) ph/cm2/s
Energy fluence (15-150 keV)             : 6.29411e-07 ( -1.39164e-07  1.56854e-07 ) ergs/cm2
Cutoff power-law model

Time interval is from    0.000 sec. to  320.000 sec.
Spectral model in the cutoff power-law:
------------------------------------------------------------
Parameters  : value       lower 90%   higher 90%
Photon index: 1.00000     (     )
Epeak [keV] : 50.0000      (   )
Norm@50keV  : 9.29292E-04    (     )
------------------------------------------------------------
# Chi-Squared =         108.20 using 59 PHA bins.
# Reduced chi-squared =         1.9321 for     56 degrees of freedom
# Null hypothesis probability =   3.554630e-05

Photon flux (15-150 keV)    in 320 sec: 4.70009E-02 ( -0.0076115  0.0076579 ) ph/cm2/s
Energy fluence (15-150 keV)             : 6.29226e-07 ( -1.39104e-07  1.56762e-07 ) ergs/cm2
Band function

Time interval is from    0.000 sec. to  320.000 sec.

Spectral model in the Band function:
------------------------------------------------------------
Parameters  : value       lower 90%   higher 90%
alpha       : -0.400072   ( 1.70554   1.70554 )
beta        : -3.54085    ( 3.47161   11.6132 )
Epeak [keV] : 12.8471      ( -12.8156 6.83391 )
Norm@50keV   : 2.47786E-02    ( -0.0252596   710.594 )
------------------------------------------------------------
# Chi-Squared =          70.29 using 59 PHA bins.
# Reduced chi-squared =          1.278 for     55 degrees of freedom
# Null hypothesis probability =   8.024766e-02

Photon flux (15-150 keV)    in 320 sec:  (    ) ph/cm2/s
Energy fluence (15-150 keV)             : 0 ( 0  0 ) ergs/cm2
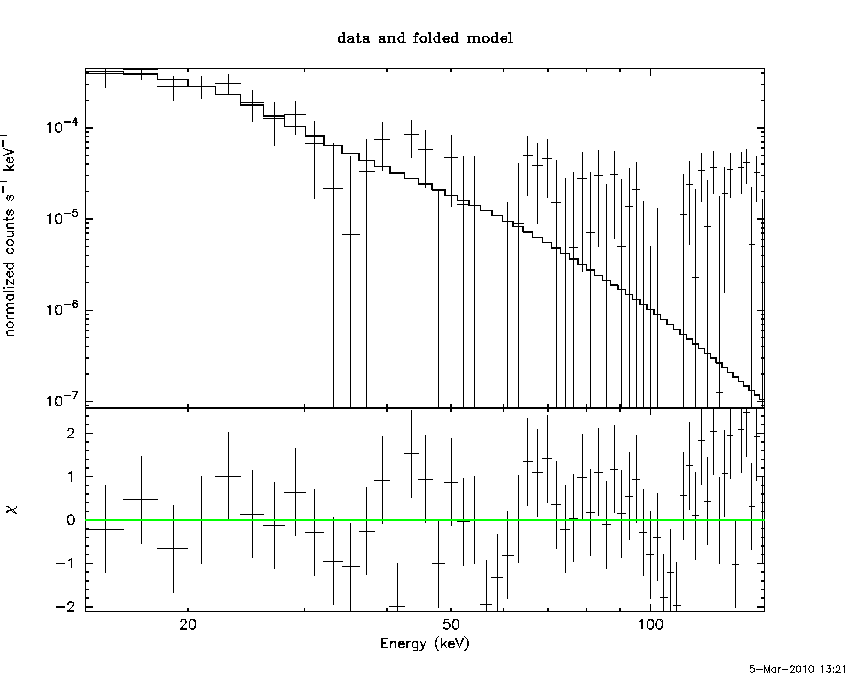
Pre-slew spectrum (Pre-slew PHA with pre-slew DRM)
Power-law model
Spectral model in power-law:
------------------------------------------------------------
Parameters  : value       lower 90%   higher 90%
Photon index: 3.20232     ( -0.50598   0.604348 )
Norm@50keV  : 1.47118E-04    ( -6.43391e-05   7.6007e-05 )
------------------------------------------------------------
# Chi-Squared =          70.08 using 59 PHA bins.
# Reduced chi-squared =          1.230 for     57 degrees of freedom
# Null hypothesis probability =   1.143308e-01

Photon flux (15-150 keV)    in 320 sec: 4.70508E-02 ( -0.00814731  0.00817854 ) ph/cm2/s
Energy fluence (15-150 keV)             : 6.25053e-07 ( -1.40387e-07  1.57564e-07 ) ergs/cm2
Cutoff power-law model
Spectral model in the cutoff power-law:
------------------------------------------------------------
Parameters  : value       lower 90%   higher 90%
Photon index: 1.00000     (     )
Epeak [keV] : 50.0000      (   )
Norm@50keV  : 8.54540E-04    (     )
------------------------------------------------------------
# Chi-Squared =          98.96 using 59 PHA bins.
# Reduced chi-squared =          1.767 for     56 degrees of freedom
# Null hypothesis probability =   3.522297e-04

Photon flux (15-150 keV)    in 320 sec: 4.70264E-02 ( -0.008144  0.0081752 ) ph/cm2/s
Energy fluence (15-150 keV)             : 6.24874e-07 ( -1.4033e-07  1.57472e-07 ) ergs/cm2
Band function
Spectral model in the Band function:
------------------------------------------------------------
Parameters  : value       lower 90%   higher 90%
alpha       : -1.55789   ( 1.5579   1.5579 )
beta        : -3.46679    ( 3.47145   0.738306 )
Epeak [keV] : 6.09362      ( -6.08437 12.7932 )
Norm@50keV   : 2.96533E-03    ( -0.00298295   16.6824 )
------------------------------------------------------------
# Chi-Squared =          69.70 using 59 PHA bins.
# Reduced chi-squared =          1.267 for     55 degrees of freedom
# Null hypothesis probability =   8.762281e-02

Photon flux (15-150 keV)    in 320 sec:  (    ) ph/cm2/s
Energy fluence (15-150 keV)             : 0 ( 0  0 ) ergs/cm2
S(25-50 keV) vs. S(50-100 keV) plot

S(25-50 keV)  = 2.04035e-07
S(50-100 keV) = 8.86682e-08
T90 vs. Hardness ratio plot

T90                                   = 320 sec.
Hardness ratio (energy fluence ratio) = 0.434573
Color vs. Color plot

Count Ratio  (25-50 keV) / (15-25 keV) = 0.387915
Count Ratio (50-100 keV) / (15-25 keV) = 0.144314
Mask shadow pattern

IMX = -4.331646531596388E-01, IMY = 1.478716112025306E-01
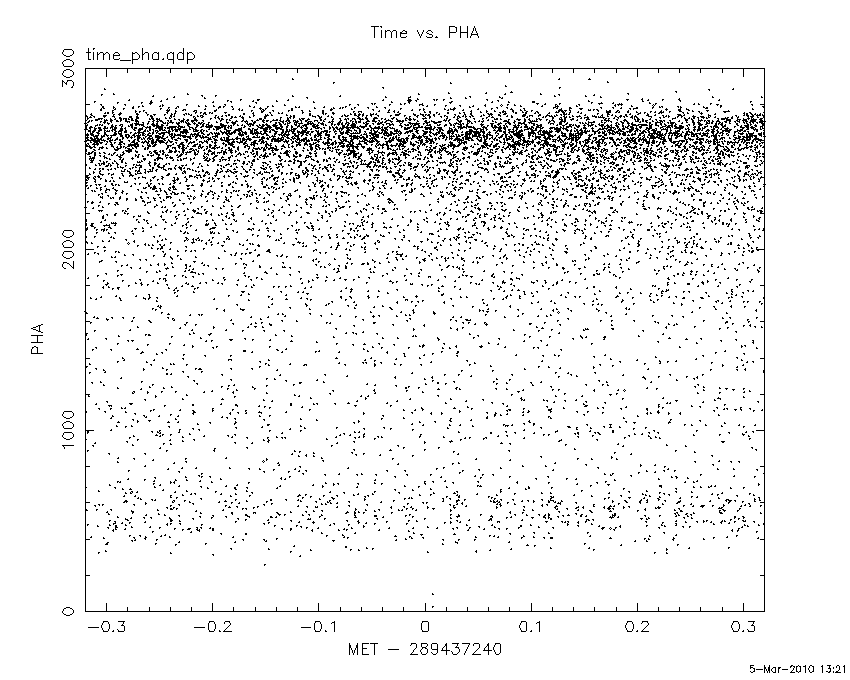
TIME vs. PHA plot around the trigger time
TIME vs. DetID plot around the trigger time

100 us light curve (15-350 keV)

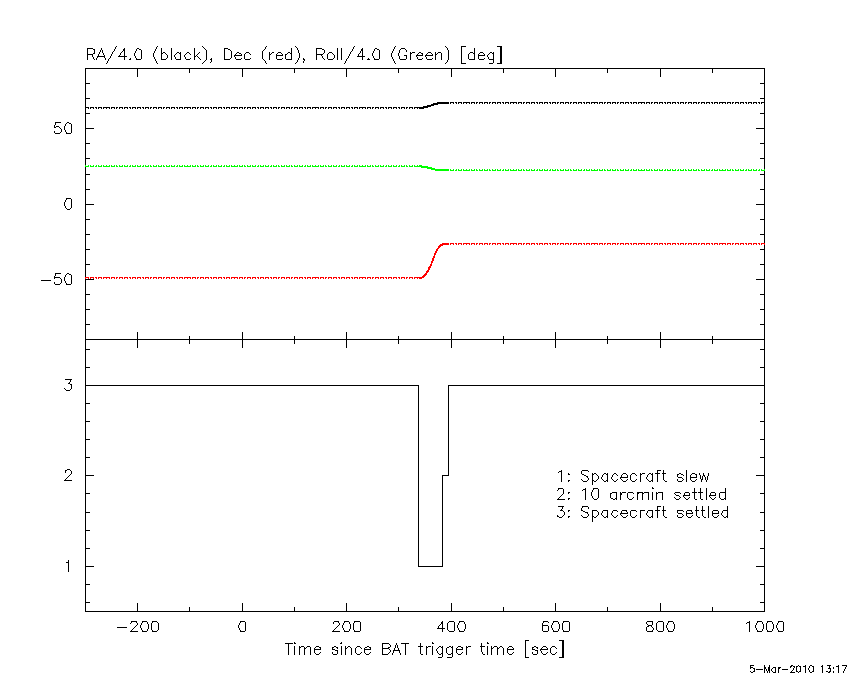
Spacecraft aspect plot
Bright source in the pre-burst/pre-slew/post-slew images
Pre-burst image of 15-350 keV band
Time interval of the image:
Pre-slew background subtracted image of 15-350 keV band
Time interval of the image:
0.000000 320.000000

# RAcent  DECcent POSerr Theta    Phi  PeakCts   SNR AngSep     Name
#  [deg]    [deg]    ['] [deg]  [deg]                   [']
170.4707 -60.6339    6.8  47.0   32.1   1.4513   1.7    4.6	Cen X-3
186.6404 -62.8035    2.4  39.0   32.8   2.6277   4.8    2.0	GX 301-2
244.9926 -15.6469    0.4  34.3  151.6  12.0624  26.4    0.9	Sco X-1
255.9925 -37.8428  137.2  11.0  171.2  -0.0235  -0.1    0.3	4U 1700-377
256.4354 -36.4230    3.0  12.4  172.8   1.1229   3.9    0.0	GX 349+2
262.9391 -24.8066    2.8  24.6 -174.0   1.1499   4.2    5.3	GX 1+4
264.7079 -44.5980    4.4   7.4 -130.8   0.6857   2.6    9.0	4U 1735-44
268.4644  -1.3718   97.8  48.7 -172.8   0.0673   0.1    7.5	SW J1753.5-0127
270.3630 -25.0668    4.2  26.3 -158.8   0.8450   2.8    4.3	GX 5-1
270.3964 -25.7495    4.5  25.7 -158.2   0.7914   2.6    5.1	GRS 1758-258
274.0190 -14.0144    5.5  37.9 -160.2   0.9677   2.1    1.5	GX 17+2
275.9879 -30.3013    4.1  24.0 -142.7   0.8499   2.8    5.1	H1820-303
284.8964 -24.9861    6.9  32.9 -135.6   0.6193   1.7    8.6	HT1900.1-2455
205.9044 -54.3647    2.9  30.8   50.6   1.6764   4.0 ------	UNKNOWN
225.9216 -52.9702    3.1  19.1   56.2   1.0891   3.7 ------	UNKNOWN
255.1832 -41.6256    1.8   7.2  166.8   1.7553   6.5 ------	UNKNOWN
259.9092 -20.5587    2.7  28.4  178.4   1.2522   4.2 ------	UNKNOWN
255.6940 -48.7763    0.8   0.0  115.7   3.9330  14.1 ------	UNKNOWN
268.6273 -26.3382    1.9  24.6 -161.2   1.8643   6.1 ------	UNKNOWN
 55.4905 -73.9784    3.7  56.5  -16.4   3.7669   3.1 ------	UNKNOWN
291.8709  -4.4122    3.3  54.0 -143.2   6.6260   3.6 ------	UNKNOWN
Post-slew image of 15-350 keV band
Time interval of the image:
383.900600 821.920000

# RAcent  DECcent POSerr Theta    Phi  PeakCts   SNR AngSep     Name
#  [deg]    [deg]    ['] [deg]  [deg]                   [']
244.9854 -15.6460    0.3  24.5  111.6  15.9470  37.3    0.5	Sco X-1
255.9930 -37.9937    6.0  15.8   39.7  -0.6614  -1.9    9.0	4U 1700-377
256.4701 -36.5753    3.1  14.5   42.7   1.2448   3.7    9.3	GX 349+2
262.9520 -24.7194    3.4   5.4  106.8   1.1087   3.4    3.5	GX 1+4
264.7934 -44.5656   26.0  18.5    9.0  -0.1446  -0.4    7.3	4U 1735-44
268.3695  -1.3356    3.1  25.0  179.8   1.3034   3.8    7.0	SW J1753.5-0127
270.1681 -25.1377    4.9   1.9 -129.9   0.8442   2.3    7.2	GX 5-1
270.4683 -25.7619    6.9   1.8 -108.4   0.6212   1.7    9.0	GRS 1758-258
274.0272 -14.1055    2.5  13.2 -156.1   1.6673   4.6    4.3	GX 17+2
275.7414 -30.2287    0.0   7.4  -56.2   1.1948   3.5   12.6	H1820-303
285.1118 -24.8196  112.4  15.0  -91.8   0.0365   0.1    7.3	HT1900.1-2455
288.7826  10.9446    1.2  42.1 -149.3   6.4479  10.1    0.9	GRS 1915+105
250.3232   0.6234    2.9  32.2  144.3   1.8935   3.9 ------	UNKNOWN
255.1773 -41.6253    1.6  18.9   32.9   2.6062   7.3 ------	UNKNOWN
261.5917  25.0288    2.9  51.8  172.3   4.4050   4.1 ------	UNKNOWN
255.7206 -48.8056    1.0  24.6   21.0   4.0302  11.8 ------	UNKNOWN
268.5966 -26.2866    1.8   0.1  170.1   2.3116   6.4 ------	UNKNOWN
340.4276 -67.8317    3.2  58.9  -24.4  10.2170   3.6 ------	UNKNOWN
323.1803 -43.8397    4.4  47.0  -53.1   5.7796   2.7 ------	UNKNOWN
Plot creation:
Fri Mar  5 13:22:11 EST 2010