Special notes of this burst
Image
Pre-slew 15.0-350.0 keV image (Event data)

#   RAcent    DECcent   POSerr    Theta     Phi              Peak Cts       SNR   Name
  251.9550    71.8182   0.0130    43.9846   144.0835         1.2491296     14.695 TRIG_00416076

Foreground time interval of the image:
 -1.208   6.760 (delta_t =   7.968 [sec])
Background time interval of the image:
-239.048  -1.208 (delta_t = 237.840 [sec])
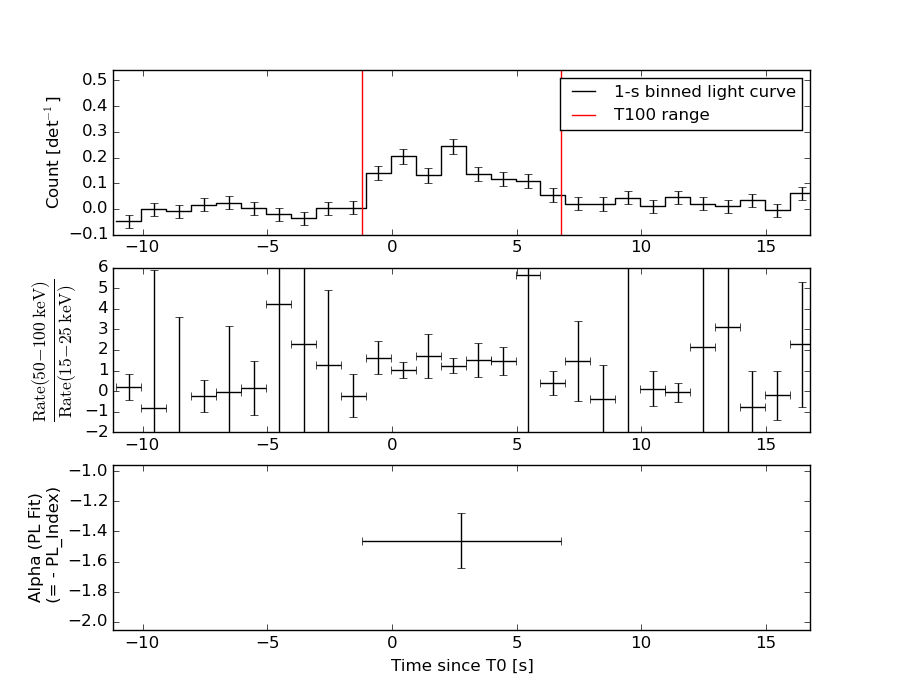
Lightcurves
Notes:
- 1) The mask-weighted light curves are using the flight position.
- 2) Multiple plots of different time binning/intervals are shown to cover all scenarios of short/long GRBs, rate/image triggers, and real/false positives.
- 3) For all the mask-weighted lightcurves, the y-axis units are counts/sec/det where a det is 0.4 x 0.4 = 0.16 sq cm.
- 4) The verticle lines correspond to following: green dotted lines are T50 interval, black dotted lines are T90 interval, blue solid line(s) is a spacecraft slew start time, and orange solid line(s) is a spacecraft slew end time.
- 5) Time of each bin is in the middle of the bin.
1 s binning
From T0-310 s to T0+310 s

From T100_start - 20 s to T100_end + 30 s

Full time interval
64 ms binning
Full time interval
From T100_start to T100_end

From T0-5 sec to T0+5 sec

16 ms binning
From T100_start-5 s to T100_start+5 s
Blue+Cyan dotted lines: Time interval of the scaled map
From 0.000000 to 2.048000
8 ms binning
From T100_start-3 s to T100_start+3 s

Blue+Cyan dotted lines: Time interval of the scaled map
From 0.000000 to 2.048000
2 ms binning
From T100_start-1 s to T100_start+1 s
Blue+Cyan dotted lines: Time interval of the scaled map
From 0.000000 to 2.048000
SN=5 or 10 sec. binning (whichever binning is satisfied first)
SN=5 or 10 sec. binning (T < 200 sec)

Quad-rate summed light curves (from T0-300s to T0+1000s)

The mask-weighted light curves based on cleaned DPHs

Spectral Evolution
Spectra
Notes:
- 1) The fitting includes the systematic errors.
- 2) When the burst includes telescope slew time periods, the fitting uses an average response file made from multiple 5-s response files through out the slew time plus single time preiod for the non-slew times, and weighted by the total counts in the corresponding time period using addrmf. An average response file is needed becuase a spectral fit using the pre-slew DRM will introduce some errors in both a spectral shape and a normalization if the PHA file contains a lot of the slew/post-slew time interval.
- 3) For fits to more complicated models (e.g. a power-law over a cutoff power-law), the BAT team has decided to require a chi-square improvement of more than 6 for each extra dof.
Time averaged spectrum fit using the average DRM
Power-law model

Time interval is from   -1.208 sec. to    6.760 sec.

Spectral model in power-law:
------------------------------------------------------------
Parameters  : value       lower 90%   higher 90%
Photon index: 1.46189     ( -0.182066   0.182666 )
Norm@50keV  : 1.08085E-02    ( -0.00114072   0.00113872 )
------------------------------------------------------------
#Fit statistic : Chi-Squared =          52.51 using 59 PHA bins.
# Reduced chi-squared =         0.9211 for     57 degrees of freedom
# Null hypothesis probability =   6.441854e-01

Photon flux (15-150 keV)    in 7.968 sec: 1.33597 ( -0.148267  0.148805 ) ph/cm2/s
Energy fluence (15-150 keV)             : 8.22353e-07 ( -9.2679e-08  9.30806e-08 ) ergs/cm2
Cutoff power-law model

Time interval is from   -1.208 sec. to    6.760 sec.
Spectral model in the cutoff power-law:
------------------------------------------------------------
Parameters  : value       lower 90%   higher 90%
Photon index: 1.11157     ( -0.822135   0.498815 )
Epeak [keV] : 139.397      ( -62.7101 -139.393 )
Norm@50keV  : 1.57605E-02    (     )
------------------------------------------------------------
#Fit statistic : Chi-Squared =          51.82 using 59 PHA bins.
# Reduced chi-squared =         0.9253 for     56 degrees of freedom
# Null hypothesis probability =   6.338429e-01

Photon flux (15-150 keV)    in 7.968 sec: 1.31367 ( -0.15594  0.15524 ) ph/cm2/s
Energy fluence (15-150 keV)             : 8.1064e-07 ( -9.69482e-08  9.65881e-08 ) ergs/cm2
Band function

Time interval is from   -1.208 sec. to    6.760 sec.

Spectral model in the Band function:
------------------------------------------------------------
Parameters  : value       lower 90%   higher 90%
alpha       : -1.13234   ( -0.458197   0.69193 )
beta        : -8.56635    ( 7.51765   17.5176 )
Epeak [keV] : 144.797      ( -52.5886 -144.79 )
Norm@50keV   : 1.54111E-02    ( -0.00161595   0.00959603 )
------------------------------------------------------------
#Fit statistic : Chi-Squared =          51.82 using 59 PHA bins.
# Reduced chi-squared =         0.9422 for     55 degrees of freedom
# Null hypothesis probability =   5.969004e-01

Photon flux (15-150 keV)    in 7.968 sec:  (    ) ph/cm2/s
Energy fluence (15-150 keV)             : 0 ( 0  0 ) ergs/cm2
Single BB

Spectral model blackbody:
------------------------------------------------------------
Parameters  : value    Lower 90%  Upper 90%
kT [keV]    : 17.6607  (-2.1221  2.4711)
R^2/D10^2   : 8.74321E-02  (-0.0321986   0.0495042)
(R is the radius in km and D10 is the distance to the source in units of 10 kpc)
------------------------------------------------------------
#Fit statistic : Chi-Squared =          69.21 using 59 PHA bins.
# Reduced chi-squared =          1.214 for     57 degrees of freedom
# Null hypothesis probability =   1.288333e-01

Energy  Fluence     90% Error
[keV]   [erg/cm2]   [erg/cm2]
15- 25  4.377e-08   9.179e-09
25- 50  1.995e-07   2.944e-08
50-150  4.494e-07   7.924e-08
15-150  6.927e-07   9.848e-08
Thermal bremsstrahlung (OTTB)

Spectral model: thermal bremsstrahlung
------------------------------------------------------------
Parameters  : value         Lower 90%    Upper 90%
kT [keV]    : 200.000       (      )
Norm        : 5.53612       (-0.582032     0.58197)
------------------------------------------------------------
#Fit statistic : Chi-Squared =          53.07 using 59 PHA bins.
# Reduced chi-squared =         0.9311 for     57 degrees of freedom
# Null hypothesis probability =   6.231454e-01

Energy  Fluence     90% Error
[keV]   [erg/cm2]   [erg/cm2]
15- 25  1.099e-07   4.060e-08
25- 50  2.113e-07   7.499e-08
50-150  4.635e-07   2.091e-07
15-150  7.846e-07   3.703e-07
Double BB

Spectral model: bbodyrad<1> + bbodyrad<2>
------------------------------------------------------------
Parameters  : value         Lower 90%    Upper 90%
kT1 [keV]   : 4.39048        (-1.58758      2.35497)
R1^2/D10^2  : 7.47644        (-6.22438      68.7409)
kT2 [keV]   : 21.8304        (-3.36245      5.08941)
R2^2/D10^2  : 3.80419E-02    (-0.0204138   0.0319154)
------------------------------------------------------------
#Fit statistic : Chi-Squared =          49.09 using 59 PHA bins.
# Reduced chi-squared =         0.8926 for     55 degrees of freedom
# Null hypothesis probability =   6.986732e-01

Energy  Fluence     90% Error
[keV]   [erg/cm2]   [erg/cm2]
15- 25  1.104e-07   5.230e-08
25- 50  1.803e-07   5.104e-08
50-150  5.035e-07   1.369e-07
15-150  7.942e-07   2.063e-07
Peak spectrum fit
Power-law model

Time interval is from    1.948 sec. to    2.948 sec.

Spectral model in power-law:
------------------------------------------------------------
Parameters  : value       lower 90%   higher 90%
Photon index: 1.45868     ( -0.298999   0.298903 )
Norm@50keV  : 1.82913E-02    ( -0.00321475   0.00321011 )
------------------------------------------------------------
#Fit statistic : Chi-Squared =          53.64 using 59 PHA bins.
# Reduced chi-squared =         0.9411 for     57 degrees of freedom
# Null hypothesis probability =   6.017522e-01

Photon flux (15-150 keV)    in 1 sec: 2.25904 ( -0.415762  0.417869 ) ph/cm2/s
Energy fluence (15-150 keV)             : 1.74757e-07 ( -3.26842e-08  3.29083e-08 ) ergs/cm2
Cutoff power-law model
Time interval is from    1.948 sec. to    2.948 sec.
Spectral model in the cutoff power-law:
------------------------------------------------------------
Parameters  : value       lower 90%   higher 90%
Photon index: 1.09954     ( -1.41444   1.38869 )
Epeak [keV] : 134.089      ( -134.089 -134.089 )
Norm@50keV  : 2.72484E-02    ( -0.0119156   0.0954937 )
------------------------------------------------------------
#Fit statistic : Chi-Squared =          53.36 using 59 PHA bins.
# Reduced chi-squared =         0.9529 for     56 degrees of freedom
# Null hypothesis probability =   5.754241e-01

Photon flux (15-150 keV)    in 1 sec: 2.22759 ( -0.42868  0.42849 ) ph/cm2/s
Energy fluence (15-150 keV)             : 1.72059e-07 ( -3.4521e-08  3.4127e-08 ) ergs/cm2
Band function

Time interval is from    1.948 sec. to    2.948 sec.

Spectral model in the Band function:
------------------------------------------------------------
Parameters  : value       lower 90%   higher 90%
alpha       : -1.09845   ( 0.872732   5.83645 )
beta        : -1.85753    ( 2.01566   12.0074 )
Epeak [keV] : 132.482      ( -129.796 -129.796 )
Norm@50keV   : 2.73370E-02    ( -0.0110269   0 )
------------------------------------------------------------
#Fit statistic : Chi-Squared =          53.34 using 59 PHA bins.
# Reduced chi-squared =         0.9699 for     55 degrees of freedom
# Null hypothesis probability =   5.381412e-01

Photon flux (15-150 keV)    in 1 sec:  (    ) ph/cm2/s
Energy fluence (15-150 keV)             : 0 ( 0  0 ) ergs/cm2
Single BB

Spectral model blackbody:
------------------------------------------------------------
Parameters  : value    Lower 90%  Upper 90%
kT [keV]    : 16.7714  (-3.39788  4.36058)
R^2/D10^2   : 0.177323  (-0.0984922   0.214476)
(R is the radius in km and D10 is the distance to the source in units of 10 kpc)
------------------------------------------------------------
#Fit statistic : Chi-Squared =          60.26 using 59 PHA bins.
# Reduced chi-squared =          1.057 for     57 degrees of freedom
# Null hypothesis probability =   3.587481e-01

Energy  Fluence     90% Error
[keV]   [erg/cm2]   [erg/cm2]
15- 25  1.019e-08   3.448e-09
25- 50  4.462e-08   1.357e-08
50-150  8.922e-08   3.108e-08
15-150  1.440e-07   4.234e-08
Thermal bremsstrahlung (OTTB)
Spectral model: thermal bremsstrahlung
------------------------------------------------------------
Parameters  : value         Lower 90%    Upper 90%
kT [keV]    : 199.360       (-87.7981      -199.362)
Norm        : 9.38251       (-1.6412     1.64464)
------------------------------------------------------------
#Fit statistic : Chi-Squared =          53.78 using 59 PHA bins.
# Reduced chi-squared =         0.9435 for     57 degrees of freedom
# Null hypothesis probability =   5.966519e-01

Energy  Fluence     90% Error
[keV]   [erg/cm2]   [erg/cm2]
15- 25  2.336e-08   1.368e-08
25- 50  4.494e-08   2.552e-08
50-150  9.857e-08   5.690e-08
15-150  1.669e-07   9.445e-08
Double BB
Spectral model: bbodyrad<1> + bbodyrad<2>
------------------------------------------------------------
Parameters  : value         Lower 90%    Upper 90%
kT1 [keV]   : 7.40445        (-4.74981      6.68857)
R1^2/D10^2  : 1.77142        (-1.48292      132.487)
kT2 [keV]   : 26.6057        (-9.84898      -26.6244)
R2^2/D10^2  : 2.82201E-02    (-0.0274757   0.137261)
------------------------------------------------------------
#Fit statistic : Chi-Squared =          53.74 using 59 PHA bins.
# Reduced chi-squared =         0.9771 for     55 degrees of freedom
# Null hypothesis probability =   5.228632e-01

Energy  Fluence     90% Error
[keV]   [erg/cm2]   [erg/cm2]
15- 25  1.983e-08   1.115e-08
25- 50  4.472e-08   2.446e-08
50-150  1.069e-07   6.105e-08
15-150  1.714e-07   8.770e-08
Pre-slew spectrum (Pre-slew PHA with pre-slew DRM)
Power-law model
Spectral model in power-law:
------------------------------------------------------------
Parameters  : value       lower 90%   higher 90%
Photon index: 1.46189     ( -0.182066   0.182666 )
Norm@50keV  : 1.08085E-02    ( -0.00114072   0.00113872 )
------------------------------------------------------------
#Fit statistic : Chi-Squared =          52.51 using 59 PHA bins.
# Reduced chi-squared =         0.9211 for     57 degrees of freedom
# Null hypothesis probability =   6.441854e-01

Photon flux (15-150 keV)    in 7.968 sec: 1.33597 ( -0.148267  0.148805 ) ph/cm2/s
Energy fluence (15-150 keV)             : 8.22353e-07 ( -9.2679e-08  9.30806e-08 ) ergs/cm2
Cutoff power-law model
Spectral model in the cutoff power-law:
------------------------------------------------------------
Parameters  : value       lower 90%   higher 90%
Photon index: 1.11157     ( -0.822135   0.498815 )
Epeak [keV] : 139.397      ( -62.7101 -139.393 )
Norm@50keV  : 1.57605E-02    (     )
------------------------------------------------------------
#Fit statistic : Chi-Squared =          51.82 using 59 PHA bins.
# Reduced chi-squared =         0.9253 for     56 degrees of freedom
# Null hypothesis probability =   6.338429e-01

Photon flux (15-150 keV)    in 7.968 sec: 1.31367 ( -0.15594  0.15524 ) ph/cm2/s
Energy fluence (15-150 keV)             : 8.1064e-07 ( -9.69482e-08  9.65881e-08 ) ergs/cm2
Band function

Spectral model in the Band function:
------------------------------------------------------------
Parameters  : value       lower 90%   higher 90%
alpha       : -1.13234   ( -0.458302   0.691715 )
beta        : -8.56635    ( 7.51765   17.5176 )
Epeak [keV] : 144.797      ( -52.5886 -144.79 )
Norm@50keV   : 1.54111E-02    ( -0.00161595   0.00959603 )
------------------------------------------------------------
#Fit statistic : Chi-Squared =          51.82 using 59 PHA bins.
# Reduced chi-squared =         0.9422 for     55 degrees of freedom
# Null hypothesis probability =   5.969004e-01

Photon flux (15-150 keV)    in 7.968 sec:  (    ) ph/cm2/s
Energy fluence (15-150 keV)             : 0 ( 0  0 ) ergs/cm2
S(25-50 keV) vs. S(50-100 keV) plot

S(25-50 keV)  = 2.00e-07
S(50-100 keV) = 2.90e-07
T90 vs. Hardness ratio plot
T90                                   = 6.75200003385544 sec.
Hardness ratio (energy fluence ratio) = 1.45
Color vs. Color plot

Count Ratio  (25-50 keV) / (15-25 keV) = 1.35471
Count Ratio (50-100 keV) / (15-25 keV) = 1.37379
Mask shadow pattern

IMX = -7.816647915960692E-01, IMY = -5.661738871788703E-01
TIME vs. PHA plot around the trigger time

Blue+Cyan dotted lines: Time interval of the scaled map
From 0.000000 to 2.048000
TIME vs. DetID plot around the trigger time

Blue+Cyan dotted lines: Time interval of the scaled map
From 0.000000 to 2.048000
100 us light curve (15-350 keV)

Blue+Cyan dotted lines: Time interval of the scaled map
From 0.000000 to 2.048000
Spacecraft aspect plot
Bright source in the pre-burst/pre-slew/post-slew images
Pre-burst image of 15-350 keV band
Time interval of the image:
-239.048000 -1.208000

# RAcent  DECcent POSerr Theta    Phi  PeakCts   SNR AngSep     Name
#  [deg]    [deg]    ['] [deg]  [deg]                   [']
254.4224  35.2152   12.7  36.6   87.0   0.4803   0.9    7.8	Her X-1
268.4815  -1.4159   11.1  46.8   28.6  -0.5508  -1.0    7.2	SW J1753.5-0127
274.0953 -14.1817   12.7  55.0   14.1  -0.9538  -0.9   10.2	GX 17+2
288.7958  10.9715    0.7  26.1    8.1   3.3169  17.4    1.6	GRS 1915+105
299.5863  35.1997    0.2   0.0   28.7   9.3805  50.0    0.2	Cyg X-1
308.0904  40.9425    1.1   8.8 -149.7   1.8814  10.5    1.1	Cyg X-3
325.9235  38.2820    0.0  21.2 -122.6   0.2614   1.3   11.9	Cyg X-2
254.5614  54.0626    2.4  36.3  119.0   1.8671   4.7 ------	UNKNOWN
Pre-slew background subtracted image of 15-350 keV band
Time interval of the image:
-1.208000 6.760000

# RAcent  DECcent POSerr Theta    Phi  PeakCts   SNR AngSep     Name
#  [deg]    [deg]    ['] [deg]  [deg]                   [']
254.3721  35.2082    8.6  36.6   87.0  -0.1169  -1.3    9.1	Her X-1
268.2570  -1.5295    3.5  47.0   28.8   0.2947   3.3    8.1	SW J1753.5-0127
273.9134 -13.9748 1247.4  54.9   14.4  -0.0013  -0.0    6.5	GX 17+2
288.7446  10.9899    5.0  26.1    8.3  -0.0718  -2.3    4.1	GRS 1915+105
299.5161  35.0841    7.4   0.1   11.2  -0.0422  -1.5    7.9	Cyg X-1
308.2579  40.9898    6.8   8.9 -149.4  -0.0447  -1.7    7.0	Cyg X-3
326.3258  38.4117    6.6  21.6 -123.0  -0.0554  -1.7    9.0	Cyg X-2
251.9544  71.8183    0.8  44.0  144.1   1.2476  14.7 ------	UNKNOWN
Post-slew image of 15-350 keV band
Time interval of the image:
286.652590 534.152610

# RAcent  DECcent POSerr Theta    Phi  PeakCts   SNR AngSep     Name
#  [deg]    [deg]    ['] [deg]  [deg]                   [']
 45.7745 -39.6117    2.4  35.6  -35.5   1.1747   4.7 ------	UNKNOWN
303.3331 -27.4499    3.7  58.7 -159.2   4.3998   3.2 ------	UNKNOWN
Plot creation:
Sun May 31 02:01:51 EDT 2015