Special notes of this burst
Image
Pre-slew 15.0-350.0 keV image (Event data)

#   RAcent    DECcent   POSerr    Theta     Phi              Peak Cts       SNR   Name
  163.5003   -45.4619   0.0099    14.4243    83.1554         0.4224468     19.276 TRIG_00416103

Foreground time interval of the image:
 -0.284   4.112 (delta_t =   4.396 [sec])
Background time interval of the image:
-239.592  -0.284 (delta_t = 239.308 [sec])
Lightcurves
Notes:
- 1) The mask-weighted light curves are using the flight position.
- 2) Multiple plots of different time binning/intervals are shown to cover all scenarios of short/long GRBs, rate/image triggers, and real/false positives.
- 3) For all the mask-weighted lightcurves, the y-axis units are counts/sec/det where a det is 0.4 x 0.4 = 0.16 sq cm.
- 4) The verticle lines correspond to following: green dotted lines are T50 interval, black dotted lines are T90 interval, blue solid line(s) is a spacecraft slew start time, and orange solid line(s) is a spacecraft slew end time.
- 5) Time of each bin is in the middle of the bin.
1 s binning
From T0-310 s to T0+310 s

From T100_start - 20 s to T100_end + 30 s

Full time interval

64 ms binning
Full time interval

From T100_start to T100_end
From T0-5 sec to T0+5 sec

16 ms binning
From T100_start-5 s to T100_start+5 s

Blue+Cyan dotted lines: Time interval of the scaled map
From 0.000000 to 0.512000
8 ms binning
From T100_start-3 s to T100_start+3 s

Blue+Cyan dotted lines: Time interval of the scaled map
From 0.000000 to 0.512000
2 ms binning
From T100_start-1 s to T100_start+1 s

Blue+Cyan dotted lines: Time interval of the scaled map
From 0.000000 to 0.512000
SN=5 or 10 sec. binning (whichever binning is satisfied first)

SN=5 or 10 sec. binning (T < 200 sec)

Quad-rate summed light curves (from T0-300s to T0+1000s)

The mask-weighted light curves based on cleaned DPHs

Spectral Evolution
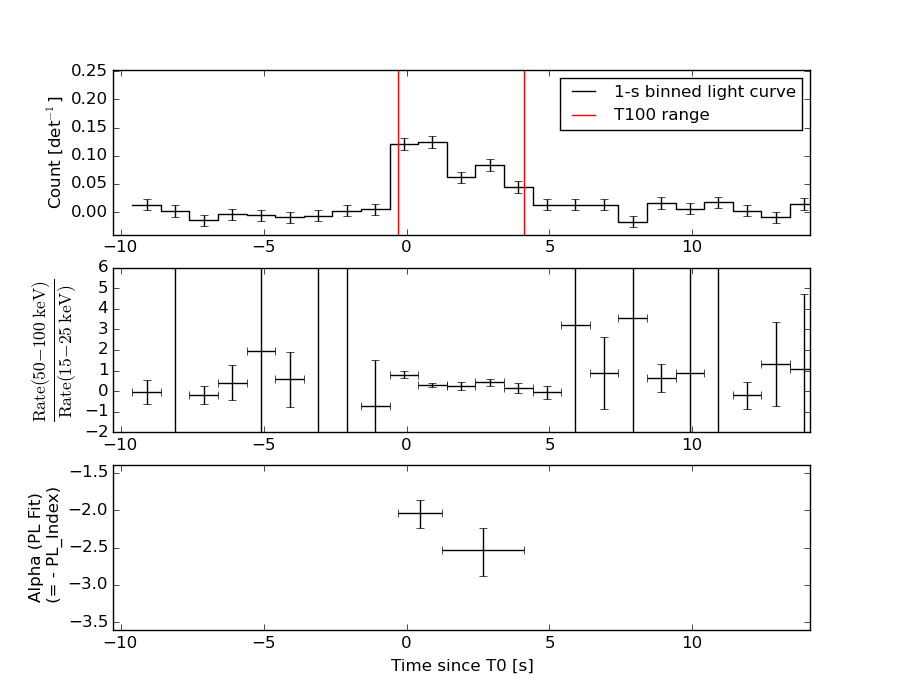
Spectra
Notes:
- 1) The fitting includes the systematic errors.
- 2) When the burst includes telescope slew time periods, the fitting uses an average response file made from multiple 5-s response files through out the slew time plus single time preiod for the non-slew times, and weighted by the total counts in the corresponding time period using addrmf. An average response file is needed becuase a spectral fit using the pre-slew DRM will introduce some errors in both a spectral shape and a normalization if the PHA file contains a lot of the slew/post-slew time interval.
- 3) For fits to more complicated models (e.g. a power-law over a cutoff power-law), the BAT team has decided to require a chi-square improvement of more than 6 for each extra dof.
Time averaged spectrum fit using the average DRM
Power-law model

Time interval is from   -0.284 sec. to    4.112 sec.

Spectral model in power-law:
------------------------------------------------------------
Parameters  : value       lower 90%   higher 90%
Photon index: 2.27155     ( -0.17886   0.18958 )
Norm@50keV  : 4.74712E-03    ( -0.000611198   0.000600598 )
------------------------------------------------------------
#Fit statistic : Chi-Squared =          41.56 using 59 PHA bins.
# Reduced chi-squared =         0.7291 for     57 degrees of freedom
# Null hypothesis probability =   9.380525e-01

Photon flux (15-150 keV)    in 4.396 sec: 0.816675 ( -0.0718796  0.0718988 ) ph/cm2/s
Energy fluence (15-150 keV)             : 1.98413e-07 ( -2.09703e-08  2.14527e-08 ) ergs/cm2
Cutoff power-law model

Time interval is from   -0.284 sec. to    4.112 sec.
Spectral model in the cutoff power-law:
------------------------------------------------------------
Parameters  : value       lower 90%   higher 90%
Photon index: 1.79504     ( -0.910734   0.202921 )
Epeak [keV] : 16.4648      (   )
Norm@50keV  : 9.24380E-03    (     )
------------------------------------------------------------
#Fit statistic : Chi-Squared =          40.35 using 59 PHA bins.
# Reduced chi-squared =         0.7206 for     56 degrees of freedom
# Null hypothesis probability =   9.429020e-01

Photon flux (15-150 keV)    in 4.396 sec: 0.800654 ( -0.075371  0.075705 ) ph/cm2/s
Energy fluence (15-150 keV)             : 1.87919e-07 ( -2.48273e-08  2.66173e-08 ) ergs/cm2
Band function
Time interval is from   -0.284 sec. to    4.112 sec.

Spectral model in the Band function:
------------------------------------------------------------
Parameters  : value       lower 90%   higher 90%
alpha       : -1.80295   ( -3.59547   1.86736 )
beta        : -10.0000    ( 10   0 )
Epeak [keV] : 16.2556      ( -8.2685 10.8854 )
Norm@50keV   : 9.10200E-03    ( -0.00315774   0.0245023 )
------------------------------------------------------------
#Fit statistic : Chi-Squared =          40.35 using 59 PHA bins.
# Reduced chi-squared =         0.7337 for     55 degrees of freedom
# Null hypothesis probability =   9.304241e-01

Photon flux (15-150 keV)    in 4.396 sec:  (    ) ph/cm2/s
Energy fluence (15-150 keV)             : 0 ( 0  0 ) ergs/cm2
Single BB

Spectral model blackbody:
------------------------------------------------------------
Parameters  : value    Lower 90%  Upper 90%
kT [keV]    : 8.23430  (-0.814929  0.909936)
R^2/D10^2   : 0.776673  (-0.269448   0.412575)
(R is the radius in km and D10 is the distance to the source in units of 10 kpc)
------------------------------------------------------------
#Fit statistic : Chi-Squared =          62.18 using 59 PHA bins.
# Reduced chi-squared =          1.091 for     57 degrees of freedom
# Null hypothesis probability =   2.968865e-01

Energy  Fluence     90% Error
[keV]   [erg/cm2]   [erg/cm2]
15- 25  4.273e-08   5.535e-09
25- 50  7.859e-08   9.078e-09
50-150  2.267e-08   6.456e-09
15-150  1.440e-07   1.681e-08
Thermal bremsstrahlung (OTTB)
Spectral model: thermal bremsstrahlung
------------------------------------------------------------
Parameters  : value         Lower 90%    Upper 90%
kT [keV]    : 42.8416       (-9.16094      13.2962)
Norm        : 5.00667       (-0.831542     1.03688)
------------------------------------------------------------
#Fit statistic : Chi-Squared =          41.14 using 59 PHA bins.
# Reduced chi-squared =         0.7218 for     57 degrees of freedom
# Null hypothesis probability =   9.437134e-01

Energy  Fluence     90% Error
[keV]   [erg/cm2]   [erg/cm2]
15- 25  5.166e-08   6.132e-09
25- 50  6.995e-08   7.517e-09
50-150  5.824e-08   1.543e-08
15-150  1.798e-07   2.016e-08
Double BB
Spectral model: bbodyrad<1> + bbodyrad<2>
------------------------------------------------------------
Parameters  : value         Lower 90%    Upper 90%
kT1 [keV]   : 5.12509        (-1.75564      1.66571)
R1^2/D10^2  : 3.79153        (-2.36318      16.6977)
kT2 [keV]   : 15.7451        (-4.89124      12.8321)
R2^2/D10^2  : 3.76684E-02    (-0.0338088   0.11648)
------------------------------------------------------------
#Fit statistic : Chi-Squared =          41.96 using 59 PHA bins.
# Reduced chi-squared =         0.7629 for     55 degrees of freedom
# Null hypothesis probability =   9.020140e-01

Energy  Fluence     90% Error
[keV]   [erg/cm2]   [erg/cm2]
15- 25  5.322e-08   1.967e-08
25- 50  6.636e-08   2.722e-08
50-150  6.229e-08   3.479e-08
15-150  1.819e-07   8.368e-08
Peak spectrum fit
Power-law model

Time interval is from   -0.108 sec. to    0.892 sec.

Spectral model in power-law:
------------------------------------------------------------
Parameters  : value       lower 90%   higher 90%
Photon index: 2.14877     ( -0.213611   0.229351 )
Norm@50keV  : 8.29201E-03    ( -0.00130349   0.00127251 )
------------------------------------------------------------
#Fit statistic : Chi-Squared =          57.40 using 59 PHA bins.
# Reduced chi-squared =          1.007 for     57 degrees of freedom
# Null hypothesis probability =   4.602142e-01

Photon flux (15-150 keV)    in 1 sec: 1.33685 ( -0.151211  0.151227 ) ph/cm2/s
Energy fluence (15-150 keV)             : 7.74468e-08 ( -1.05988e-08  1.08731e-08 ) ergs/cm2
Cutoff power-law model
Time interval is from   -0.108 sec. to    0.892 sec.
Spectral model in the cutoff power-law:
------------------------------------------------------------
Parameters  : value       lower 90%   higher 90%
Photon index: 1.47742     ( -1.01694   0.726169 )
Epeak [keV] : 31.4450      (   )
Norm@50keV  : 2.06559E-02    (     )
------------------------------------------------------------
#Fit statistic : Chi-Squared =          55.53 using 59 PHA bins.
# Reduced chi-squared =         0.9917 for     56 degrees of freedom
# Null hypothesis probability =   4.924833e-01

Photon flux (15-150 keV)    in 1 sec: 1.30755 ( -0.15482  0.15507 ) ph/cm2/s
Energy fluence (15-150 keV)             : 7.28211e-08 ( -1.11699e-08  1.20889e-08 ) ergs/cm2
Band function

Time interval is from   -0.108 sec. to    0.892 sec.

Spectral model in the Band function:
------------------------------------------------------------
Parameters  : value       lower 90%   higher 90%
alpha       : -1.47764   ( 1.59192   6.38323 )
beta        : -10.0000    ( 10   2.84217e-14 )
Epeak [keV] : 31.4371      ( -15.0011 21.677 )
Norm@50keV   : 2.06461E-02    ( -0.0116883   0.061828 )
------------------------------------------------------------
#Fit statistic : Chi-Squared =          55.53 using 59 PHA bins.
# Reduced chi-squared =          1.010 for     55 degrees of freedom
# Null hypothesis probability =   4.545256e-01

Photon flux (15-150 keV)    in 1 sec: 1.31340 ( 5.6866  -0.16163 ) ph/cm2/s
Energy fluence (15-150 keV)             : 0 ( 0  0 ) ergs/cm2
Single BB
Spectral model blackbody:
------------------------------------------------------------
Parameters  : value    Lower 90%  Upper 90%
kT [keV]    : 9.35029  (-1.23352  1.41688)
R^2/D10^2   : 0.791125  (-0.336128   0.589753)
(R is the radius in km and D10 is the distance to the source in units of 10 kpc)
------------------------------------------------------------
#Fit statistic : Chi-Squared =          71.68 using 59 PHA bins.
# Reduced chi-squared =          1.258 for     57 degrees of freedom
# Null hypothesis probability =   9.126425e-02

Energy  Fluence     90% Error
[keV]   [erg/cm2]   [erg/cm2]
15- 25  1.372e-08   2.982e-09
25- 50  3.092e-08   4.555e-09
50-150  1.324e-08   3.813e-09
15-150  5.788e-08   8.475e-09
Thermal bremsstrahlung (OTTB)

Spectral model: thermal bremsstrahlung
------------------------------------------------------------
Parameters  : value         Lower 90%    Upper 90%
kT [keV]    : 52.2775       (-14.0021      22.6036)
Norm        : 7.41075       (-1.33094     1.75017)
------------------------------------------------------------
#Fit statistic : Chi-Squared =          55.65 using 59 PHA bins.
# Reduced chi-squared =         0.9764 for     57 degrees of freedom
# Null hypothesis probability =   5.257394e-01

Energy  Fluence     90% Error
[keV]   [erg/cm2]   [erg/cm2]
15- 25  1.830e-08   2.785e-09
25- 50  2.669e-08   3.585e-09
50-150  2.701e-08   8.530e-09
15-150  7.200e-08   1.206e-08
Double BB

Spectral model: bbodyrad<1> + bbodyrad<2>
------------------------------------------------------------
Parameters  : value         Lower 90%    Upper 90%
kT1 [keV]   : 3.99434        (-1.40456      1.75931)
R1^2/D10^2  : 15.1318        (-11.6873      39.2935)
kT2 [keV]   : 13.9173        (-2.90764      4.73091)
R2^2/D10^2  : 0.133613    (-0.0962467   0.142221)
------------------------------------------------------------
#Fit statistic : Chi-Squared =          54.23 using 59 PHA bins.
# Reduced chi-squared =         0.9859 for     55 degrees of freedom
# Null hypothesis probability =   5.041811e-01

Energy  Fluence     90% Error
[keV]   [erg/cm2]   [erg/cm2]
15- 25  1.914e-08   9.754e-09
25- 50  2.514e-08   1.033e-08
50-150  2.577e-08   1.486e-08
15-150  7.005e-08   3.299e-08
Pre-slew spectrum (Pre-slew PHA with pre-slew DRM)
Power-law model

Spectral model in power-law:
------------------------------------------------------------
Parameters  : value       lower 90%   higher 90%
Photon index: 2.27155     ( -0.17886   0.18958 )
Norm@50keV  : 4.74712E-03    ( -0.000611198   0.000600598 )
------------------------------------------------------------
#Fit statistic : Chi-Squared =          41.56 using 59 PHA bins.
# Reduced chi-squared =         0.7291 for     57 degrees of freedom
# Null hypothesis probability =   9.380525e-01

Photon flux (15-150 keV)    in 4.396 sec: 0.816675 ( -0.0718796  0.0718988 ) ph/cm2/s
Energy fluence (15-150 keV)             : 1.98413e-07 ( -2.09703e-08  2.14527e-08 ) ergs/cm2
Cutoff power-law model

Spectral model in the cutoff power-law:
------------------------------------------------------------
Parameters  : value       lower 90%   higher 90%
Photon index: 1.79504     ( -0.910734   0.202921 )
Epeak [keV] : 16.4648      (   )
Norm@50keV  : 9.24380E-03    (     )
------------------------------------------------------------
#Fit statistic : Chi-Squared =          40.35 using 59 PHA bins.
# Reduced chi-squared =         0.7206 for     56 degrees of freedom
# Null hypothesis probability =   9.429020e-01

Photon flux (15-150 keV)    in 4.396 sec: 0.800654 ( -0.075373  0.075705 ) ph/cm2/s
Energy fluence (15-150 keV)             : 1.87919e-07 ( -2.48273e-08  2.66173e-08 ) ergs/cm2
Band function

Spectral model in the Band function:
------------------------------------------------------------
Parameters  : value       lower 90%   higher 90%
alpha       : -1.80295   ( -3.59547   1.86736 )
beta        : -10.0000    ( 10   5.32907e-15 )
Epeak [keV] : 16.2556      ( -8.26851 10.8854 )
Norm@50keV   : 9.10200E-03    ( -0.00315774   0.0245023 )
------------------------------------------------------------
#Fit statistic : Chi-Squared =          40.35 using 59 PHA bins.
# Reduced chi-squared =         0.7337 for     55 degrees of freedom
# Null hypothesis probability =   9.304241e-01

Photon flux (15-150 keV)    in 4.396 sec:  (    ) ph/cm2/s
Energy fluence (15-150 keV)             : 0 ( 0  0 ) ergs/cm2
S(25-50 keV) vs. S(50-100 keV) plot
S(25-50 keV)  = 6.37e-08
S(50-100 keV) = 5.28e-08
T90 vs. Hardness ratio plot
T90                                   = 3.83599996566772 sec.
Hardness ratio (energy fluence ratio) = 0.828885
Color vs. Color plot
Count Ratio  (25-50 keV) / (15-25 keV) = 0.95743
Count Ratio (50-100 keV) / (15-25 keV) = 0.386844
Mask shadow pattern

IMX = 3.065326062637548E-02, IMY = -2.553761083342893E-01
TIME vs. PHA plot around the trigger time
Blue+Cyan dotted lines: Time interval of the scaled map
From 0.000000 to 0.512000
TIME vs. DetID plot around the trigger time

Blue+Cyan dotted lines: Time interval of the scaled map
From 0.000000 to 0.512000
100 us light curve (15-350 keV)
Blue+Cyan dotted lines: Time interval of the scaled map
From 0.000000 to 0.512000
Spacecraft aspect plot

Bright source in the pre-burst/pre-slew/post-slew images
Pre-burst image of 15-350 keV band
Time interval of the image:
-239.592000 -0.284000

# RAcent  DECcent POSerr Theta    Phi  PeakCts   SNR AngSep     Name
#  [deg]    [deg]    ['] [deg]  [deg]                   [']
135.5303 -40.5448    0.4  25.6   27.3   4.9623  25.7    0.6	Vela X-1
169.9938 -60.7647    0.0   3.8 -172.9   0.2377   1.5   12.7	Cen X-3
186.6229 -62.7737    0.5  11.8 -165.1   4.0610  22.3    1.0	GX 301-2
264.7129 -44.3330    5.6  58.1 -155.1   3.0020   2.1    7.1	4U 1735-44
114.7716 -21.3307    2.3  51.0   17.9   2.8542   5.0 ------	UNKNOWN
237.6996 -33.6275    3.1  54.1  177.0   2.2608   3.7 ------	UNKNOWN
255.7179 -48.7995    1.5  50.8 -157.7   3.7419   7.5 ------	UNKNOWN
295.3648 -71.6873    2.6  44.4 -118.8   3.7741   4.5 ------	UNKNOWN
Pre-slew background subtracted image of 15-350 keV band
Time interval of the image:
-0.284000 4.112000

# RAcent  DECcent POSerr Theta    Phi  PeakCts   SNR AngSep     Name
#  [deg]    [deg]    ['] [deg]  [deg]                   [']
135.5107 -40.6540    3.6  25.5   27.2  -0.0789  -3.2    6.0	Vela X-1
169.9938 -60.7647    0.0   3.8 -172.9  -0.0414  -2.1   12.7	Cen X-3
186.9093 -62.5972  125.8  12.0 -166.0   0.0017   0.1   12.5	GX 301-2
264.8621 -44.5968    5.9  57.9 -154.8  -0.2478  -2.0   10.2	4U 1735-44
163.5003 -45.4619    0.6  14.4   83.2   0.4223  19.3 ------	UNKNOWN
Post-slew image of 15-350 keV band
Time interval of the image:
48.308590 962.468000

# RAcent  DECcent POSerr Theta    Phi  PeakCts   SNR AngSep     Name
#  [deg]    [deg]    ['] [deg]  [deg]                   [']
135.5315 -40.5493    0.3  20.9  -12.9  20.0855  39.4    0.4	Vela X-1
170.2958 -60.6269   88.7  15.7 -119.1   0.0683   0.1    0.6	Cen X-3
186.6527 -62.7656    0.3  21.7 -135.7  18.9176  40.8    0.3	GX 301-2
153.8941 -34.0704    2.9  13.6   37.4   1.7937   3.9 ------	UNKNOWN
217.2620 -55.0724    2.7  34.7 -160.8   2.4512   4.3 ------	UNKNOWN
 90.8343 -60.9157    5.4  43.5  -64.2   6.4081   2.1 ------	UNKNOWN
 89.4517 -52.3189    5.1  47.0  -53.1   6.0110   2.3 ------	UNKNOWN
 99.4057 -79.8399    3.3  40.9  -92.6   9.7591   3.5 ------	UNKNOWN
Plot creation:
Sun May 31 01:59:37 EDT 2015