Click here for the BAT GCN circular template
Image
Pre-slew 15-350 keV image (Event data; bkg subtracted)
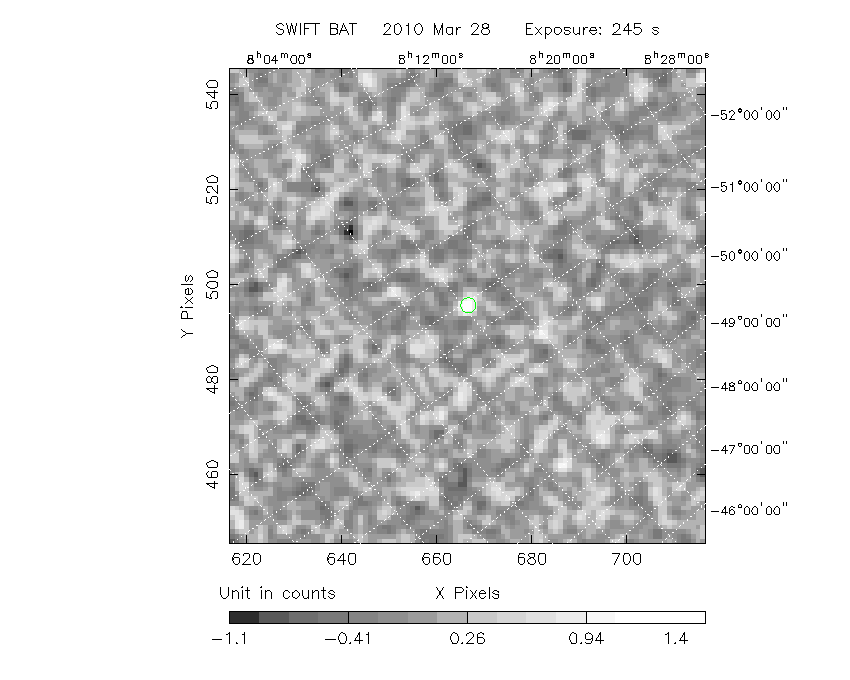
#   RAcent  DECcent POSerr  Theta    Phi     Peak Cts     SNR  Name
  130.1190 -45.0990 0.0291   24.2   -5.1       1.8905     6.6  TRIG_00417420
------------------------------------------

Foreground time interval of the image:
-116.824 128.616 (delta_t = 245.440 [sec])
Background time interval of the image:
-239.000 -116.824 (delta_t = 122.176 [sec])
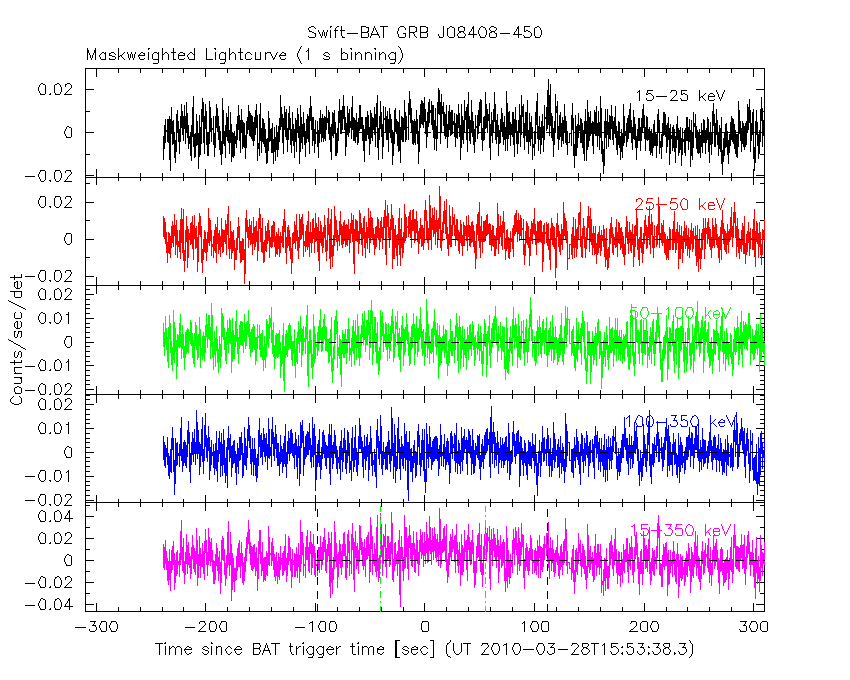
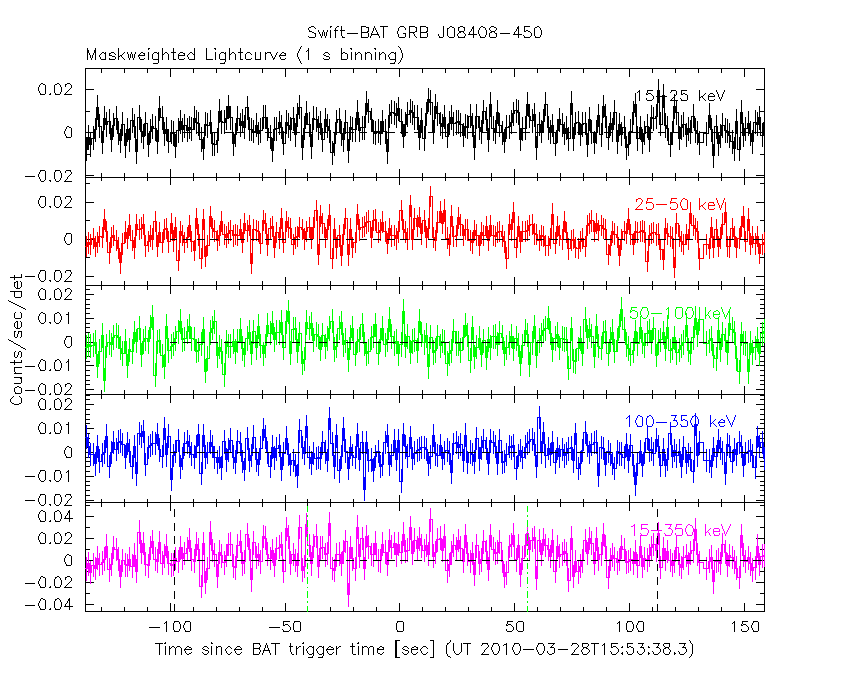
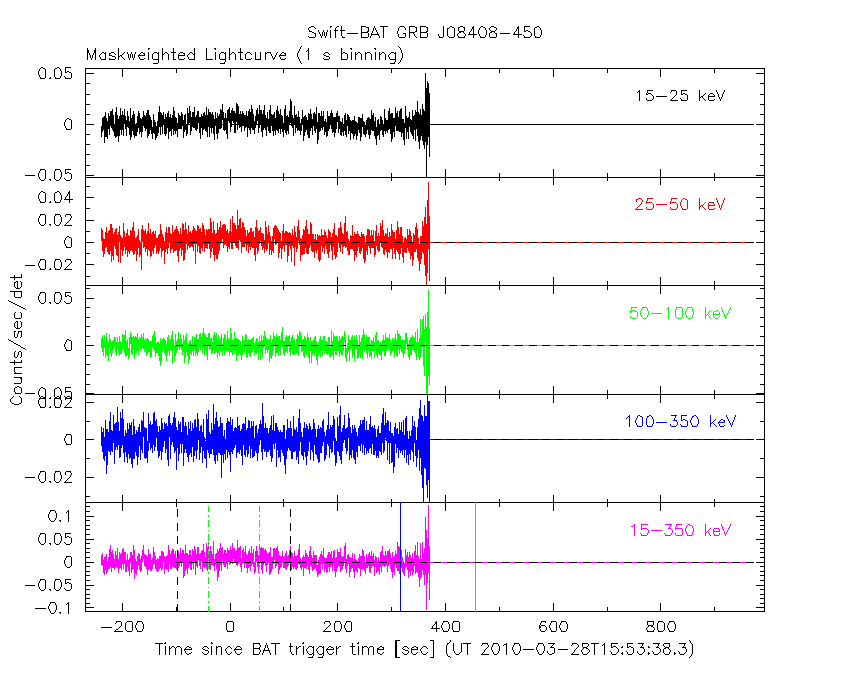
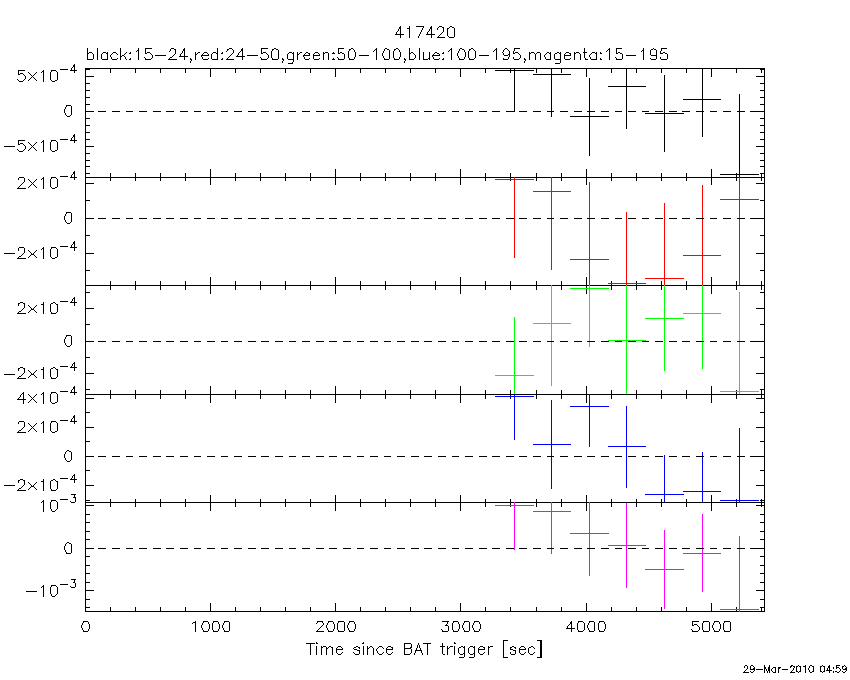
Lightcurves
Notes:
- 1) All plots contain as much data as has been downloaded to date.
- 2) Multiple plots of different time binning/intervals are shown to cover all scenarios of short/long GRBs, rate/image triggers, and real/false positives.
- 3) For all the mask-weighted lightcurves, the y-axis units are counts/sec/det where a det is 0.4 x 0.4 = 0.16 sq cm.
- 4) The verticle lines correspond to following: green dotted lines are T50 interval, black dotted lines are T90 interval, blue solid line(s) is a spacecraft slew start time, and orange solid line(s) is a spacecraft slew end time.
- 5) Time of each bin is in the middle of the bin.
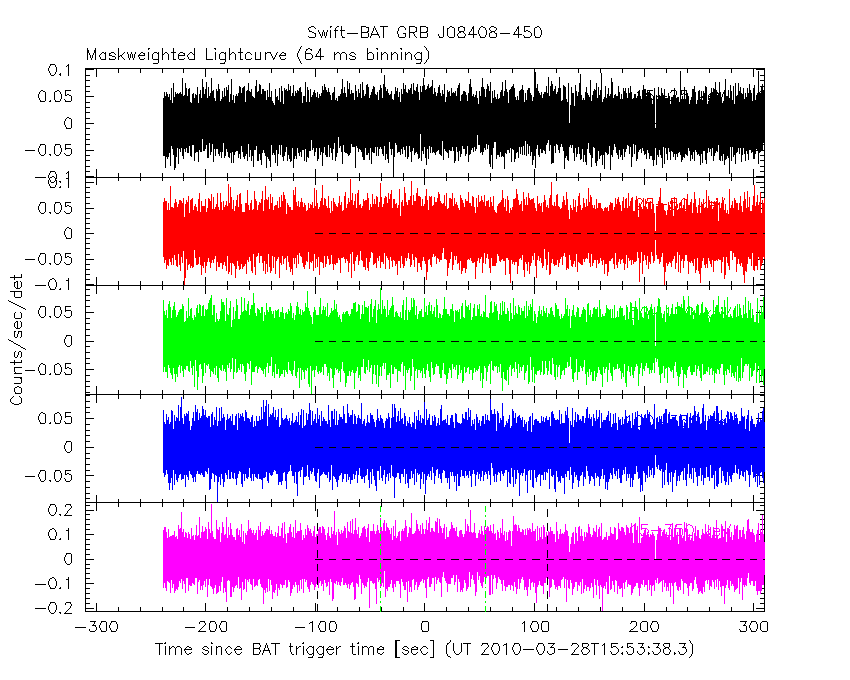
1 s binning
From T0-310 s to T0+310 s
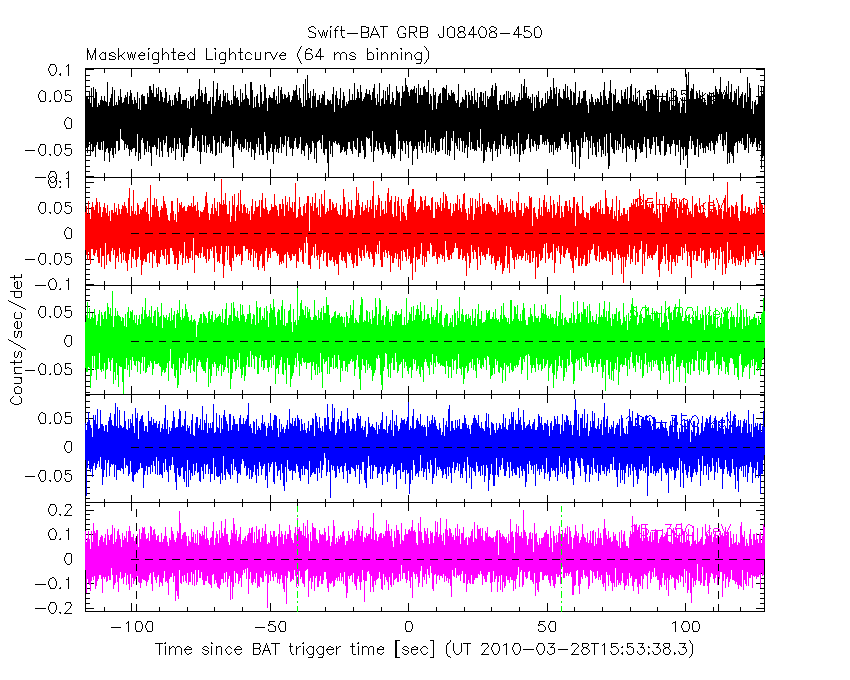
From T100_start - 20 s to T100_end + 30 s
Full time interval
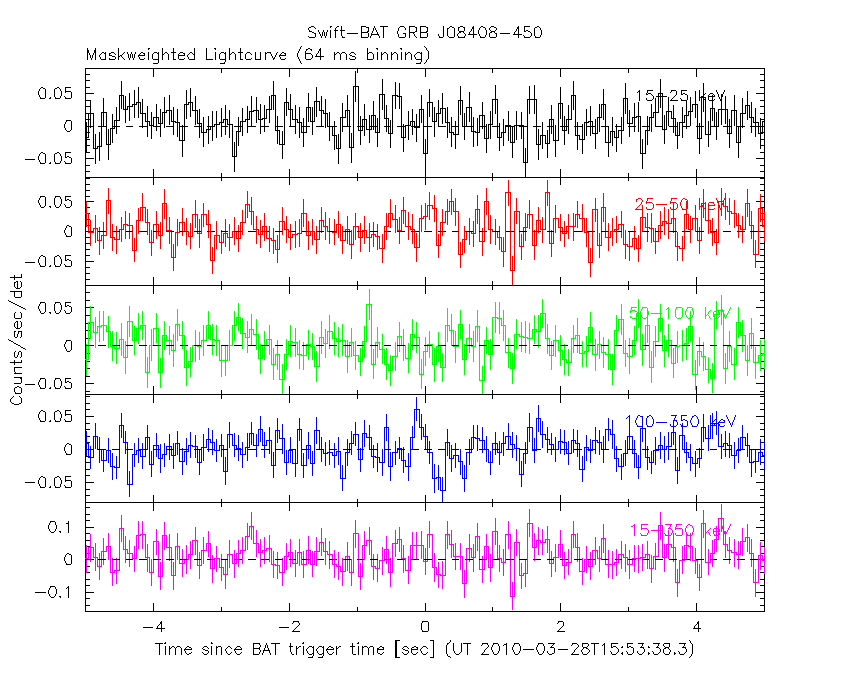
64 ms binning
Full time interval
From T100_start to T100_end
From T0-5 sec to T0+5 sec
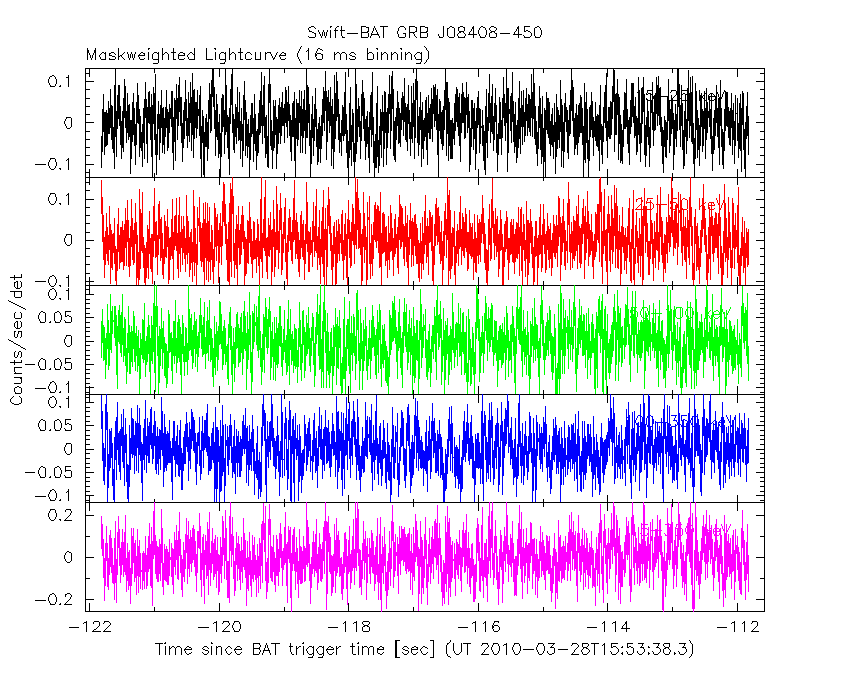
16 ms binning
From T100_start-5 s to T100_start+5 s
Blue+Cyan dotted lines: Time interval of the scaled map
From 0.000000 to 64.000000
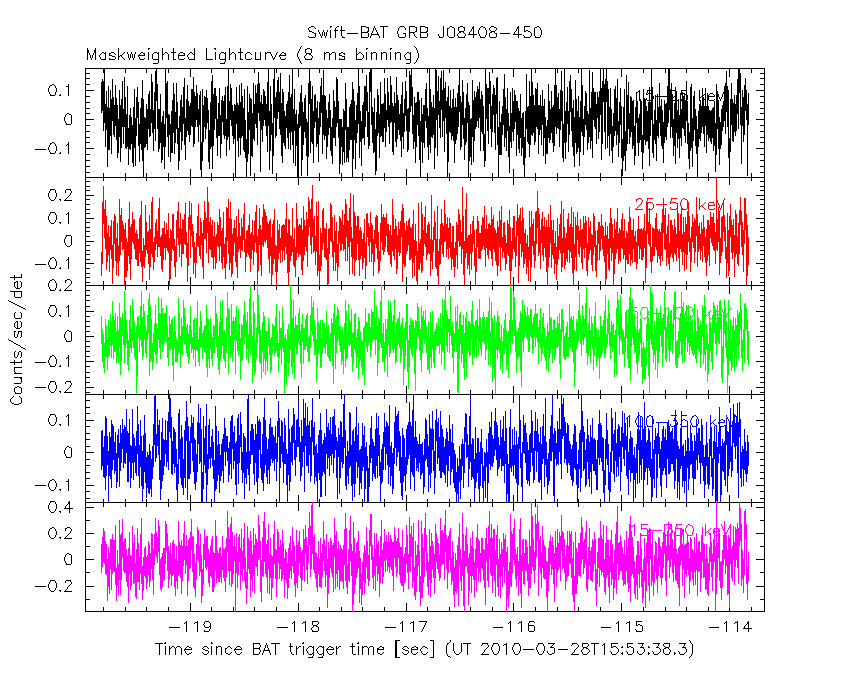
8 ms binning
From T100_start-3 s to T100_start+3 s
Blue+Cyan dotted lines: Time interval of the scaled map
From 0.000000 to 64.000000
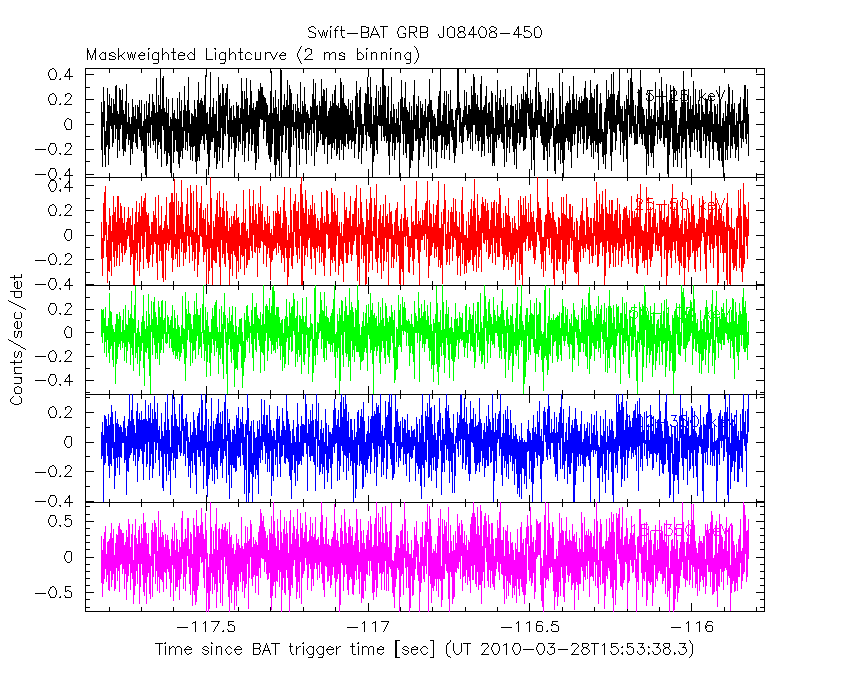
2 ms binning
From T100_start-1 s to T100_start+1 s
Blue+Cyan dotted lines: Time interval of the scaled map
From 0.000000 to 64.000000
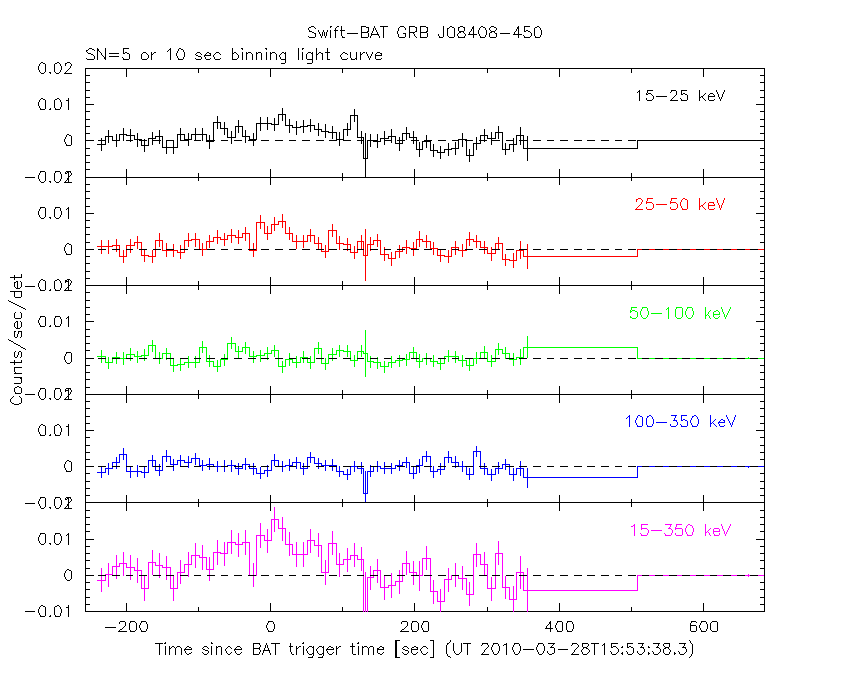
SN=5 or 10 sec. binning (whichever binning is satisfied first)
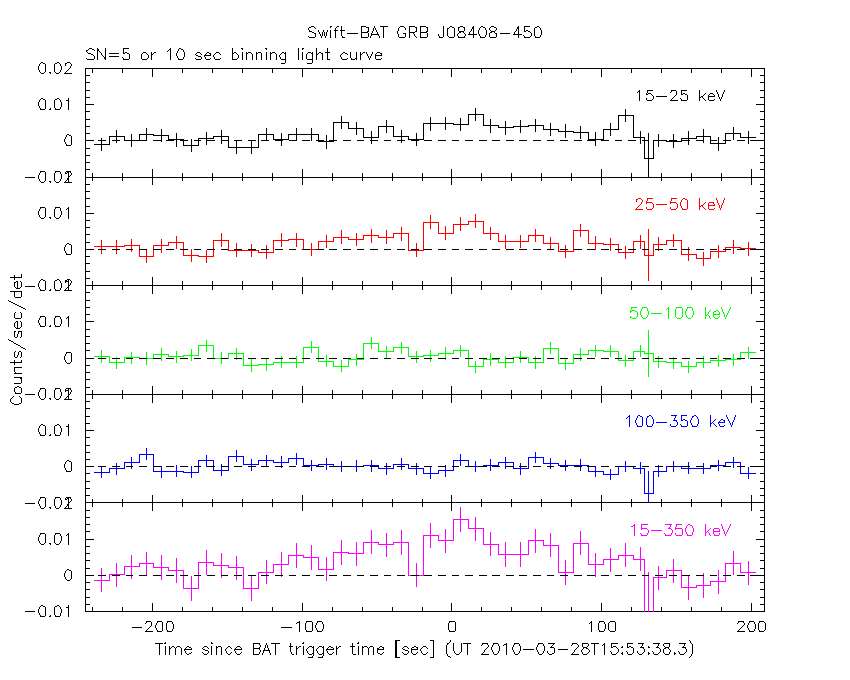
SN=5 or 10 sec. binning (T < 200 sec)
The mask-weighted light curves based on cleaned DPHs
Spectra
Notes:
- 1) The fitting includes the systematic errors.
- 2) For long bursts, a spectral fit of the pre-slew DRM will introduce some errors in both a spectral shape and a normalization if the PHA file contains a lot of the slew/post-slew time interval.
- 3) For fits to more complicated models (e.g. a power-law over a cutoff power-law), the BAT team has decided to require a chi-square improvement of more than 6 for each extra dof.
- 4) For short bursts (T90<1sec), the specrtum is also fit with Blackbody, OTTB, and Double Blackbody.
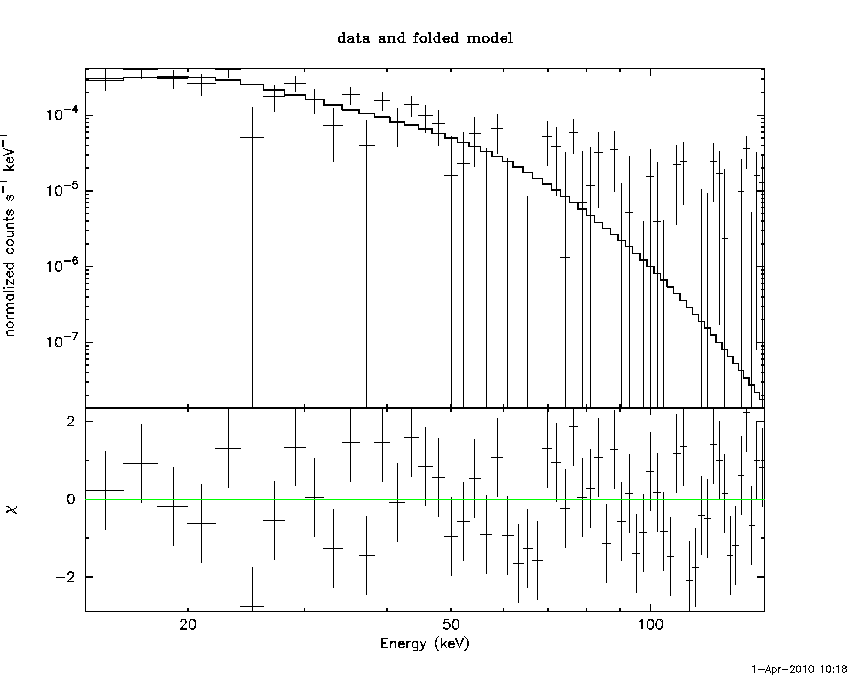
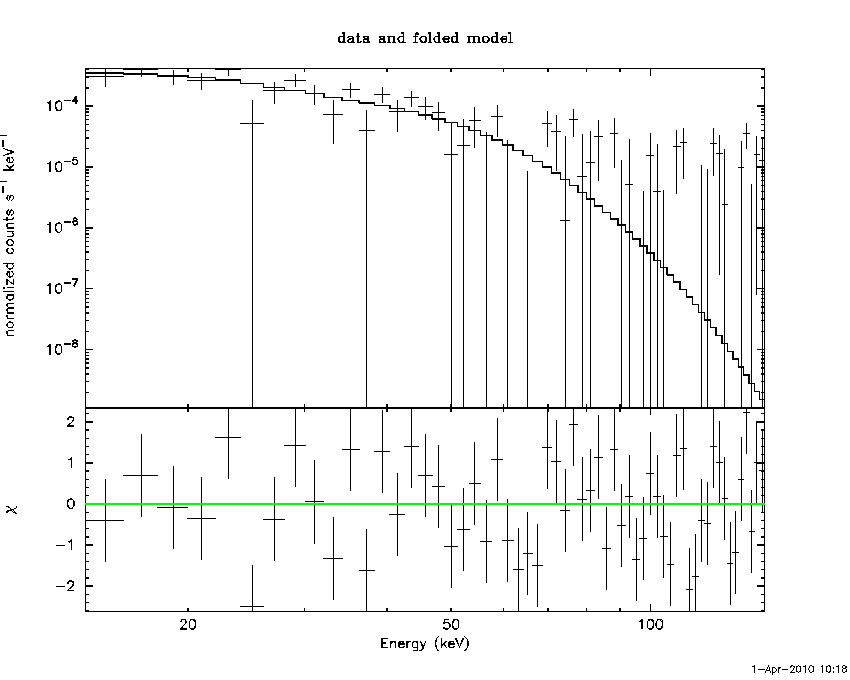
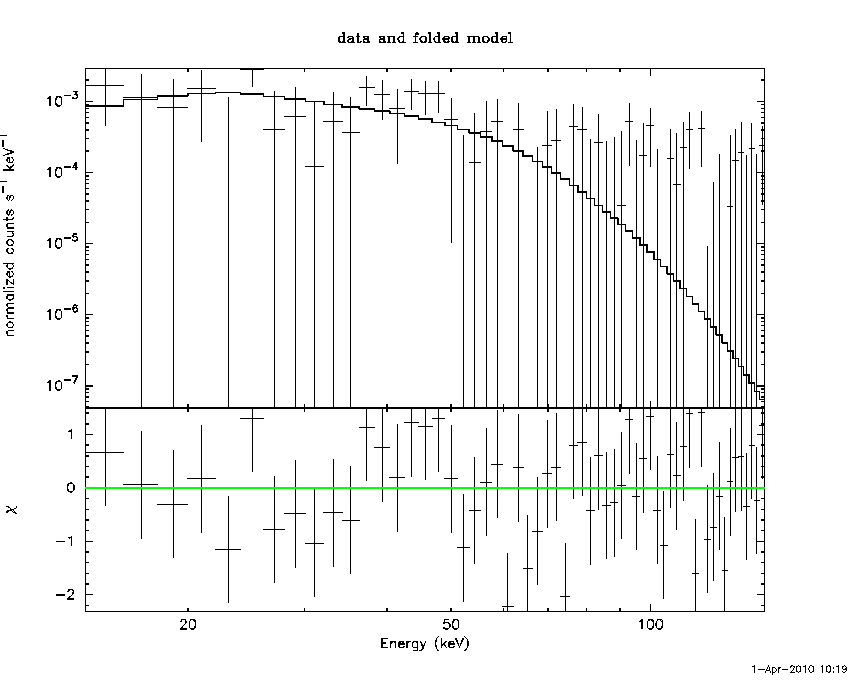
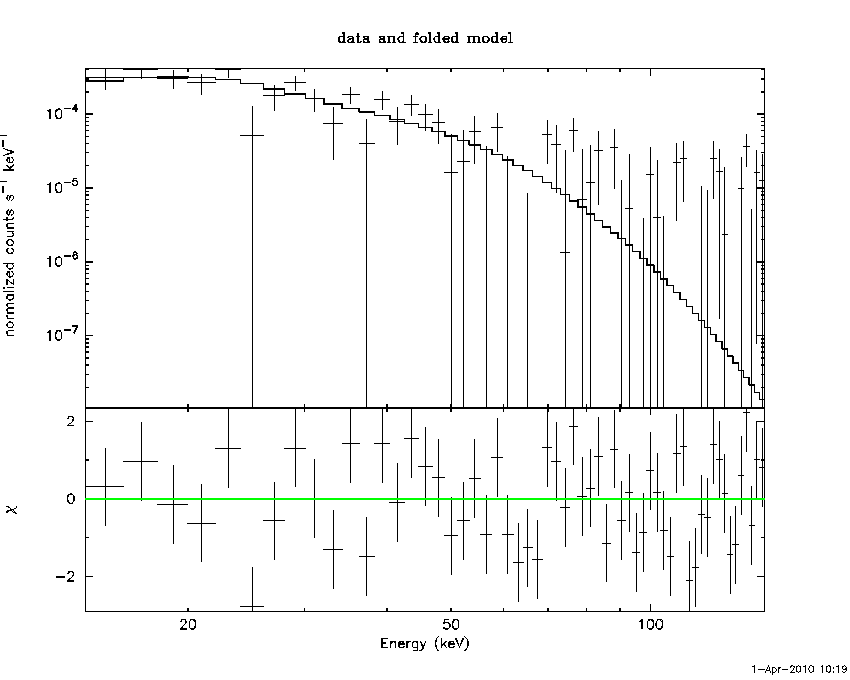
Time averaged spectrum fit using the pre-slew DRM
Power-law model

Time interval is from -116.824 sec. to  128.616 sec.

Spectral model in power-law:
------------------------------------------------------------
Parameters  : value       lower 90%   higher 90%
Photon index: 2.39971     ( -0.272363   0.304536 )
Norm@50keV  : 3.36402E-04    ( -7.62637e-05   7.61823e-05 )
------------------------------------------------------------
# Chi-Squared =          82.93 using 59 PHA bins.
# Reduced chi-squared =          1.455 for     57 degrees of freedom
# Null hypothesis probability =   1.407506e-02

Photon flux (15-150 keV)    in 245.4 sec: 6.22316E-02 ( -0.00860166  0.00860689 ) ph/cm2/s
Energy fluence (15-150 keV)             : 8.05221e-07 ( -1.41236e-07  1.48442e-07 ) ergs/cm2
Cutoff power-law model

Time interval is from -116.824 sec. to  128.616 sec.
Spectral model in the cutoff power-law:
------------------------------------------------------------
Parameters  : value       lower 90%   higher 90%
Photon index: 8.58670E-02     ( -2.86545   1.02902 )
Epeak [keV] : 28.5625      ( -21.0419 9.33217 )
Norm@50keV  : 1.03357E-02    (     )
------------------------------------------------------------
# Chi-Squared =          77.09 using 59 PHA bins.
# Reduced chi-squared =          1.377 for     56 degrees of freedom
# Null hypothesis probability =   3.234279e-02

Photon flux (15-150 keV)    in 245.4 sec: 5.98245E-02 ( -0.0084604  0.0085293 ) ph/cm2/s
Energy fluence (15-150 keV)             : 0 ( 0  0 ) ergs/cm2
Band function
Time interval is from -116.824 sec. to  128.616 sec.

Spectral model in the Band function:
------------------------------------------------------------
Parameters  : value       lower 90%   higher 90%
alpha       : -0.140361   ( -1.35241   1.81195 )
beta        : -9.99984    ( 19589.1   19599.1 )
Epeak [keV] : 28.3027      ( -19.4933 6.37447 )
Norm@50keV   : 9.62196E-03    ( -0.00838711   0.164962 )
------------------------------------------------------------
# Chi-Squared =          77.07 using 59 PHA bins.
# Reduced chi-squared =          1.401 for     55 degrees of freedom
# Null hypothesis probability =   2.640007e-02

Photon flux (15-150 keV)    in 245.4 sec:  (    ) ph/cm2/s
Energy fluence (15-150 keV)             : 0 ( 0  0 ) ergs/cm2
Single BB
Spectral model blackbody:
------------------------------------------------------------
Parameters  : value    Lower 90%  Upper 90%
kT [keV]    : 7.83515  (-1.00791  1.12918)
R^2/D10^2   : 7.73228E-02  (-0.0326294   0.057708)
(R is the radius in km and D10 is the distance to the source in units of 10 kpc)
------------------------------------------------------------
# Chi-Squared =          79.27 using 59 PHA bins.
# Reduced chi-squared =          1.391 for     57 degrees of freedom
# Null hypothesis probability =   2.718228e-02

Energy  Fluence     90% Error
[keV]   [erg/cm2]   [erg/cm2]
15- 25  2.073e-07   4.944e-08
25- 50  3.499e-07   7.205e-08
50-150  8.574e-08   3.551e-08
15-150  6.429e-07   1.342e-07
Thermal bremsstrahlung (OTTB)
Spectral model: thermal bremsstrahlung
------------------------------------------------------------
Parameters  : value         Lower 90%    Upper 90%
kT [keV]    : 34.1578       (-9.24676      14.2645)
Norm        : 0.457204       (-0.108108     0.148944)
------------------------------------------------------------
# Chi-Squared =          78.18 using 59 PHA bins.
# Reduced chi-squared =          1.372 for     57 degrees of freedom
# Null hypothesis probability =   3.277903e-02

Energy  Fluence     90% Error
[keV]   [erg/cm2]   [erg/cm2]
15- 25  2.426e-07   4.160e-08
25- 50  2.967e-07   6.382e-08
50-150  1.914e-07   9.039e-08
15-150  7.307e-07   1.541e-07
Double BB
Spectral model: bbodyrad<1> + bbodyrad<2>
------------------------------------------------------------
Parameters  : value         Lower 90%    Upper 90%
kT1 [keV]   : 2.40250        (-1.88457      3.3223)
R1^2/D10^2  : 6.71807        (-6.4823      -6.59149)
kT2 [keV]   : 8.83683        (-1.42246      2.62048)
R2^2/D10^2  : 4.29123E-02    (-0.0326724   0.0504006)
------------------------------------------------------------
# Chi-Squared =          75.34 using 59 PHA bins.
# Reduced chi-squared =          1.370 for     55 degrees of freedom
# Null hypothesis probability =   3.564795e-02

Energy  Fluence     90% Error
[keV]   [erg/cm2]   [erg/cm2]
15- 25  2.259e-07   1.123e-07
25- 50  3.316e-07   1.838e-07
50-150  1.181e-07   6.993e-08
15-150  6.756e-07   3.483e-07
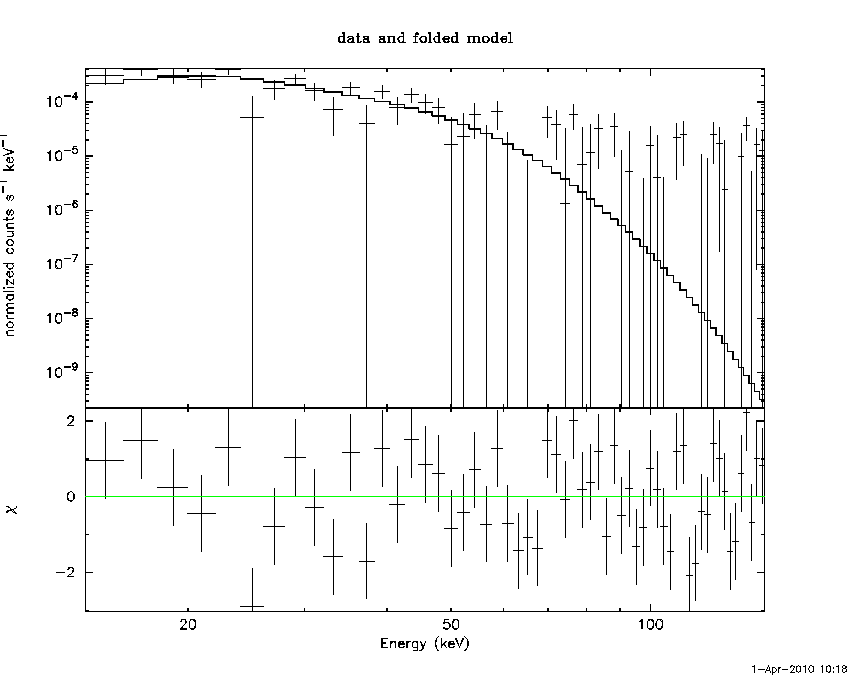
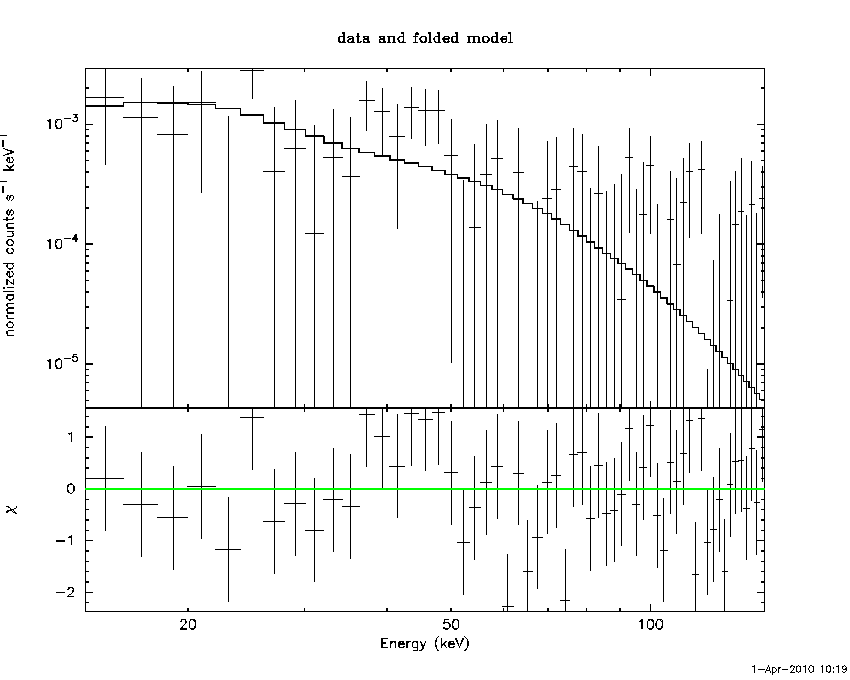
Peak spectrum fit
Power-law model
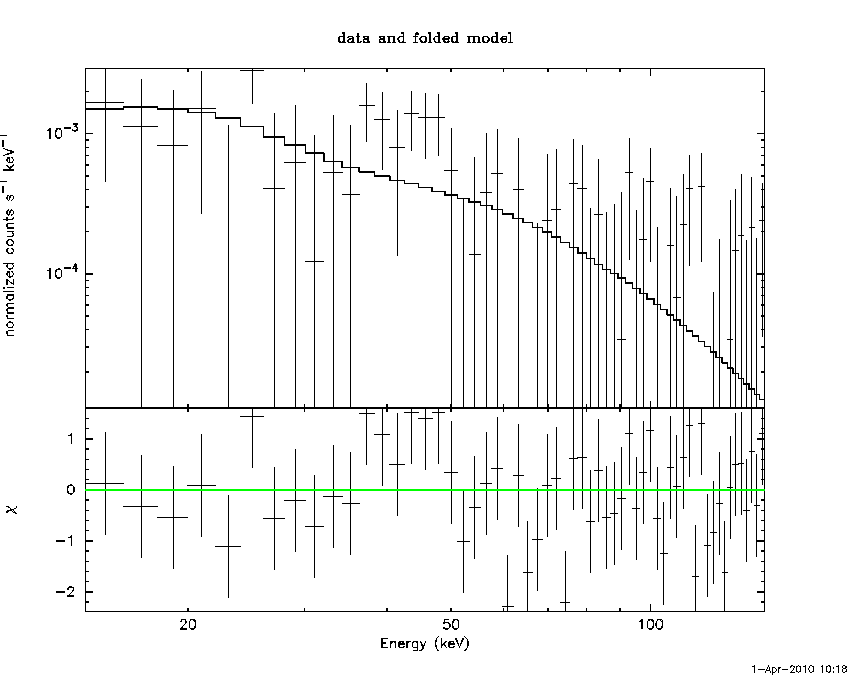
Time interval is from   13.012 sec. to   14.012 sec.

Spectral model in power-law:
------------------------------------------------------------
Parameters  : value       lower 90%   higher 90%
Photon index: 1.85876     ( -0.640047   0.758341 )
Norm@50keV  : 2.40946E-03    ( -0.00116029   0.00110604 )
------------------------------------------------------------
# Chi-Squared =          50.69 using 59 PHA bins.
# Reduced chi-squared =         0.8894 for     57 degrees of freedom
# Null hypothesis probability =   7.091070e-01

Photon flux (15-150 keV)    in 1 sec: 0.339898 ( -0.130047  0.130053 ) ph/cm2/s
Energy fluence (15-150 keV)             : 2.21537e-08 ( -9.92492e-09  1.08264e-08 ) ergs/cm2
Cutoff power-law model
Time interval is from   13.012 sec. to   14.012 sec.
Spectral model in the cutoff power-law:
------------------------------------------------------------
Parameters  : value       lower 90%   higher 90%
Photon index: -4.46107     (     )
Epeak [keV] : 40.3875      ( -8.64111 26.837 )
Norm@50keV  : 10.8372    ( -11.1546   4.1831 )
------------------------------------------------------------
# Chi-Squared =          47.45 using 59 PHA bins.
# Reduced chi-squared =         0.8473 for     56 degrees of freedom
# Null hypothesis probability =   7.850908e-01

Photon flux (15-150 keV)    in 1 sec: 0.311008 ( -0.111231  0.11762 ) ph/cm2/s
Energy fluence (15-150 keV)             : 1.73927e-08 ( -6.4728e-09  8.5236e-09 ) ergs/cm2
Band function
Time interval is from   13.012 sec. to   14.012 sec.

Spectral model in the Band function:
------------------------------------------------------------
Parameters  : value       lower 90%   higher 90%
alpha       : 4.97558   ( -90.19   -80.1905 )
beta        : -5.87716    ( 5.26946   5.03874 )
Epeak [keV] : 40.6630      ( -5.52006 8.75533 )
Norm@50keV   : 19.7895    ( -20.1378   111.526 )
------------------------------------------------------------
# Chi-Squared =          47.31 using 59 PHA bins.
# Reduced chi-squared =         0.8601 for     55 degrees of freedom
# Null hypothesis probability =   7.600539e-01

Photon flux (15-150 keV)    in 1 sec:  (    ) ph/cm2/s
Energy fluence (15-150 keV)             : 0 ( 0  0 ) ergs/cm2
Single BB
Spectral model blackbody:
------------------------------------------------------------
Parameters  : value    Lower 90%  Upper 90%
kT [keV]    : 10.3532  (-2.68205  3.92868)
R^2/D10^2   : 0.157070  (-0.15706   0.322311)
(R is the radius in km and D10 is the distance to the source in units of 10 kpc)
------------------------------------------------------------
# Chi-Squared =          48.10 using 59 PHA bins.
# Reduced chi-squared =         0.8438 for     57 degrees of freedom
# Null hypothesis probability =   7.934599e-01

Energy  Fluence     90% Error
[keV]   [erg/cm2]   [erg/cm2]
15- 25  3.466e-09   2.200e-09
25- 50  9.045e-09   5.725e-09
50-150  5.215e-09   3.819e-09
15-150  1.773e-08   1.155e-08
Thermal bremsstrahlung (OTTB)
Spectral model: thermal bremsstrahlung
------------------------------------------------------------
Parameters  : value         Lower 90%    Upper 90%
kT [keV]    : 71.8313       (-44.7788      -71.7943)
Norm        : 1.69177       (-0.742634     1.33072)
------------------------------------------------------------
# Chi-Squared =          50.00 using 59 PHA bins.
# Reduced chi-squared =         0.8771 for     57 degrees of freedom
# Null hypothesis probability =   7.329388e-01

Energy  Fluence     90% Error
[keV]   [erg/cm2]   [erg/cm2]
15- 25  4.352e-09   2.735e-09
25- 50  6.972e-09   4.477e-09
50-150  9.127e-09   8.030e-09
15-150  2.045e-08   1.441e-08
Double BB
------------------------------------------------------------
Parameters  : value         Lower 90%    Upper 90%
kT1 [keV]   : 0.914490        (-1.24521      12.7459)
R1^2/D10^2  : 4.22533E+05        (      )
kT2 [keV]   : 10.6431        (-2.81567      4.35007)
R2^2/D10^2  : 0.137709    (-0.102286   0.293746)
------------------------------------------------------------
# Chi-Squared =          47.69 using 59 PHA bins.
# Chi-Squared =          47.64 using 59 PHA bins.
# Reduced chi-squared =         0.8670 for     55 degrees of freedom
# Reduced chi-squared =         0.8662 for     55 degrees of freedom
# Null hypothesis probability =   7.474820e-01
# Null hypothesis probability =   7.490630e-01

Energy  Fluence     90% Error
[keV]   [erg/cm2]   [erg/cm2]
15- 25  3.625e-09   2.182e-09
25- 50  8.740e-09   5.640e-09
50-150  5.406e-09   3.980e-09
15-150  1.777e-08   1.120e-08
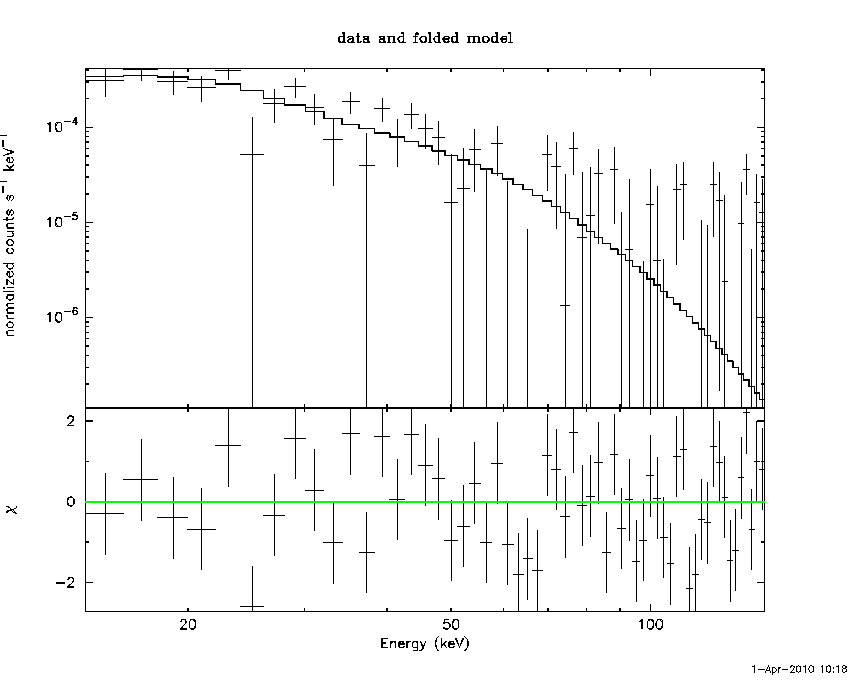
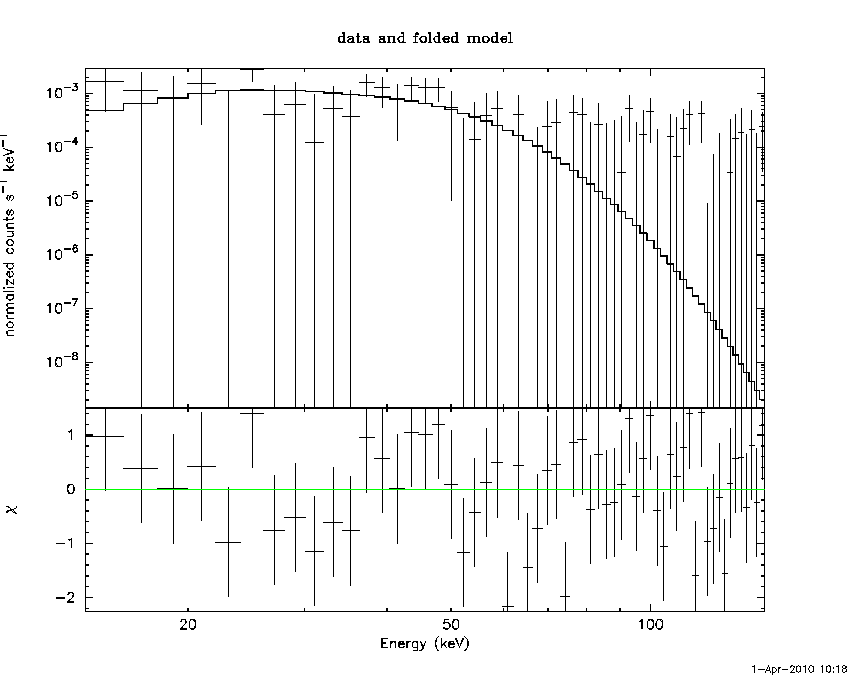
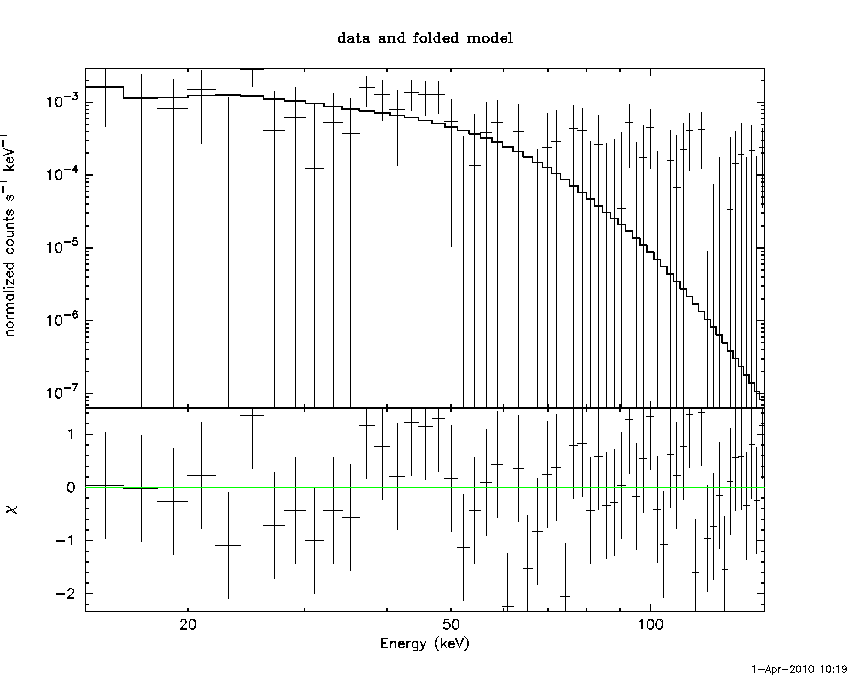
Pre-slew spectrum (Pre-slew PHA with pre-slew DRM)
Power-law model
Spectral model in power-law:
------------------------------------------------------------
Parameters  : value       lower 90%   higher 90%
Photon index: 2.39971     ( -0.272363   0.304536 )
Norm@50keV  : 3.36402E-04    ( -7.62637e-05   7.61823e-05 )
------------------------------------------------------------
# Chi-Squared =          82.93 using 59 PHA bins.
# Reduced chi-squared =          1.455 for     57 degrees of freedom
# Null hypothesis probability =   1.407506e-02

Photon flux (15-150 keV)    in 245.4 sec: 6.22316E-02 ( -0.00860166  0.00860689 ) ph/cm2/s
Energy fluence (15-150 keV)             : 8.05221e-07 ( -1.41236e-07  1.48442e-07 ) ergs/cm2
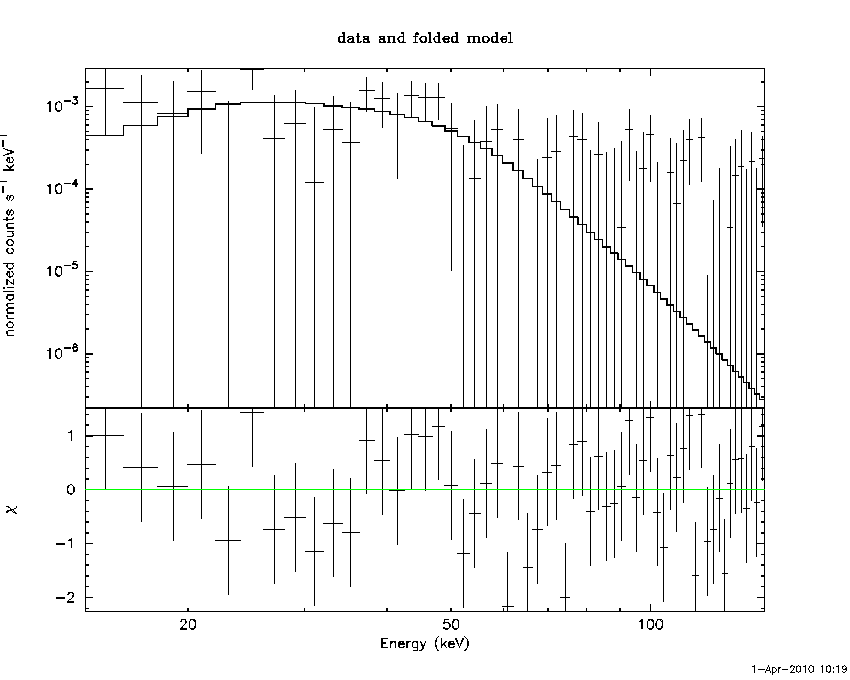
Cutoff power-law model
Spectral model in the cutoff power-law:
------------------------------------------------------------
Parameters  : value       lower 90%   higher 90%
Photon index: 8.58670E-02     ( -2.86545   1.02902 )
Epeak [keV] : 28.5625      ( -21.0419 9.33217 )
Norm@50keV  : 1.03357E-02    (     )
------------------------------------------------------------
# Chi-Squared =          77.09 using 59 PHA bins.
# Reduced chi-squared =          1.377 for     56 degrees of freedom
# Null hypothesis probability =   3.234279e-02

Photon flux (15-150 keV)    in 245.4 sec: 5.98245E-02 ( -0.0084604  0.0085293 ) ph/cm2/s
Energy fluence (15-150 keV)             : 0 ( 0  0 ) ergs/cm2
Band function

Spectral model in the Band function:
------------------------------------------------------------
Parameters  : value       lower 90%   higher 90%
alpha       : -0.140361   ( -1.35241   1.81195 )
beta        : -9.99984    ( 19589.1   19599.1 )
Epeak [keV] : 28.3027      ( -19.4666 6.37447 )
Norm@50keV   : 9.62196E-03    ( -0.00838711   0.164962 )
------------------------------------------------------------
# Chi-Squared =          77.07 using 59 PHA bins.
# Reduced chi-squared =          1.401 for     55 degrees of freedom
# Null hypothesis probability =   2.640007e-02

Photon flux (15-150 keV)    in 245.4 sec:  (    ) ph/cm2/s
Energy fluence (15-150 keV)             : 0 ( 0  0 ) ergs/cm2
S(25-50 keV) vs. S(50-100 keV) plot
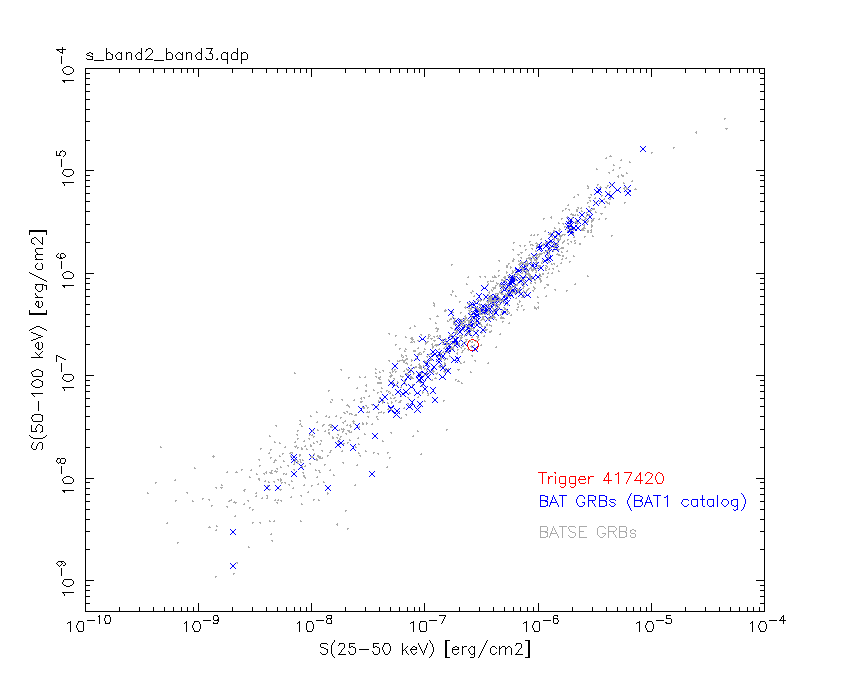
S(25-50 keV)  = 2.64065e-07
S(50-100 keV) = 2.00164e-07
T90 vs. Hardness ratio plot
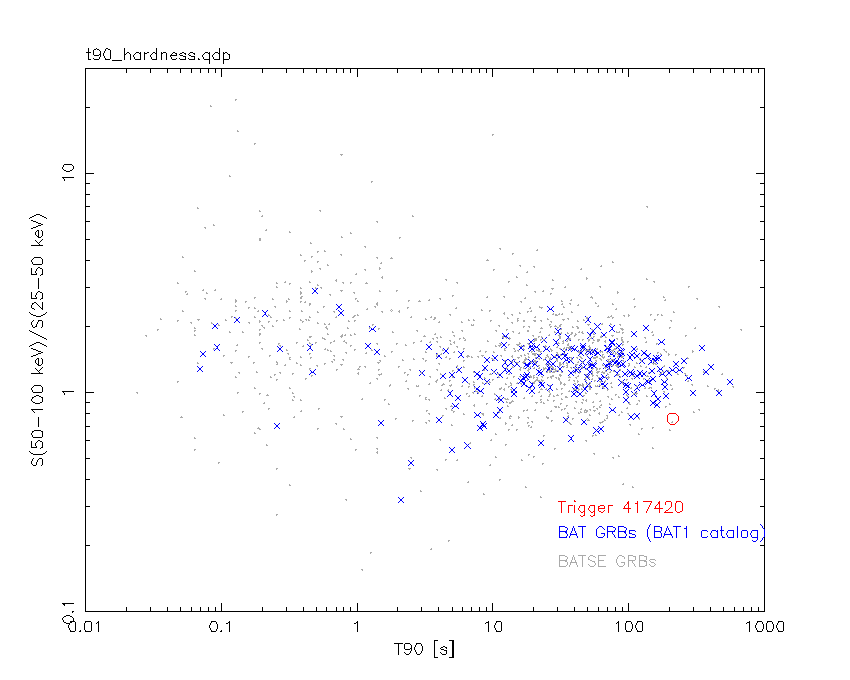
T90                                   = 210.304000020027 sec.
Hardness ratio (energy fluence ratio) = 0.75801
Color vs. Color plot
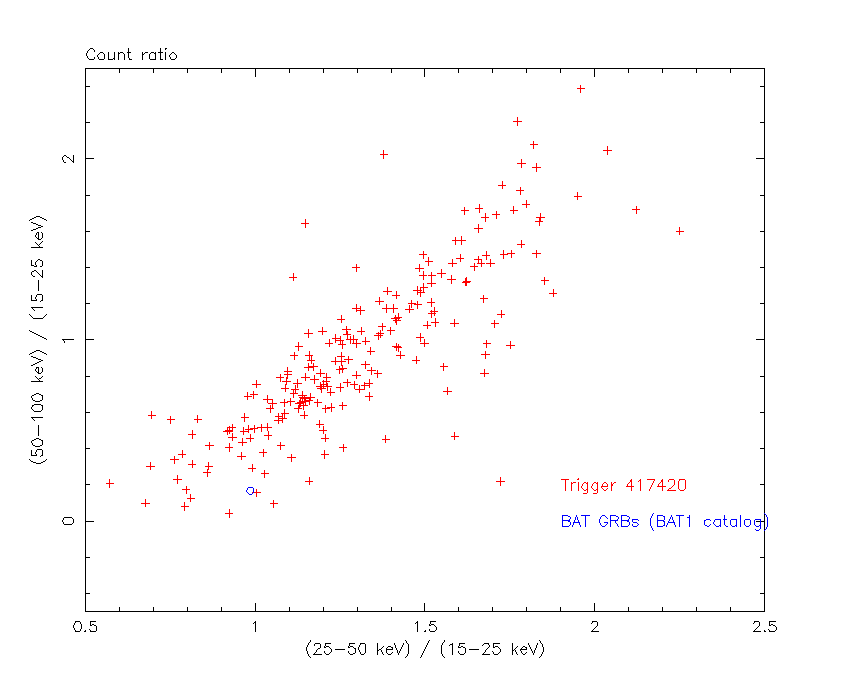
Count Ratio  (25-50 keV) / (15-25 keV) = 0.985352
Count Ratio (50-100 keV) / (15-25 keV) = 0.167552
Mask shadow pattern
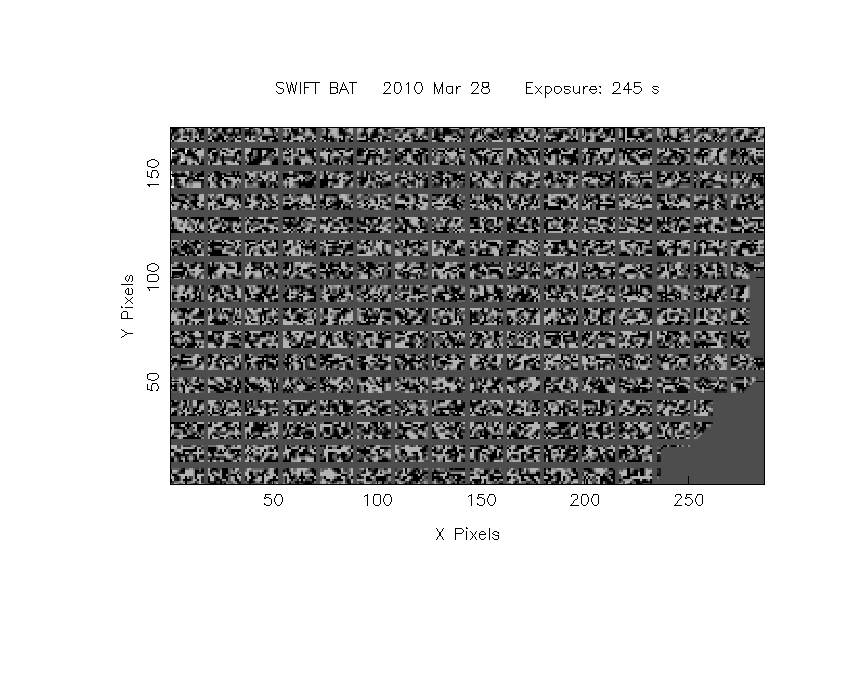
IMX = 0, IMY = 0
TIME vs. PHA plot around the trigger time
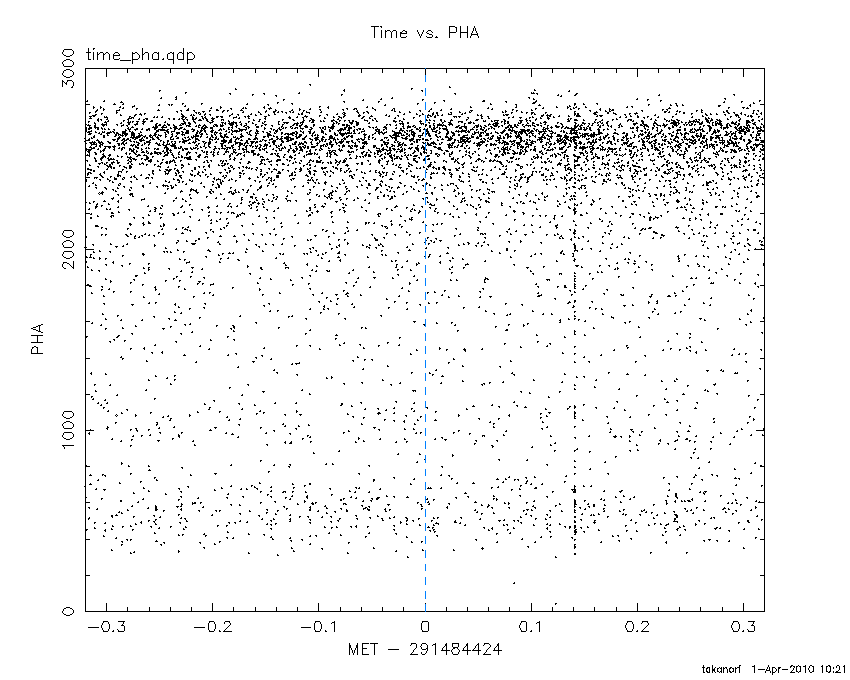
Blue+Cyan dotted lines: Time interval of the scaled map
From 0.000000 to 64.000000
TIME vs. DetID plot around the trigger time
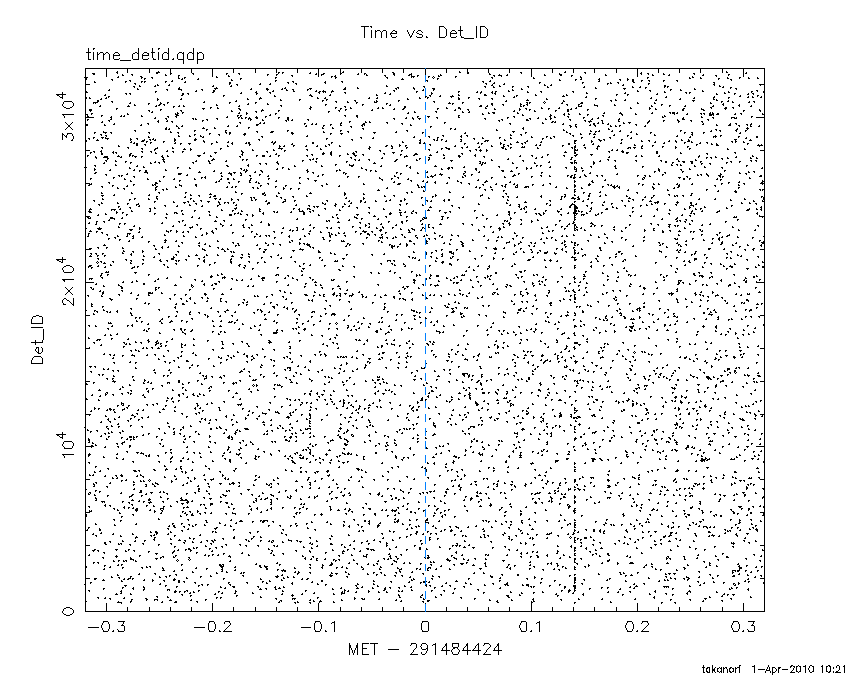
Blue+Cyan dotted lines: Time interval of the scaled map
From 0.000000 to 64.000000
100 us light curve (15-350 keV)
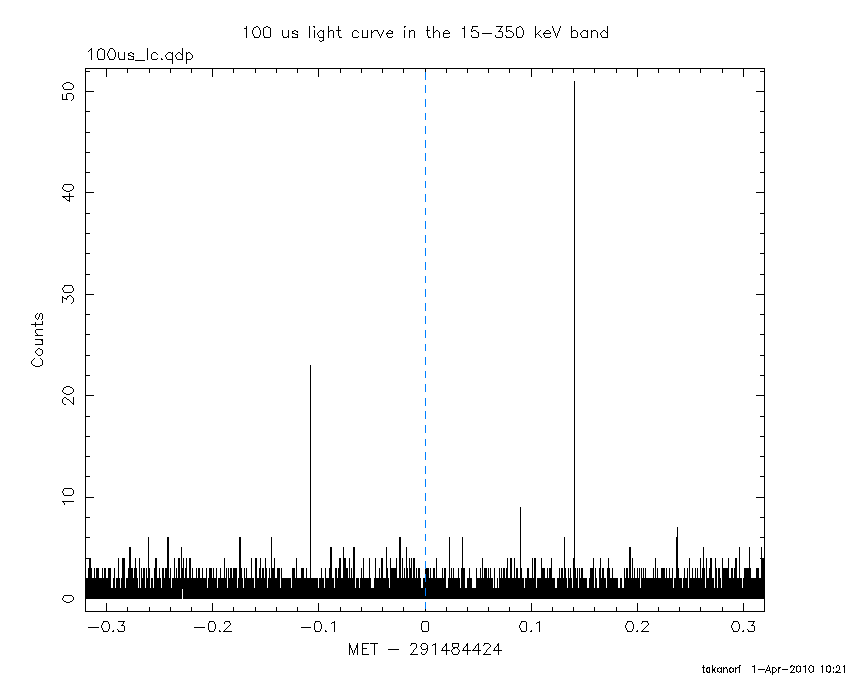
Blue+Cyan dotted lines: Time interval of the scaled map
From 0.000000 to 64.000000
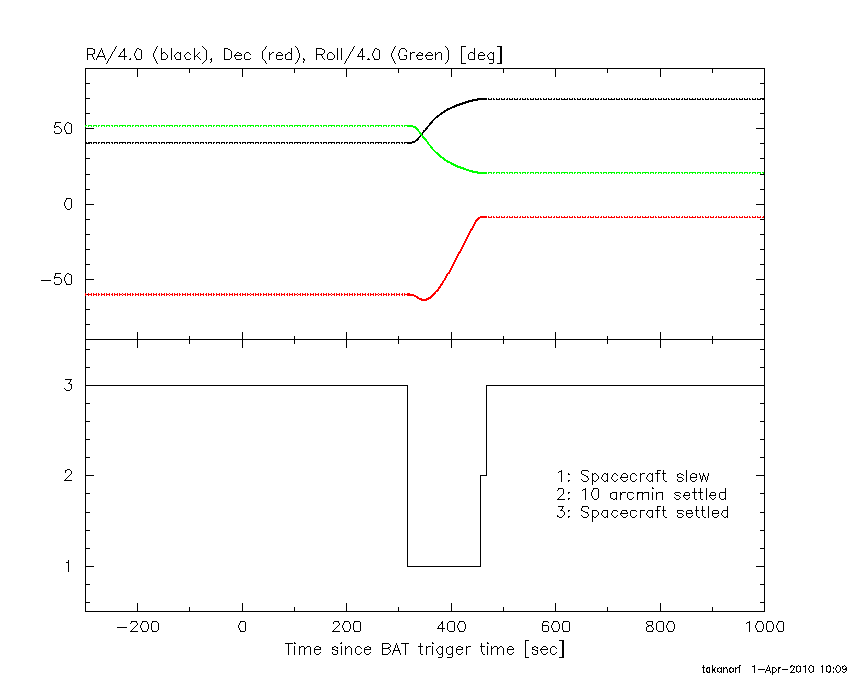
Spacecraft aspect plot
Bright source in the pre-burst/pre-slew/post-slew images
Pre-burst image of 15-350 keV band
Time interval of the image:
-239.000000 -116.824000

# RAcent  DECcent POSerr Theta    Phi  PeakCts   SNR AngSep     Name
#  [deg]    [deg]    ['] [deg]  [deg]                   [']
135.5171 -40.5580    1.1  25.5    8.9   1.4072  10.5    0.6	Vela X-1
169.9879 -60.7207    4.3   3.8  168.3   0.3183   2.7   11.3	Cen X-3
186.5224 -62.6880    3.3  11.9  176.1   0.3885   3.5    6.2	GX 301-2
264.6951 -44.3975    6.3  58.1 -173.4   1.2786   1.8    3.8	4U 1735-44
222.7602 -36.0843    2.4  44.7  147.8   1.6142   4.8 ------	UNKNOWN
195.1366 -61.6388    2.0  15.9  172.5   0.6520   5.6 ------	UNKNOWN
255.7071 -48.7875    1.4  50.8 -176.1   2.6277   8.5 ------	UNKNOWN
276.2163 -48.1924    2.8  59.4 -163.2   3.2725   4.2 ------	UNKNOWN
Pre-slew background subtracted image of 15-350 keV band
Time interval of the image:
-116.824000 128.616000

# RAcent  DECcent POSerr Theta    Phi  PeakCts   SNR AngSep     Name
#  [deg]    [deg]    ['] [deg]  [deg]                   [']
135.5346 -40.3562    6.0  25.7    9.2   0.5626   1.9   11.9	Vela X-1
169.9194 -60.7075    0.0   3.8  168.2  -0.4496  -1.8   12.7	Cen X-3
186.5763 -62.6180    7.0  11.9  175.7  -0.4157  -1.7    9.4	GX 301-2
264.6937 -44.3273    5.8  58.1 -173.5  -3.2316  -2.0    7.7	4U 1735-44
130.1195 -45.0990    1.7  24.2   -5.1   1.8898   6.6 ------	UNKNOWN
105.3345 -18.7702    2.4  57.5   -8.5   6.5607   4.8 ------	UNKNOWN
299.5076 -62.5011    2.2  53.3 -141.2   7.1105   5.2 ------	UNKNOWN
Post-slew image of 15-350 keV band
Time interval of the image:
456.300600 851.050000
852.000000 963.060800

# RAcent  DECcent POSerr Theta    Phi  PeakCts   SNR AngSep     Name
#  [deg]    [deg]    ['] [deg]  [deg]                   [']
244.9866 -15.6492    0.4  33.4   81.5  27.5875  30.1    0.7	Sco X-1
254.5020  35.3754    3.5  49.4  161.2   4.2873   3.3    2.9	Her X-1
256.0805 -37.8667  100.6  35.6   38.1  -0.0784  -0.1    4.7	4U 1700-377
256.5100 -36.4592    3.2  34.3   39.3   2.3176   3.6    4.2	GX 349+2
262.9687 -24.7976    4.6  22.0   47.4   1.0202   2.5    3.8	GX 1+4
264.8973 -44.3114    0.0  37.7   23.0   1.5594   2.6   10.6	4U 1735-44
268.3765  -1.4978    2.7  12.3  131.5   1.5865   4.3    2.8	SW J1753.5-0127
270.3556 -25.0849    3.6  18.3   31.1   1.1980   3.2    3.9	GX 5-1
270.3248 -25.7274    3.4  18.9   30.3   1.2691   3.4    1.5	GRS 1758-258
274.0251 -13.9729    2.2   7.0   45.3   1.9658   5.2    4.0	GX 17+2
275.9243 -30.3986    5.2  22.0   12.9   0.8592   2.2    1.9	H1820-303
285.1641 -24.7522   65.2  17.4  -13.7   0.0669   0.2   12.3	HT1900.1-2455
288.7636  10.9560    0.7  22.0 -145.0   6.3773  16.7    2.1	GRS 1915+105
299.5732  35.2065    0.5  48.1 -149.7  20.0327  21.9    0.9	Cyg X-1
238.1937  -3.2438    2.5  40.4  102.1   6.6519   4.5 ------	UNKNOWN
246.5428 -46.1361    2.8  46.5   37.4   5.3509   4.2 ------	UNKNOWN
255.7275 -48.7806    1.0  44.5   28.3   9.9546  11.5 ------	UNKNOWN
255.1931 -41.6636    1.8  39.0   35.0   4.9071   6.6 ------	UNKNOWN
266.8367  44.6349    2.9  54.2  176.9   5.7691   4.0 ------	UNKNOWN
268.8363  47.7190    3.0  56.9  179.3   8.7033   3.8 ------	UNKNOWN
287.5758  49.9723    3.0  59.0 -166.1  10.3970   3.8 ------	UNKNOWN
	UNKNOWN
	UNKNOWN
	UNKNOWN
Plot creation:
Thu Apr  1 10:21:38 EDT 2010