Special notes of this burst
Image
Pre-slew 15.0-350.0 keV image (Event data)
#   RAcent    DECcent   POSerr    Theta     Phi              Peak Cts       SNR   Name
  256.3586    11.4570   0.0165    29.7056   133.9319         0.7266462     11.636 TRIG_00419797

Foreground time interval of the image:
 -1.112   8.304 (delta_t =   9.416 [sec])
Background time interval of the image:
-17.459  -1.112 (delta_t =  16.347 [sec])
Lightcurves
Notes:
- 1) The mask-weighted light curves are using the flight position.
- 2) Multiple plots of different time binning/intervals are shown to cover all scenarios of short/long GRBs, rate/image triggers, and real/false positives.
- 3) For all the mask-weighted lightcurves, the y-axis units are counts/sec/det where a det is 0.4 x 0.4 = 0.16 sq cm.
- 4) The verticle lines correspond to following: green dotted lines are T50 interval, black dotted lines are T90 interval, blue solid line(s) is a spacecraft slew start time, and orange solid line(s) is a spacecraft slew end time.
- 5) Time of each bin is in the middle of the bin.
1 s binning
From T0-310 s to T0+310 s
From T100_start - 20 s to T100_end + 30 s
Full time interval
64 ms binning
Full time interval
From T100_start to T100_end
From T0-5 sec to T0+5 sec
16 ms binning
From T100_start-5 s to T100_start+5 s
Blue+Cyan dotted lines: Time interval of the scaled map
From 0.000000 to 1.024000
8 ms binning
From T100_start-3 s to T100_start+3 s
Blue+Cyan dotted lines: Time interval of the scaled map
From 0.000000 to 1.024000
2 ms binning
From T100_start-1 s to T100_start+1 s
Blue+Cyan dotted lines: Time interval of the scaled map
From 0.000000 to 1.024000
SN=5 or 10 sec. binning (whichever binning is satisfied first)
SN=5 or 10 sec. binning (T < 200 sec)
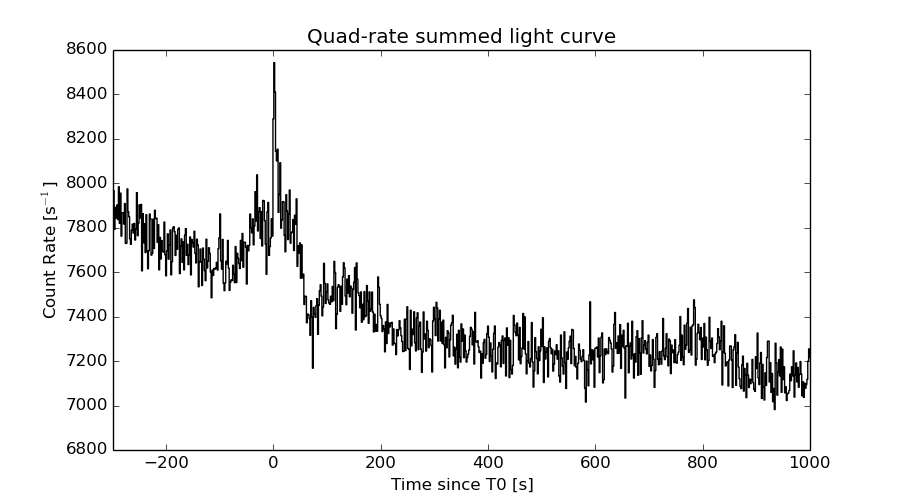
Quad-rate summed light curves (from T0-300s to T0+1000s)
Spectral Evolution

Spectra
Notes:
- 1) The fitting includes the systematic errors.
- 2) When the burst includes telescope slew time periods, the fitting uses an average response file made from multiple 5-s response files through out the slew time plus single time preiod for the non-slew times, and weighted by the total counts in the corresponding time period using addrmf. An average response file is needed becuase a spectral fit using the pre-slew DRM will introduce some errors in both a spectral shape and a normalization if the PHA file contains a lot of the slew/post-slew time interval.
- 3) For fits to more complicated models (e.g. a power-law over a cutoff power-law), the BAT team has decided to require a chi-square improvement of more than 6 for each extra dof.
Time averaged spectrum fit using the average DRM
Power-law model

Time interval is from   -1.112 sec. to    8.304 sec.

Spectral model in power-law:
------------------------------------------------------------
Parameters  : value       lower 90%   higher 90%
Photon index: 2.19543     ( -0.25147   0.271075 )
Norm@50keV  : 3.91453E-03    ( -0.000670416   0.000644936 )
------------------------------------------------------------
#Fit statistic : Chi-Squared =          65.28 using 59 PHA bins.
# Reduced chi-squared =          1.145 for     57 degrees of freedom
# Null hypothesis probability =   2.110903e-01

Photon flux (15-150 keV)    in 9.416 sec: 0.646509 ( -0.0768031  0.0769063 ) ph/cm2/s
Energy fluence (15-150 keV)             : 3.46331e-07 ( -4.93406e-08  5.07182e-08 ) ergs/cm2
Cutoff power-law model

Time interval is from   -1.112 sec. to    8.304 sec.
Spectral model in the cutoff power-law:
------------------------------------------------------------
Parameters  : value       lower 90%   higher 90%
Photon index: 1.91581     (     )
Epeak [keV] : 16.1696      (   )
Norm@50keV  : 5.34933E-03    (     )
------------------------------------------------------------
#Fit statistic : Chi-Squared =          66.55 using 59 PHA bins.
# Reduced chi-squared =          1.188 for     56 degrees of freedom
# Null hypothesis probability =   1.580822e-01

Photon flux (15-150 keV)    in 9.416 sec: 0.647327 (    ) ph/cm2/s
Energy fluence (15-150 keV)             : 3.45611e-07 ( -4.86704e-08  4.94274e-08 ) ergs/cm2
Band function
Time interval is from   -1.112 sec. to    8.304 sec.

Spectral model in the Band function:
------------------------------------------------------------
Parameters  : value       lower 90%   higher 90%
alpha       : -1.61022   ( 1.61227   1.61227 )
beta        : -2.19334    ( 2.19452   0.250699 )
Epeak [keV] : 10.7342      ( -10.1381 -10.1381 )
Norm@50keV   : 1.36076E-02    ( -0.0139738   0.347042 )
------------------------------------------------------------
#Fit statistic : Chi-Squared =          65.28 using 59 PHA bins.
# Reduced chi-squared =          1.187 for     55 degrees of freedom
# Null hypothesis probability =   1.615722e-01

Photon flux (15-150 keV)    in 9.416 sec:  (    ) ph/cm2/s
Energy fluence (15-150 keV)             : 0 ( 0  0 ) ergs/cm2
Single BB
Spectral model blackbody:
------------------------------------------------------------
Parameters  : value    Lower 90%  Upper 90%
kT [keV]    : 8.02743  (-1.29376  1.61046)
R^2/D10^2   : 0.652169  (-0.337887   0.69496)
(R is the radius in km and D10 is the distance to the source in units of 10 kpc)
------------------------------------------------------------
#Fit statistic : Chi-Squared =          92.89 using 59 PHA bins.
# Reduced chi-squared =          1.630 for     57 degrees of freedom
# Null hypothesis probability =   1.878478e-03

Energy  Fluence     90% Error
[keV]   [erg/cm2]   [erg/cm2]
15- 25  7.174e-08   1.645e-08
25- 50  1.263e-07   2.307e-08
50-150  3.354e-08   1.337e-08
15-150  2.316e-07   4.595e-08
Thermal bremsstrahlung (OTTB)
Spectral model: thermal bremsstrahlung
------------------------------------------------------------
Parameters  : value         Lower 90%    Upper 90%
kT [keV]    : 51.8239       (-16.7832      30.7307)
Norm        : 3.49742       (-0.757591     1.10362)
------------------------------------------------------------
#Fit statistic : Chi-Squared =          70.64 using 59 PHA bins.
# Reduced chi-squared =          1.239 for     57 degrees of freedom
# Null hypothesis probability =   1.058554e-01

Energy  Fluence     90% Error
[keV]   [erg/cm2]   [erg/cm2]
15- 25  8.117e-08   1.402e-08
25- 50  1.180e-07   1.638e-08
50-150  1.185e-07   4.068e-08
15-150  3.177e-07   5.019e-08
Double BB

Spectral model: bbodyrad<1> + bbodyrad<2>
------------------------------------------------------------
Parameters  : value         Lower 90%    Upper 90%
kT1 [keV]   : 4.97598        (-1.13642      1.29206)
R1^2/D10^2  : 3.92880        (-2.43065      8.60287)
kT2 [keV]   : 23.5629        (-7.56163      15.7973)
R2^2/D10^2  : 7.90565E-03    (-0.00638561   0.0220027)
------------------------------------------------------------
#Fit statistic : Chi-Squared =          64.51 using 59 PHA bins.
# Reduced chi-squared =          1.173 for     55 degrees of freedom
# Null hypothesis probability =   1.783712e-01

Energy  Fluence     90% Error
[keV]   [erg/cm2]   [erg/cm2]
15- 25  9.565e-08   3.294e-08
25- 50  9.765e-08   3.842e-08
50-150  1.709e-07   1.026e-07
15-150  3.642e-07   1.428e-07
Peak spectrum fit
Power-law model

Time interval is from    0.472 sec. to    1.472 sec.

Spectral model in power-law:
------------------------------------------------------------
Parameters  : value       lower 90%   higher 90%
Photon index: 2.66135     ( -0.546742   0.711114 )
Norm@50keV  : 4.78988E-03    ( -0.00218985   0.00215965 )
------------------------------------------------------------
#Fit statistic : Chi-Squared =          58.06 using 59 PHA bins.
# Reduced chi-squared =          1.019 for     57 degrees of freedom
# Null hypothesis probability =   4.361510e-01

Photon flux (15-150 keV)    in 1 sec: 1.04217 ( -0.234906  0.234941 ) ph/cm2/s
Energy fluence (15-150 keV)             : 5.02867e-08 ( -1.44955e-08  1.57692e-08 ) ergs/cm2
Cutoff power-law model
Time interval is from    0.472 sec. to    1.472 sec.
Spectral model in the cutoff power-law:
------------------------------------------------------------
Parameters  : value       lower 90%   higher 90%
Photon index: 1.98401     ( -1.10067   0.0155924 )
Epeak [keV] : 0.972607      ( -0.624611 30.9766 )
Norm@50keV  : 1.18660E-02    (     )
------------------------------------------------------------
#Fit statistic : Chi-Squared =          59.04 using 59 PHA bins.
# Reduced chi-squared =          1.054 for     56 degrees of freedom
# Null hypothesis probability =   3.650134e-01

Photon flux (15-150 keV)    in 1 sec: 1.04253 ( -0.237007  0.23577 ) ph/cm2/s
Energy fluence (15-150 keV)             : 4.96584e-08 ( -1.40901e-08  1.64227e-08 ) ergs/cm2
Band function

Time interval is from    0.472 sec. to    1.472 sec.

Spectral model in the Band function:
------------------------------------------------------------
Parameters  : value       lower 90%   higher 90%
alpha       : -6.26981   ( 6.26981   6.26981 )
beta        : -2.66137    ( -0.711111   0.547474 )
Epeak [keV] : 22.9947      ( -22.9947 -22.9947 )
Norm@50keV   : 0.651003    ( -0.29763   0.293528 )
------------------------------------------------------------
#Fit statistic : Chi-Squared =          58.06 using 59 PHA bins.
# Reduced chi-squared =          1.056 for     55 degrees of freedom
# Null hypothesis probability =   3.633491e-01

Photon flux (15-150 keV)    in 1 sec:  (    ) ph/cm2/s
Energy fluence (15-150 keV)             : 0 ( 0  0 ) ergs/cm2
Single BB
Spectral model blackbody:
------------------------------------------------------------
Parameters  : value    Lower 90%  Upper 90%
kT [keV]    : 5.99966  (-1.79181  2.39047)
R^2/D10^2   : 3.53217  (-3.49858   14.4829)
(R is the radius in km and D10 is the distance to the source in units of 10 kpc)
------------------------------------------------------------
#Fit statistic : Chi-Squared =          65.22 using 59 PHA bins.
# Reduced chi-squared =          1.144 for     57 degrees of freedom
# Null hypothesis probability =   2.126085e-01

Energy  Fluence     90% Error
[keV]   [erg/cm2]   [erg/cm2]
15- 25  1.689e-08   9.276e-09
25- 50  1.684e-08   1.010e-08
50-150  1.542e-09   1.223e-09
15-150  3.528e-08   2.057e-08
Thermal bremsstrahlung (OTTB)
Spectral model: thermal bremsstrahlung
------------------------------------------------------------
Parameters  : value         Lower 90%    Upper 90%
kT [keV]    : 27.5013       (-13.5916      32.6699)
Norm        : 8.78369       (-4.02309     10.8974)
------------------------------------------------------------
#Fit statistic : Chi-Squared =          60.26 using 59 PHA bins.
# Reduced chi-squared =          1.057 for     57 degrees of freedom
# Null hypothesis probability =   3.587700e-01

Energy  Fluence     90% Error
[keV]   [erg/cm2]   [erg/cm2]
15- 25  1.705e-08   5.292e-09
25- 50  1.854e-08   8.448e-09
50-150  9.030e-09   6.425e-09
15-150  4.462e-08   1.899e-08
Double BB
Spectral model: bbodyrad<1> + bbodyrad<2>
------------------------------------------------------------
Parameters  : value         Lower 90%    Upper 90%
kT1 [keV]   : 3.59733        (-2.32322      2.23663)
R1^2/D10^2  : 32.0954        (-28.4209      56611.6)
kT2 [keV]   : 16.4569        (-9.41652      26.8946)
R2^2/D10^2  : 4.04897E-02    (-0.0387446   1.4758)
------------------------------------------------------------
#Fit statistic : Chi-Squared =          58.03 using 59 PHA bins.
# Reduced chi-squared =          1.055 for     55 degrees of freedom
# Null hypothesis probability =   3.641338e-01

Energy  Fluence     90% Error
[keV]   [erg/cm2]   [erg/cm2]
15- 25  1.929e-08   1.055e-08
25- 50  1.420e-08   7.350e-09
50-150  1.859e-08   1.158e-08
15-150  5.209e-08   2.774e-08
Pre-slew spectrum (Pre-slew PHA with pre-slew DRM)
Power-law model

Spectral model in power-law:
------------------------------------------------------------
Parameters  : value       lower 90%   higher 90%
Photon index: 2.19543     ( -0.25147   0.271075 )
Norm@50keV  : 3.91453E-03    ( -0.000670416   0.000644936 )
------------------------------------------------------------
#Fit statistic : Chi-Squared =          65.28 using 59 PHA bins.
# Reduced chi-squared =          1.145 for     57 degrees of freedom
# Null hypothesis probability =   2.110903e-01

Photon flux (15-150 keV)    in 9.416 sec: 0.646509 ( -0.0768031  0.0769063 ) ph/cm2/s
Energy fluence (15-150 keV)             : 3.46331e-07 ( -4.93406e-08  5.07182e-08 ) ergs/cm2
Cutoff power-law model

Spectral model in the cutoff power-law:
------------------------------------------------------------
Parameters  : value       lower 90%   higher 90%
Photon index: 1.91581     (     )
Epeak [keV] : 16.1696      (   )
Norm@50keV  : 5.34933E-03    (     )
------------------------------------------------------------
#Fit statistic : Chi-Squared =          66.55 using 59 PHA bins.
# Reduced chi-squared =          1.188 for     56 degrees of freedom
# Null hypothesis probability =   1.580822e-01

Photon flux (15-150 keV)    in 9.416 sec: 0.647327 (    ) ph/cm2/s
Energy fluence (15-150 keV)             : 3.45611e-07 ( -4.86704e-08  4.94274e-08 ) ergs/cm2
Band function

Spectral model in the Band function:
------------------------------------------------------------
Parameters  : value       lower 90%   higher 90%
alpha       : -1.61022   ( 1.61227   1.61227 )
beta        : -2.19334    ( 2.19452   0.250699 )
Epeak [keV] : 10.7342      ( -10.1381 -10.1381 )
Norm@50keV   : 1.36076E-02    ( -0.0139738   0.205994 )
------------------------------------------------------------
#Fit statistic : Chi-Squared =          65.28 using 59 PHA bins.
# Reduced chi-squared =          1.187 for     55 degrees of freedom
# Null hypothesis probability =   1.615722e-01

Photon flux (15-150 keV)    in 9.416 sec:  (    ) ph/cm2/s
Energy fluence (15-150 keV)             : 0 ( 0  0 ) ergs/cm2
S(25-50 keV) vs. S(50-100 keV) plot
S(25-50 keV)  = 1.10e-07
S(50-100 keV) = 9.57e-08
T90 vs. Hardness ratio plot
T90                                   = 7.92799997329712 sec.
Hardness ratio (energy fluence ratio) = 0.87
Color vs. Color plot

Count Ratio  (25-50 keV) / (15-25 keV) = 0.744473
Count Ratio (50-100 keV) / (15-25 keV) = 0.446216
Mask shadow pattern

IMX = -3.958289840619809E-01, IMY = -4.108687631825915E-01
TIME vs. PHA plot around the trigger time
Blue+Cyan dotted lines: Time interval of the scaled map
From 0.000000 to 1.024000
TIME vs. DetID plot around the trigger time
Blue+Cyan dotted lines: Time interval of the scaled map
From 0.000000 to 1.024000
100 us light curve (15-350 keV)
Blue+Cyan dotted lines: Time interval of the scaled map
From 0.000000 to 1.024000
Spacecraft aspect plot

Bright source in the pre-burst/pre-slew/post-slew images
Pre-burst image of 15-350 keV band
Time interval of the image:
-17.459400 -1.112000

# RAcent  DECcent POSerr Theta    Phi  PeakCts   SNR AngSep     Name
#  [deg]    [deg]    ['] [deg]  [deg]                   [']
244.9849 -15.6577    0.9  33.5   76.5   1.2104  13.1    1.1	Sco X-1
254.3200  35.2362   16.1  49.3  155.9   0.1080   0.7    9.3	Her X-1
255.8166 -37.9569    9.3  35.8   33.3   0.0953   1.2   10.5	4U 1700-377
256.5999 -36.4397   64.8  34.3   34.2   0.0130   0.2    8.0	GX 349+2
262.9295 -24.7011    4.9  21.9   42.7   0.1177   2.3    5.1	GX 1+4
264.5722 -44.4924   19.1  37.9   18.2   0.0413   0.6    7.7	4U 1735-44
268.5154  -1.3001    0.0  12.3  127.6   0.0443   1.1   12.7	SW J1753.5-0127
270.4428 -25.0653    9.0  18.2   25.9  -0.0599  -1.3    8.7	GX 5-1
270.3965 -25.8940   12.9  19.0   24.8   0.0418   0.9   10.4	GRS 1758-258
274.1569 -13.9176    2.2   6.8   39.7   0.2190   5.2   11.3	GX 17+2
275.9880 -30.4728    5.0  22.1    7.7   0.1053   2.3    7.1	H1820-303
285.1457 -25.0621    4.4  17.7  -18.3   0.1083   2.6   10.4	HT1900.1-2455
288.8671  11.0037    2.1  22.1 -149.9   0.2430   5.7    5.3	GRS 1915+105
299.5940  35.2004    1.8  48.1 -154.7   0.5782   6.3    0.2	Cyg X-1
308.1453  40.9164    5.6  56.5 -151.3   0.4495   2.1    2.7	Cyg X-3
263.1047 -33.9931    7.1  29.1   28.8   0.0892   1.6   11.1	GX 354-0
263.7635  20.9928    2.5  32.9  156.1   0.2597   4.6 ------	UNKNOWN
278.3337  16.9159    2.3  25.4 -178.3   0.2371   5.1 ------	UNKNOWN
315.7735  23.1387    2.2  48.3 -129.7   1.0115   5.2 ------	UNKNOWN
Pre-slew background subtracted image of 15-350 keV band
Time interval of the image:
-1.112000 8.304000

# RAcent  DECcent POSerr Theta    Phi  PeakCts   SNR AngSep     Name
#  [deg]    [deg]    ['] [deg]  [deg]                   [']
245.0418 -15.5712   13.7  33.4   76.6  -0.0723  -0.8    5.5	Sco X-1
254.4096  35.2770   41.9  49.3  156.0  -0.0403  -0.3    4.6	Her X-1
256.1096 -37.9324   10.0  35.7   33.0   0.0797   1.2    7.9	4U 1700-377
256.4148 -36.4091  265.6  34.3   34.4   0.0030   0.0    1.3	GX 349+2
262.9823 -24.6457    6.7  21.9   42.7  -0.0785  -1.7    6.2	GX 1+4
264.7741 -44.6019   40.2  38.0   17.9   0.0188   0.3    9.2	4U 1735-44
268.3873  -1.4360  307.8  12.3  126.7  -0.0016  -0.0    1.5	SW J1753.5-0127
270.4446 -25.1742   13.6  18.3   25.7   0.0371   0.8   10.4	GX 5-1
270.4637 -25.8655   15.8  18.9   24.7  -0.0317  -0.7   11.4	GRS 1758-258
274.1566 -13.9064    3.0   6.8   39.7  -0.1537  -3.8   11.7	GX 17+2
275.7618 -30.3182   18.3  21.9    8.3  -0.0273  -0.6    8.9	H1820-303
285.1993 -24.9974    5.0  17.7  -18.5  -0.0945  -2.3   10.0	HT1900.1-2455
288.6921  10.8675   14.6  21.9 -150.1   0.0325   0.8    7.8	GRS 1915+105
299.4683  35.0977    4.4  47.9 -154.7   0.2231   2.7    8.6	Cyg X-1
308.0950  40.8934    5.8  56.4 -151.3   0.4158   2.0    3.6	Cyg X-3
263.0219 -33.7538   11.8  29.0   29.2   0.0508   1.0    5.1	GX 354-0
256.3586  11.4570    1.0  29.7  133.9   0.7267  11.6 ------	UNKNOWN
295.9000  -1.4113    2.0  18.8 -109.3   0.2589   5.8 ------	UNKNOWN
305.1138 -39.3903    2.5  39.0  -31.4   0.2858   4.6 ------	UNKNOWN
320.9137 -39.4412    2.5  48.9  -41.8   0.5852   4.7 ------	UNKNOWN
Post-slew image of 15-350 keV band
Time interval of the image:
67.740590 962.295100

# RAcent  DECcent POSerr Theta    Phi  PeakCts   SNR AngSep     Name
#  [deg]    [deg]    ['] [deg]  [deg]                   [']
244.9822 -15.6365    0.2  29.4   45.8  53.1814  54.1    0.3	Sco X-1
254.3975  35.2314    9.1  23.8 -161.2   0.9401   1.3    7.3	Her X-1
256.0028 -37.8244    7.9  49.3   23.4   3.3957   1.5    1.4	4U 1700-377
256.5794 -36.4016    5.4  47.9   22.8  -3.9905  -2.1    7.1	GX 349+2
262.8243 -24.6837   56.2  36.7   13.2   0.1965   0.2   10.7	GX 1+4
268.3195  -1.4074    2.3  17.5  -20.4   3.2424   4.9    4.0	SW J1753.5-0127
270.3145 -25.0801    3.9  39.0    2.7   3.1599   2.9    1.6	GX 5-1
270.3199 -25.6716   10.7  39.5    3.0   1.1327   1.1    4.4	GRS 1758-258
274.0051 -14.0201    1.4  30.9  -11.9   5.9976   8.2    1.0	GX 17+2
275.8336 -30.4062    6.0  45.8   -0.6   2.5059   1.9    5.3	H1820-303
285.1197 -24.9843    4.8  45.9  -14.3   2.9808   2.4    5.9	HT1900.1-2455
288.8358  10.9077    1.7  31.8  -69.3   7.2092   6.6    3.2	GRS 1915+105
262.8090 -33.7479    5.9  45.6   15.5  -2.7855  -1.9   10.4	GX 354-0
257.9064 -23.6681    2.0  35.2   20.6   5.3260   5.7 ------	UNKNOWN
239.7866  28.2441    3.8  22.9  162.5   2.1425   3.0 ------	UNKNOWN
271.1211 -30.4869    2.5  44.3    4.7   4.9844   4.7 ------	UNKNOWN
216.7781  56.1585    6.7  54.2  176.9   5.2393   1.7 ------	UNKNOWN
285.8643  52.1060    3.8  47.1 -132.7   7.1055   3.0 ------	UNKNOWN
302.8758  -9.5251    3.7  50.7  -44.5  13.1273   3.1 ------	UNKNOWN
288.7057  53.8517    2.9  49.5 -132.6  15.6564   4.0 ------	UNKNOWN
Plot creation:
Sun May 31 01:51:46 EDT 2015