Special notes of this burst
Image
Pre-slew 15.0-50.0 keV image (Event data)
#RAcent DECcent POSerr Theta  Phi  Peak_Cts  SNR Name
296.128 55.793 0.000 15.787 140.560 0.412 5.929 TRIG_00419932

Image time interval: 0.000 to 64.000 [sec]
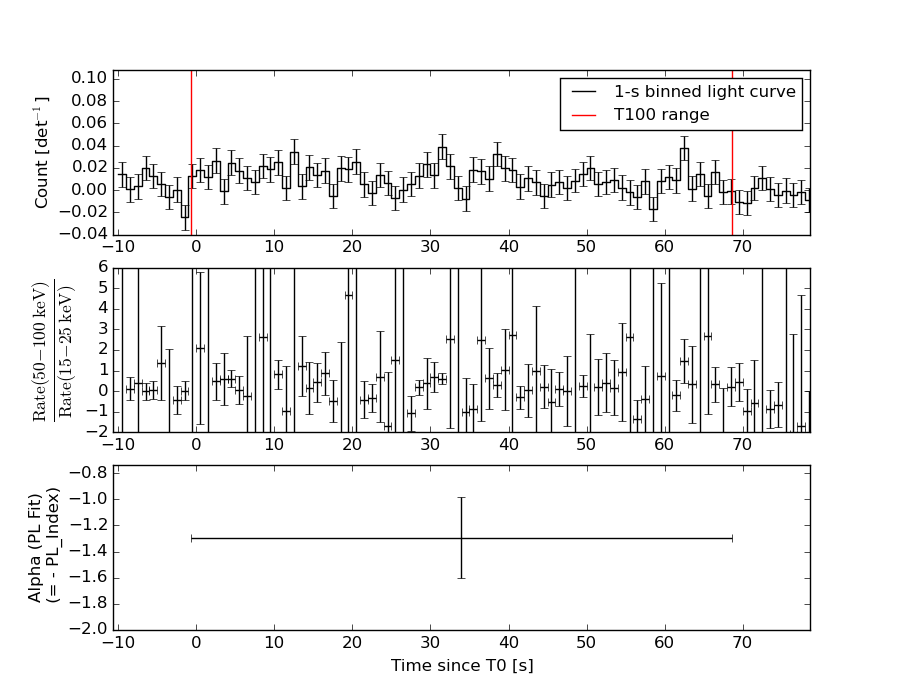
Lightcurves
Notes:
- 1) The mask-weighted light curves are using the flight position.
- 2) Multiple plots of different time binning/intervals are shown to cover all scenarios of short/long GRBs, rate/image triggers, and real/false positives.
- 3) For all the mask-weighted lightcurves, the y-axis units are counts/sec/det where a det is 0.4 x 0.4 = 0.16 sq cm.
- 4) The verticle lines correspond to following: green dotted lines are T50 interval, black dotted lines are T90 interval, blue solid line(s) is a spacecraft slew start time, and orange solid line(s) is a spacecraft slew end time.
- 5) Time of each bin is in the middle of the bin.
1 s binning
From T0-310 s to T0+310 s

From T100_start - 20 s to T100_end + 30 s

Full time interval

64 ms binning
Full time interval

From T100_start to T100_end

From T0-5 sec to T0+5 sec
16 ms binning
From T100_start-5 s to T100_start+5 s
Blue+Cyan dotted lines: Time interval of the scaled map
From 0.000000 to 64.000000
8 ms binning
From T100_start-3 s to T100_start+3 s
Blue+Cyan dotted lines: Time interval of the scaled map
From 0.000000 to 64.000000
2 ms binning
From T100_start-1 s to T100_start+1 s
Blue+Cyan dotted lines: Time interval of the scaled map
From 0.000000 to 64.000000
SN=5 or 10 sec. binning (whichever binning is satisfied first)
SN=5 or 10 sec. binning (T < 200 sec)
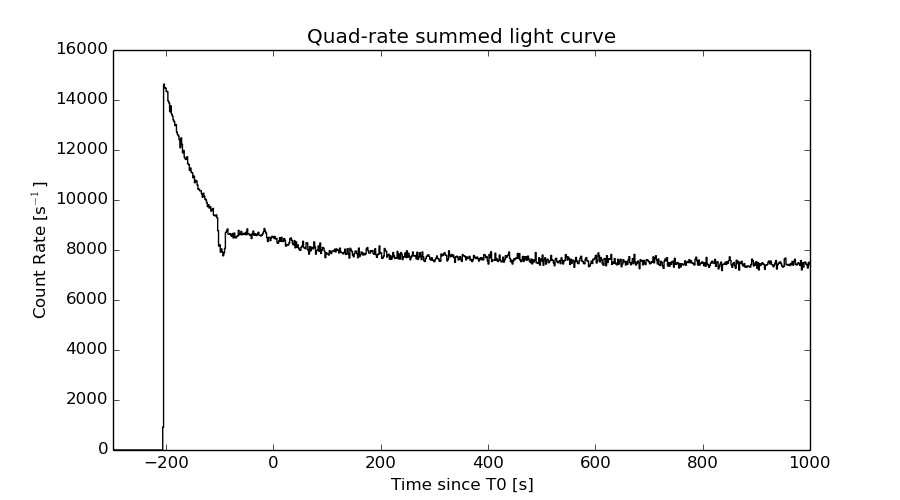
Quad-rate summed light curves (from T0-300s to T0+1000s)
Spectral Evolution
Spectra
Notes:
- 1) The fitting includes the systematic errors.
- 2) When the burst includes telescope slew time periods, the fitting uses an average response file made from multiple 5-s response files through out the slew time plus single time preiod for the non-slew times, and weighted by the total counts in the corresponding time period using addrmf. An average response file is needed becuase a spectral fit using the pre-slew DRM will introduce some errors in both a spectral shape and a normalization if the PHA file contains a lot of the slew/post-slew time interval.
- 3) For fits to more complicated models (e.g. a power-law over a cutoff power-law), the BAT team has decided to require a chi-square improvement of more than 6 for each extra dof.
Time averaged spectrum fit using the average DRM
Power-law model
Time interval is from   -0.732 sec. to   68.620 sec.

Spectral model in power-law:
------------------------------------------------------------
Parameters  : value       lower 90%   higher 90%
Photon index: 1.29427     ( -0.310503   0.307848 )
Norm@50keV  : 7.22951E-04    ( -0.000134164   0.000133511 )
------------------------------------------------------------
#Fit statistic : Chi-Squared =          54.46 using 59 PHA bins.
# Reduced chi-squared =         0.9555 for     57 degrees of freedom
# Null hypothesis probability =   5.708099e-01

Photon flux (15-150 keV)    in 69.35 sec: 8.61598E-02 ( -0.0158021  0.0158196 ) ph/cm2/s
Energy fluence (15-150 keV)             : 4.96135e-07 ( -1.03396e-07  1.06171e-07 ) ergs/cm2
Cutoff power-law model

Time interval is from   -0.732 sec. to   68.620 sec.
Spectral model in the cutoff power-law:
------------------------------------------------------------
Parameters  : value       lower 90%   higher 90%
Photon index: 0.243045     ( -1.98775   1.18137 )
Epeak [keV] : 79.4242      ( -24.79 -79.4199 )
Norm@50keV  : 2.56963E-03    ( -0.00256999   0.0262702 )
------------------------------------------------------------
#Fit statistic : Chi-Squared =          52.68 using 59 PHA bins.
# Reduced chi-squared =         0.9407 for     56 degrees of freedom
# Null hypothesis probability =   6.013054e-01

Photon flux (15-150 keV)    in 69.35 sec: 8.23074E-02 ( -0.0166661  0.0166093 ) ph/cm2/s
Energy fluence (15-150 keV)             : 4.45583e-07 ( -1.18428e-07  1.24732e-07 ) ergs/cm2
Band function

Time interval is from   -0.732 sec. to   68.620 sec.

Spectral model in the Band function:
------------------------------------------------------------
Parameters  : value       lower 90%   higher 90%
alpha       : 3.01228   ( -4.26246   -4.26246 )
beta        : -1.69743    ( -1.03784   0.464722 )
Epeak [keV] : 38.7123      ( -35.6466 134.236 )
Norm@50keV   : 0.398554    ( -0.398356   4.36017 )
------------------------------------------------------------
#Fit statistic : Chi-Squared =          51.83 using 59 PHA bins.
# Reduced chi-squared =         0.9424 for     55 degrees of freedom
# Null hypothesis probability =   5.964357e-01

Photon flux (15-150 keV)    in 69.35 sec:  (    ) ph/cm2/s
Energy fluence (15-150 keV)             : 4.62388e-07 ( 0  0 ) ergs/cm2
Single BB
Spectral model blackbody:
------------------------------------------------------------
Parameters  : value    Lower 90%  Upper 90%
kT [keV]    : 15.0265  (-2.97238  4.07479)
R^2/D10^2   : 1.02345E-02  (-0.00573994   0.0116826)
(R is the radius in km and D10 is the distance to the source in units of 10 kpc)
------------------------------------------------------------
#Fit statistic : Chi-Squared =          55.00 using 59 PHA bins.
# Reduced chi-squared =         0.9649 for     57 degrees of freedom
# Null hypothesis probability =   5.504034e-01

Energy  Fluence     90% Error
[keV]   [erg/cm2]   [erg/cm2]
15- 25  3.354e-08   1.136e-08
25- 50  1.335e-07   3.901e-08
50-150  2.053e-07   7.982e-08
15-150  3.723e-07   1.162e-07
Thermal bremsstrahlung (OTTB)
Spectral model: thermal bremsstrahlung
------------------------------------------------------------
Parameters  : value         Lower 90%    Upper 90%
kT [keV]    : 199.363       (-81.7045      -199.363)
Norm        : 0.353202       (-0.064649     0.064649)
------------------------------------------------------------
#Fit statistic : Chi-Squared =          55.25 using 59 PHA bins.
# Reduced chi-squared =         0.9693 for     57 degrees of freedom
# Null hypothesis probability =   5.408967e-01

Energy  Fluence     90% Error
[keV]   [erg/cm2]   [erg/cm2]
15- 25  6.099e-08   3.589e-08
25- 50  1.173e-07   6.762e-08
50-150  2.573e-07   1.490e-07
15-150  4.356e-07   2.559e-07
Double BB
Spectral model: bbodyrad<1> + bbodyrad<2>
------------------------------------------------------------
Parameters  : value         Lower 90%    Upper 90%
kT1 [keV]   : 9.86156        (-7.19751      5.48501)
R1^2/D10^2  : 2.79906E-02        (-0.0240328      0.279794)
kT2 [keV]   : 30.2904        (-34.5627      -38.3615)
R2^2/D10^2  : 5.67526E-04    (-0.000233841   0.00382715)
------------------------------------------------------------
#Fit statistic : Chi-Squared =          51.90 using 59 PHA bins.
# Reduced chi-squared =         0.9436 for     55 degrees of freedom
# Null hypothesis probability =   5.939769e-01

Energy  Fluence     90% Error
[keV]   [erg/cm2]   [erg/cm2]
15- 25  4.387e-08   2.984e-08
25- 50  1.280e-07   7.715e-08
50-150  2.713e-07   1.570e-07
15-150  4.432e-07   2.370e-07
Peak spectrum fit
Power-law model
Time interval is from   28.704 sec. to   29.704 sec.

Spectral model in power-law:
------------------------------------------------------------
Parameters  : value       lower 90%   higher 90%
Photon index: 1.28629     ( -1.28514   1.10884 )
Norm@50keV  : 2.32584E-03    ( -0.00121587   0.00109259 )
------------------------------------------------------------
#Fit statistic : Chi-Squared =          55.30 using 59 PHA bins.
# Reduced chi-squared =         0.9702 for     57 degrees of freedom
# Null hypothesis probability =   5.391155e-01

Photon flux (15-150 keV)    in 1 sec: 0.276751 ( -0.276751  0.130876 ) ph/cm2/s
Energy fluence (15-150 keV)             : 2.30734e-08 ( -2.30736e-08  1.40589e-08 ) ergs/cm2
Cutoff power-law model
Time interval is from   28.704 sec. to   29.704 sec.
Spectral model in the cutoff power-law:
------------------------------------------------------------
Parameters  : value       lower 90%   higher 90%
Photon index: 2.42604     (     )
Epeak [keV] : 140.917      (   )
Norm@50keV  : 5.55322E-04    (     )
------------------------------------------------------------
#Fit statistic : Chi-Squared =          54.42 using 59 PHA bins.
# Reduced chi-squared =         0.9718 for     56 degrees of freedom
# Null hypothesis probability =   5.347685e-01

Photon flux (15-150 keV)    in 1 sec: 0.278052 ( -0.130021  0.129738 ) ph/cm2/s
Energy fluence (15-150 keV)             : 2.2554e-16 ( 0  0 ) ergs/cm2
Band function

Time interval is from   28.704 sec. to   29.704 sec.

Spectral model in the Band function:
------------------------------------------------------------
Parameters  : value       lower 90%   higher 90%
alpha       : 4.97877   ( -4.97877   -4.97877 )
beta        : -1.99890    ( 1.9989   2.12751 )
Epeak [keV] : 28.6641      ( -28.6641 91.9531 )
Norm@50keV   : 118.314    ( -53.5928   2.60343e+06 )
------------------------------------------------------------
#Fit statistic : Chi-Squared =          54.67 using 59 PHA bins.
# Reduced chi-squared =         0.9940 for     55 degrees of freedom
# Null hypothesis probability =   4.871622e-01

Photon flux (15-150 keV)    in 1 sec:  (    ) ph/cm2/s
Energy fluence (15-150 keV)             : 0 ( 0  0 ) ergs/cm2
Single BB
Spectral model blackbody:
------------------------------------------------------------
Parameters  : value    Lower 90%  Upper 90%
kT [keV]    : 7.35790  (-2.39412  5.18237)
R^2/D10^2   : 0.410636  (-0.409965   1.52166)
(R is the radius in km and D10 is the distance to the source in units of 10 kpc)
------------------------------------------------------------
#Fit statistic : Chi-Squared =          56.73 using 59 PHA bins.
# Reduced chi-squared =         0.9953 for     57 degrees of freedom
# Null hypothesis probability =   4.849912e-01

Energy  Fluence     90% Error
[keV]   [erg/cm2]   [erg/cm2]
15- 25  3.750e-09   2.434e-09
25- 50  5.646e-09   3.983e-09
50-150  1.117e-09   1.057e-09
15-150  1.051e-08   6.800e-09
Thermal bremsstrahlung (OTTB)

Spectral model: thermal bremsstrahlung
------------------------------------------------------------
Parameters  : value         Lower 90%    Upper 90%
kT [keV]    : 199.363       (-199.363      -199.363)
Norm        : 1.11630       (-0.531349     0.531349)
------------------------------------------------------------
#Fit statistic : Chi-Squared =          55.92 using 59 PHA bins.
# Reduced chi-squared =         0.9810 for     57 degrees of freedom
# Null hypothesis probability =   5.158080e-01

Energy  Fluence     90% Error
[keV]   [erg/cm2]   [erg/cm2]
15- 25  2.780e-09   1.895e-09
25- 50  5.347e-09   3.758e-09
50-150  1.173e-08   8.260e-09
15-150  1.985e-08   1.273e-08
Double BB
------------------------------------------------------------
Parameters  : value         Lower 90%    Upper 90%
kT1 [keV]   : 200.000        (-200      -200)
R1^2/D10^2  : 7.86465E-05        (-4.90387e-05      0.000287064)
kT2 [keV]   : 6.41692        (-2.12611      3.39161)
R2^2/D10^2  : 0.615971    (-0.40007   1.29254)
------------------------------------------------------------
#Fit statistic : Chi-Squared =          56.73 using 59 PHA bins.
#Fit statistic : Chi-Squared =          49.98 using 59 PHA bins.
# Reduced chi-squared =          1.032 for     55 degrees of freedom
# Reduced chi-squared =         0.9088 for     55 degrees of freedom
# Null hypothesis probability =   4.101555e-01
# Null hypothesis probability =   6.663050e-01

Energy  Fluence     90% Error
[keV]   [erg/cm2]   [erg/cm2]
15- 25  3.747e-09   1.918e-01
25- 50  5.650e-09   1.845e+00
50-150  1.121e-09   5.235e+01
15-150  1.052e-08   4.020e+01
Pre-slew spectrum (Pre-slew PHA with pre-slew DRM)
Power-law model

Spectral model in power-law:
------------------------------------------------------------
Parameters  : value       lower 90%   higher 90%
Photon index: 1.29427     ( -0.310503   0.307848 )
Norm@50keV  : 7.22951E-04    ( -0.000134164   0.000133511 )
------------------------------------------------------------
#Fit statistic : Chi-Squared =          54.46 using 59 PHA bins.
# Reduced chi-squared =         0.9555 for     57 degrees of freedom
# Null hypothesis probability =   5.708099e-01

Photon flux (15-150 keV)    in 69.35 sec: 8.61598E-02 ( -0.0158021  0.0158196 ) ph/cm2/s
Energy fluence (15-150 keV)             : 4.96135e-07 ( -1.03396e-07  1.06171e-07 ) ergs/cm2
Cutoff power-law model

Spectral model in the cutoff power-law:
------------------------------------------------------------
Parameters  : value       lower 90%   higher 90%
Photon index: 0.243045     ( -1.98775   1.18137 )
Epeak [keV] : 79.4242      ( -24.79 -79.4199 )
Norm@50keV  : 2.56963E-03    ( -0.00256999   0.0262702 )
------------------------------------------------------------
#Fit statistic : Chi-Squared =          52.68 using 59 PHA bins.
# Reduced chi-squared =         0.9407 for     56 degrees of freedom
# Null hypothesis probability =   6.013054e-01

Photon flux (15-150 keV)    in 69.35 sec: 8.23074E-02 ( -0.0166661  0.0166093 ) ph/cm2/s
Energy fluence (15-150 keV)             : 4.45583e-07 ( -1.18428e-07  1.24732e-07 ) ergs/cm2
Band function
Spectral model in the Band function:
------------------------------------------------------------
Parameters  : value       lower 90%   higher 90%
alpha       : 3.01228   ( -4.26246   -4.26246 )
beta        : -1.69743    ( -1.03784   0.464722 )
Epeak [keV] : 38.7123      ( -35.6466 186.496 )
Norm@50keV   : 0.398554    ( -0.398356   4.36011 )
------------------------------------------------------------
#Fit statistic : Chi-Squared =          51.83 using 59 PHA bins.
# Reduced chi-squared =         0.9424 for     55 degrees of freedom
# Null hypothesis probability =   5.964357e-01

Photon flux (15-150 keV)    in 69.35 sec:  (    ) ph/cm2/s
Energy fluence (15-150 keV)             : 4.62388e-07 ( 0  0 ) ergs/cm2
S(25-50 keV) vs. S(50-100 keV) plot
S(25-50 keV)  = 1.10e-07
S(50-100 keV) = 1.80e-07
T90 vs. Hardness ratio plot

T90                                   = 62.9799999594688 sec.
Hardness ratio (energy fluence ratio) = 1.63636
Color vs. Color plot
Count Ratio  (25-50 keV) / (15-25 keV) = 1.72197
Count Ratio (50-100 keV) / (15-25 keV) = 1.18206
Mask shadow pattern

IMX = -0.218346559425, IMY = -0.179608973732
TIME vs. PHA plot around the trigger time
Blue+Cyan dotted lines: Time interval of the scaled map
From 0.000000 to 64.000000
TIME vs. DetID plot around the trigger time

Blue+Cyan dotted lines: Time interval of the scaled map
From 0.000000 to 64.000000
100 us light curve (15-350 keV)

Blue+Cyan dotted lines: Time interval of the scaled map
From 0.000000 to 64.000000
Spacecraft aspect plot

Bright source in the pre-burst/pre-slew/post-slew images
Pre-burst image of 15-350 keV band
Time interval of the image:
-6.299410 -0.732000

# RAcent  DECcent POSerr Theta    Phi  PeakCts   SNR AngSep     Name
#  [deg]    [deg]    ['] [deg]  [deg]                   [']
288.9984  10.8441    0.0  41.6   45.5   0.0681   0.9   13.3	GRS 1915+105
299.5766  35.1854    1.3  16.1   58.5   0.2391   8.6    1.2	Cyg X-1
308.0779  40.8899   12.2   7.3   54.9  -0.0237  -0.9    4.0	Cyg X-3
326.1783  38.3156   29.6  10.8  -46.2  -0.0099  -0.4    0.5	Cyg X-2
322.1166   0.5180    2.2  45.6   -5.1   0.2512   5.2 ------	UNKNOWN
 34.0450  62.3201    2.3  45.6 -136.3   0.3236   5.0 ------	UNKNOWN
 23.6457  50.6970    2.4  44.0 -118.1   0.5072   4.9 ------	UNKNOWN
Pre-slew background subtracted image of 15-350 keV band
Time interval of the image:
-0.732000 68.620000

# RAcent  DECcent POSerr Theta    Phi  PeakCts   SNR AngSep     Name
#  [deg]    [deg]    ['] [deg]  [deg]                   [']
288.6752  10.8901    3.3  41.7   46.0   3.3438   3.5    8.0	GRS 1915+105
299.7831  35.1235    6.1  16.0   58.0  -0.6648  -1.9   10.6	Cyg X-1
308.0630  40.9399    6.5   7.3   55.4   0.5809   1.8    2.3	Cyg X-3
326.1860  38.2520    7.7  10.9  -45.9   0.4867   1.5    4.2	Cyg X-2
329.7998 -10.4438    2.3  57.6  -12.5   9.0438   5.0 ------	UNKNOWN
  7.4629  46.3679    2.2  35.3 -106.1   3.2337   5.1 ------	UNKNOWN
Post-slew image of 15-350 keV band
Time interval of the image:
114.100580 963.022800

# RAcent  DECcent POSerr Theta    Phi  PeakCts   SNR AngSep     Name
#  [deg]    [deg]    ['] [deg]  [deg]                   [']
254.5871  35.2667    5.5  34.8   79.8  -2.8185  -2.1    7.8	Her X-1
288.7841  10.9534    1.8  45.2   18.4   7.5305   6.6    1.0	GRS 1915+105
299.5900  35.2031    0.2  20.7    0.2  33.2225  61.0    0.1	Cyg X-1
308.1213  40.9479    1.2  16.8  -24.7   4.8930   9.2    0.6	Cyg X-3
326.2448  38.3483    5.8  26.6  -53.5   1.3666   2.0    3.8	Cyg X-2
166.8529  63.6758    2.8  54.3  163.2  13.1281   4.1 ------	UNKNOWN
201.9846  68.1374    2.5  41.2  153.9   5.4507   4.5 ------	UNKNOWN
253.6127  68.0588    2.5  22.8  147.5   2.8708   4.7 ------	UNKNOWN
139.0470  65.8395    3.0  57.1  177.3  15.2692   3.8 ------	UNKNOWN
300.9364   0.6554    2.2  55.3    2.3  11.2965   5.2 ------	UNKNOWN
307.3559  -0.2596    3.4  56.8   -5.3   8.5895   3.4 ------	UNKNOWN
329.3153  30.3932    3.0  34.5  -48.3   2.7917   3.8 ------	UNKNOWN
322.9771   5.6850    2.5  54.5  -25.3   8.6641   4.6 ------	UNKNOWN
331.1490  15.4162    2.7  48.4  -39.5   7.4339   4.4 ------	UNKNOWN
339.6713  21.5179    3.1  47.0  -53.1  10.4325   3.7 ------	UNKNOWN
  3.3343  46.9703    4.2  41.1  -98.8   9.1843   2.8 ------	UNKNOWN
Plot creation:
Thu Nov 12 13:20:24 EST 2015