Special notes of this burst
Image
Pre-slew 15.0-350.0 keV image (Event data)
#   RAcent    DECcent   POSerr    Theta     Phi              Peak Cts       SNR   Name
  136.4723    21.4826   0.0032    32.2633   179.5052        12.7593574     60.496 TRIG_00420247

Foreground time interval of the image:
 -1.800  94.816 (delta_t =  96.616 [sec])
Background time interval of the image:
-179.896  -1.800 (delta_t = 178.096 [sec])
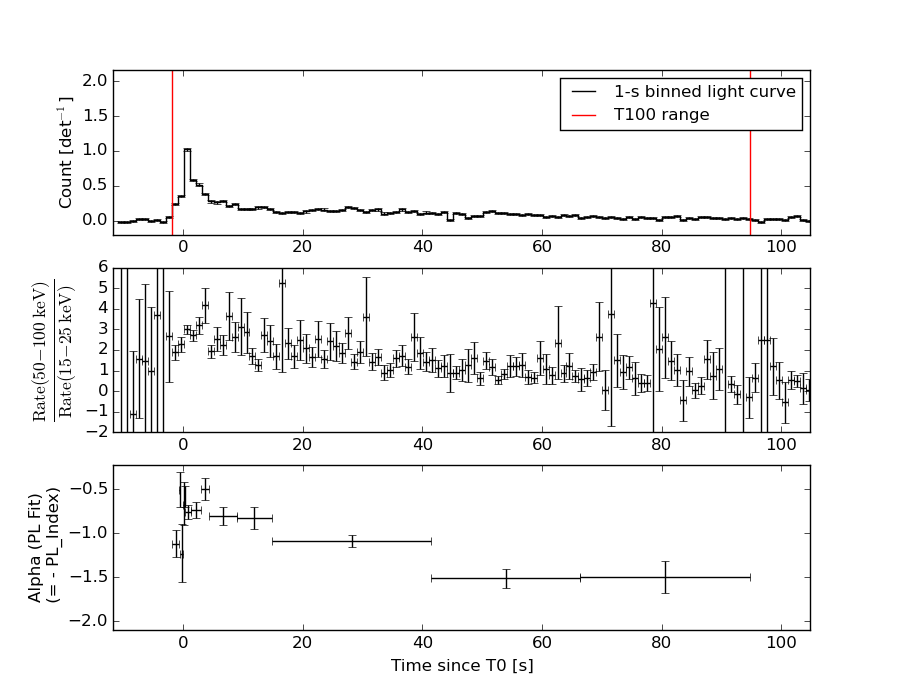
Lightcurves
Notes:
- 1) The mask-weighted light curves are using the flight position.
- 2) Multiple plots of different time binning/intervals are shown to cover all scenarios of short/long GRBs, rate/image triggers, and real/false positives.
- 3) For all the mask-weighted lightcurves, the y-axis units are counts/sec/det where a det is 0.4 x 0.4 = 0.16 sq cm.
- 4) The verticle lines correspond to following: green dotted lines are T50 interval, black dotted lines are T90 interval, blue solid line(s) is a spacecraft slew start time, and orange solid line(s) is a spacecraft slew end time.
- 5) Time of each bin is in the middle of the bin.
1 s binning
From T0-310 s to T0+310 s
From T100_start - 20 s to T100_end + 30 s
Full time interval
64 ms binning
Full time interval
From T100_start to T100_end
From T0-5 sec to T0+5 sec
16 ms binning
From T100_start-5 s to T100_start+5 s
8 ms binning
From T100_start-3 s to T100_start+3 s
2 ms binning
From T100_start-1 s to T100_start+1 s
SN=5 or 10 sec. binning (whichever binning is satisfied first)
SN=5 or 10 sec. binning (T < 200 sec)
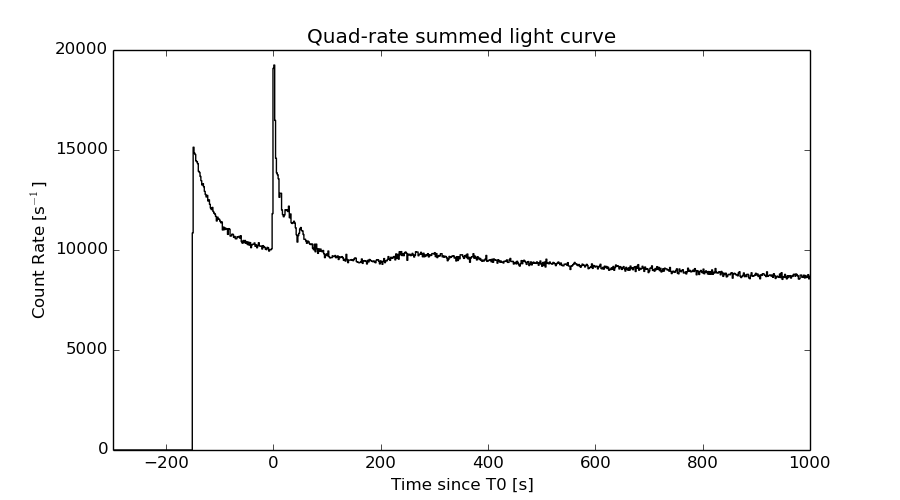
Quad-rate summed light curves (from T0-300s to T0+1000s)
Spectral Evolution
Spectra
Notes:
- 1) The fitting includes the systematic errors.
- 2) When the burst includes telescope slew time periods, the fitting uses an average response file made from multiple 5-s response files through out the slew time plus single time preiod for the non-slew times, and weighted by the total counts in the corresponding time period using addrmf. An average response file is needed becuase a spectral fit using the pre-slew DRM will introduce some errors in both a spectral shape and a normalization if the PHA file contains a lot of the slew/post-slew time interval.
- 3) For fits to more complicated models (e.g. a power-law over a cutoff power-law), the BAT team has decided to require a chi-square improvement of more than 6 for each extra dof.
Time averaged spectrum fit using the average DRM
Power-law model
Time interval is from   -1.800 sec. to   94.816 sec.

Spectral model in power-law:
------------------------------------------------------------
Parameters  : value       lower 90%   higher 90%
Photon index: 1.06259     ( -0.0451534   0.0449007 )
Norm@50keV  : 8.63100E-03    ( -0.000200423   0.000199663 )
------------------------------------------------------------
#Fit statistic : Chi-Squared =          48.17 using 59 PHA bins.
# Reduced chi-squared =         0.8450 for     57 degrees of freedom
# Null hypothesis probability =   7.913286e-01

Photon flux (15-150 keV)    in 96.62 sec: 0.997824 ( -0.0242867  0.0243957 ) ph/cm2/s
Energy fluence (15-150 keV)             : 8.82584e-06 ( -2.11235e-07  2.11775e-07 ) ergs/cm2
Cutoff power-law model

Time interval is from   -1.800 sec. to   94.816 sec.
Spectral model in the cutoff power-law:
------------------------------------------------------------
Parameters  : value       lower 90%   higher 90%
Photon index: 1.05699     (     )
Epeak [keV] : 1.00000E+04      (   )
Norm@50keV  : 8.67839E-03    ( -0.000200643   0.000193694 )
------------------------------------------------------------
#Fit statistic : Chi-Squared =          48.42 using 59 PHA bins.
# Reduced chi-squared =         0.8646 for     56 degrees of freedom
# Null hypothesis probability =   7.542616e-01

Photon flux (15-150 keV)    in 96.62 sec: 0.997047 ( -0.023573  0.024633 ) ph/cm2/s
Energy fluence (15-150 keV)             : 8.81992e-06 ( -2.04786e-07  2.20429e-07 ) ergs/cm2
Band function
Time interval is from   -1.800 sec. to   94.816 sec.

Spectral model in the Band function:
------------------------------------------------------------
Parameters  : value       lower 90%   higher 90%
alpha       : -0.921453   ( 0.836492   0.836492 )
beta        : -1.06325    ( -0.0449035   0.045164 )
Epeak [keV] : 181.692      ( -61.743 -61.743 )
Norm@50keV   : 1.10471E-02    ( -0.00261268   0 )
------------------------------------------------------------
#Fit statistic : Chi-Squared =          48.13 using 59 PHA bins.
# Reduced chi-squared =         0.8750 for     55 degrees of freedom
# Null hypothesis probability =   7.325151e-01

Photon flux (15-150 keV)    in 96.62 sec:  (    ) ph/cm2/s
Energy fluence (15-150 keV)             : 0 ( 0  0 ) ergs/cm2
Single BB
Spectral model blackbody:
------------------------------------------------------------
Parameters  : value    Lower 90%  Upper 90%
kT [keV]    : 22.8609  (  )
R^2/D10^2   : 2.99815E-02  (   )
(R is the radius in km and D10 is the distance to the source in units of 10 kpc)
------------------------------------------------------------
#Fit statistic : Chi-Squared =         443.67 using 59 PHA bins.
# Reduced chi-squared =         7.7836 for     57 degrees of freedom
# Null hypothesis probability =   2.974325e-61

Energy  Fluence     90% Error
[keV]   [erg/cm2]   [erg/cm2]
15- 25  2.752e-07   1.304e-08
25- 50  1.488e-06   5.556e-08
50-150  5.809e-06   2.048e-07
15-150  7.572e-06   2.203e-07
Thermal bremsstrahlung (OTTB)
Spectral model: thermal bremsstrahlung
------------------------------------------------------------
Parameters  : value         Lower 90%    Upper 90%
kT [keV]    : 199.363       (      )
Norm        : 4.26910       (     )
------------------------------------------------------------
#Fit statistic : Chi-Squared =         422.07 using 59 PHA bins.
# Reduced chi-squared =         7.4048 for     57 degrees of freedom
# Null hypothesis probability =   3.712692e-57

Energy  Fluence     90% Error
[keV]   [erg/cm2]   [erg/cm2]
15- 25  1.027e-06   2.609e-08
25- 50  1.976e-06   4.638e-08
50-150  4.333e-06   1.082e-07
15-150  7.336e-06   1.773e-07
Double BB
Spectral model: bbodyrad<1> + bbodyrad<2>
------------------------------------------------------------
Parameters  : value         Lower 90%    Upper 90%
kT1 [keV]   : 8.71491        (-0.805353      0.878932)
R1^2/D10^2  : 0.403321        (-0.105089      0.151114)
kT2 [keV]   : 41.7413        (-4.39307      6.12033)
R2^2/D10^2  : 4.22820E-03    (-0.00133776   0.00162557)
------------------------------------------------------------
#Fit statistic : Chi-Squared =          50.28 using 59 PHA bins.
# Reduced chi-squared =         0.9142 for     55 degrees of freedom
# Null hypothesis probability =   6.552146e-01

Energy  Fluence     90% Error
[keV]   [erg/cm2]   [erg/cm2]
15- 25  6.552e-07   5.280e-08
25- 50  1.758e-06   8.937e-08
50-150  6.583e-06   4.826e-07
15-150  8.996e-06   4.068e-07
Peak spectrum fit
Power-law model

Time interval is from    0.156 sec. to    1.156 sec.

Spectral model in power-law:
------------------------------------------------------------
Parameters  : value       lower 90%   higher 90%
Photon index: 0.725094     ( -0.0716729   0.0707733 )
Norm@50keV  : 6.69428E-02    ( -0.00269793   0.00268656 )
------------------------------------------------------------
#Fit statistic : Chi-Squared =          50.10 using 59 PHA bins.
# Reduced chi-squared =         0.8790 for     57 degrees of freedom
# Null hypothesis probability =   7.294144e-01

Photon flux (15-150 keV)    in 1 sec: 7.72372 ( -0.300732  0.300965 ) ph/cm2/s
Energy fluence (15-150 keV)             : 8.08014e-07 ( -3.43193e-08  3.44134e-08 ) ergs/cm2
Cutoff power-law model
Time interval is from    0.156 sec. to    1.156 sec.
Spectral model in the cutoff power-law:
------------------------------------------------------------
Parameters  : value       lower 90%   higher 90%
Photon index: 0.717132     ( -0.2387   0.111865 )
Epeak [keV] : 9997.97      (   )
Norm@50keV  : 6.74530E-02    ( -0.0025774   0.022632 )
------------------------------------------------------------
#Fit statistic : Chi-Squared =          50.08 using 59 PHA bins.
# Reduced chi-squared =         0.8943 for     56 degrees of freedom
# Null hypothesis probability =   6.973739e-01

Photon flux (15-150 keV)    in 1 sec: 7.70007 ( -0.29369  0.33882 ) ph/cm2/s
Energy fluence (15-150 keV)             : 8.08918e-07 ( -3.6619e-08  3.3581e-08 ) ergs/cm2
Band function
Time interval is from    0.156 sec. to    1.156 sec.

Spectral model in the Band function:
------------------------------------------------------------
Parameters  : value       lower 90%   higher 90%
alpha       : -0.990578   ( 0.990578   0.990578 )
beta        : -0.725094    ( -0.0707702   0.0716729 )
Epeak [keV] : 12.1382      ( -12.1382 -12.1382 )
Norm@50keV   : 0.100718    ( -0.025374   1.32998e+06 )
------------------------------------------------------------
#Fit statistic : Chi-Squared =          50.10 using 59 PHA bins.
# Reduced chi-squared =         0.9109 for     55 degrees of freedom
# Null hypothesis probability =   6.618772e-01

Photon flux (15-150 keV)    in 1 sec:  (    ) ph/cm2/s
Energy fluence (15-150 keV)             : 0 ( 0  0 ) ergs/cm2
Single BB
Spectral model blackbody:
------------------------------------------------------------
Parameters  : value    Lower 90%  Upper 90%
kT [keV]    : 27.4729  (  )
R^2/D10^2   : 0.151332  (   )
(R is the radius in km and D10 is the distance to the source in units of 10 kpc)
------------------------------------------------------------
#Fit statistic : Chi-Squared =         141.05 using 59 PHA bins.
# Reduced chi-squared =         2.4745 for     57 degrees of freedom
# Null hypothesis probability =   4.477632e-09

Energy  Fluence     90% Error
[keV]   [erg/cm2]   [erg/cm2]
15- 25  1.883e-08   1.545e-09
25- 50  1.118e-07   7.100e-09
50-150  6.137e-07   3.640e-08
15-150  7.444e-07   3.650e-08
Thermal bremsstrahlung (OTTB)
Spectral model: thermal bremsstrahlung
------------------------------------------------------------
Parameters  : value         Lower 90%    Upper 90%
kT [keV]    : 199.363       (      )
Norm        : 29.0061       (     )
------------------------------------------------------------
#Fit statistic : Chi-Squared =         398.04 using 59 PHA bins.
# Reduced chi-squared =         6.9831 for     57 degrees of freedom
# Null hypothesis probability =   1.236413e-52

Energy  Fluence     90% Error
[keV]   [erg/cm2]   [erg/cm2]
15- 25  7.223e-08   3.065e-09
25- 50  1.389e-07   7.000e-09
50-150  3.047e-07   1.405e-08
15-150  5.159e-07   2.540e-08
Double BB
Spectral model: bbodyrad<1> + bbodyrad<2>
------------------------------------------------------------
Parameters  : value         Lower 90%    Upper 90%
kT1 [keV]   : 8.56719        (-1.70153      2.11933)
R1^2/D10^2  : 2.21740        (-1.02783      2.23857)
kT2 [keV]   : 41.4661        (-5.6791      9.80143)
R2^2/D10^2  : 4.26583E-02    (-0.0188329   0.0226164)
------------------------------------------------------------
#Fit statistic : Chi-Squared =          50.80 using 59 PHA bins.
# Reduced chi-squared =         0.9236 for     55 degrees of freedom
# Null hypothesis probability =   6.358701e-01

Energy  Fluence     90% Error
[keV]   [erg/cm2]   [erg/cm2]
15- 25  4.004e-08   8.260e-09
25- 50  1.241e-07   1.692e-08
50-150  6.543e-07   7.685e-08
15-150  8.185e-07   1.056e-07
Pre-slew spectrum (Pre-slew PHA with pre-slew DRM)
Power-law model

Spectral model in power-law:
------------------------------------------------------------
Parameters  : value       lower 90%   higher 90%
Photon index: 1.06259     ( -0.0451534   0.0449007 )
Norm@50keV  : 8.63100E-03    ( -0.000200423   0.000199663 )
------------------------------------------------------------
#Fit statistic : Chi-Squared =          48.17 using 59 PHA bins.
# Reduced chi-squared =         0.8450 for     57 degrees of freedom
# Null hypothesis probability =   7.913286e-01

Photon flux (15-150 keV)    in 96.62 sec: 0.997824 ( -0.0242867  0.0243957 ) ph/cm2/s
Energy fluence (15-150 keV)             : 8.82584e-06 ( -2.11235e-07  2.11775e-07 ) ergs/cm2
Cutoff power-law model

Spectral model in the cutoff power-law:
------------------------------------------------------------
Parameters  : value       lower 90%   higher 90%
Photon index: 1.05699     (     )
Epeak [keV] : 1.00000E+04      (   )
Norm@50keV  : 8.67839E-03    ( -0.000200643   0.000193694 )
------------------------------------------------------------
#Fit statistic : Chi-Squared =          48.42 using 59 PHA bins.
# Reduced chi-squared =         0.8646 for     56 degrees of freedom
# Null hypothesis probability =   7.542616e-01

Photon flux (15-150 keV)    in 96.62 sec: 0.997047 ( -0.023573  0.024633 ) ph/cm2/s
Energy fluence (15-150 keV)             : 8.81992e-06 ( -2.04786e-07  2.20429e-07 ) ergs/cm2
Band function

Spectral model in the Band function:
------------------------------------------------------------
Parameters  : value       lower 90%   higher 90%
alpha       : -0.836492   ( 0.836492   0.836492 )
beta        : -1.06260    ( -0.0449035   0.045164 )
Epeak [keV] : 61.7430      ( -61.743 -61.743 )
Norm@50keV   : 1.49420E-02    ( -0.00650514   0 )
------------------------------------------------------------
#Fit statistic : Chi-Squared =          48.17 using 59 PHA bins.
# Reduced chi-squared =         0.8758 for     55 degrees of freedom
# Null hypothesis probability =   7.311658e-01

Photon flux (15-150 keV)    in 96.62 sec:  (    ) ph/cm2/s
Energy fluence (15-150 keV)             : 0 ( 0  0 ) ergs/cm2
S(25-50 keV) vs. S(50-100 keV) plot
S(25-50 keV)  = 1.70e-06
S(50-100 keV) = 3.26e-06
T90 vs. Hardness ratio plot
T90                                   = 78.8679999709129 sec.
Hardness ratio (energy fluence ratio) = 1.91765
Color vs. Color plot
Count Ratio  (25-50 keV) / (15-25 keV) = 1.62913
Count Ratio (50-100 keV) / (15-25 keV) = 1.77416
Mask shadow pattern
IMX = -6.312546461430615E-01, IMY = -5.451091616165411E-03
TIME vs. PHA plot around the trigger time
TIME vs. DetID plot around the trigger time
100 us light curve (15-350 keV)
Spacecraft aspect plot
Bright source in the pre-burst/pre-slew/post-slew images
Pre-burst image of 15-350 keV band
Time interval of the image:
-179.896000 -1.800000

# RAcent  DECcent POSerr Theta    Phi  PeakCts   SNR AngSep     Name
#  [deg]    [deg]    ['] [deg]  [deg]                   [']
144.4444  12.0801    2.3  39.0  162.2   1.7342   5.0 ------	UNKNOWN
129.7968   0.6346    4.6  54.1  177.2   2.2006   2.5 ------	UNKNOWN
271.4235  62.2951    2.9  56.8   -5.2   3.7787   4.0 ------	UNKNOWN
101.8831  16.8880    3.8  54.1 -143.0   3.7528   3.1 ------	UNKNOWN
 93.3142  41.1347    2.5  43.1 -112.2   4.1873   4.6 ------	UNKNOWN
Pre-slew background subtracted image of 15-350 keV band
Time interval of the image:
-1.800000 94.816000

# RAcent  DECcent POSerr Theta    Phi  PeakCts   SNR AngSep     Name
#  [deg]    [deg]    ['] [deg]  [deg]                   [']
135.3003  -2.7463    1.8  55.6  169.6   6.5945   6.3 ------	UNKNOWN
185.3510  51.9254    2.3  18.7   37.5   0.8663   5.0 ------	UNKNOWN
136.4724  21.4826    0.2  32.3  179.5  12.7599  60.5 ------	UNKNOWN
262.4146  76.1546    2.0  45.6  -16.5   1.7878   5.9 ------	UNKNOWN
Post-slew image of 15-350 keV band
Time interval of the image:
247.404580 962.199000

# RAcent  DECcent POSerr Theta    Phi  PeakCts   SNR AngSep     Name
#  [deg]    [deg]    ['] [deg]  [deg]                   [']
244.9781 -15.6416    0.4  29.3   60.5  27.0111  32.8    0.1	Sco X-1
254.2454  35.3921    4.6  24.0 -146.6   1.4165   2.5   10.8	Her X-1
256.4835 -36.5135    3.1  47.9   37.5  -9.1992  -3.7    5.9	GX 349+2
263.1202 -24.6950   29.0  36.7   27.3   0.3326   0.4    6.8	GX 1+4
268.3567  -1.3336    7.8  17.5   -6.2   0.8713   1.5    7.2	SW J1753.5-0127
270.3468 -25.0247    3.7  38.9   17.2   2.4072   3.1    4.7	GX 5-1
270.4002 -25.7011    5.8  39.6   17.6   1.5866   2.0    5.9	GRS 1758-258
273.9063 -13.9922    3.1  30.8    2.8   2.3009   3.8    6.4	GX 17+2
276.0203 -30.3036   72.1  45.8   13.7   0.1835   0.2    6.2	H1820-303
284.8408 -24.8773  878.0  45.7    0.4   0.0131   0.0   10.9	HT1900.1-2455
288.7843  10.9294    1.2  31.8  -54.7   8.5203   9.8    1.3	GRS 1915+105
262.8758 -33.9086   10.3  45.8   30.1   1.8023   1.1    7.2	GX 354-0
273.8078  -7.0146    2.8  25.3   -6.5   2.3979   4.2 ------	UNKNOWN
294.0051 -29.4614    2.4  54.7   -3.1   8.9023   4.9 ------	UNKNOWN
269.6943  57.3559    4.2  47.1 -132.6   5.7675   2.8 ------	UNKNOWN
286.0595  46.4473    3.6  43.1 -112.4   8.7316   3.2 ------	UNKNOWN
Plot creation:
Sun May 31 01:47:43 EDT 2015