Click here for the BAT GCN circular template
Image
Pre-slew 15-350 keV image (Event data; bkg subtracted)
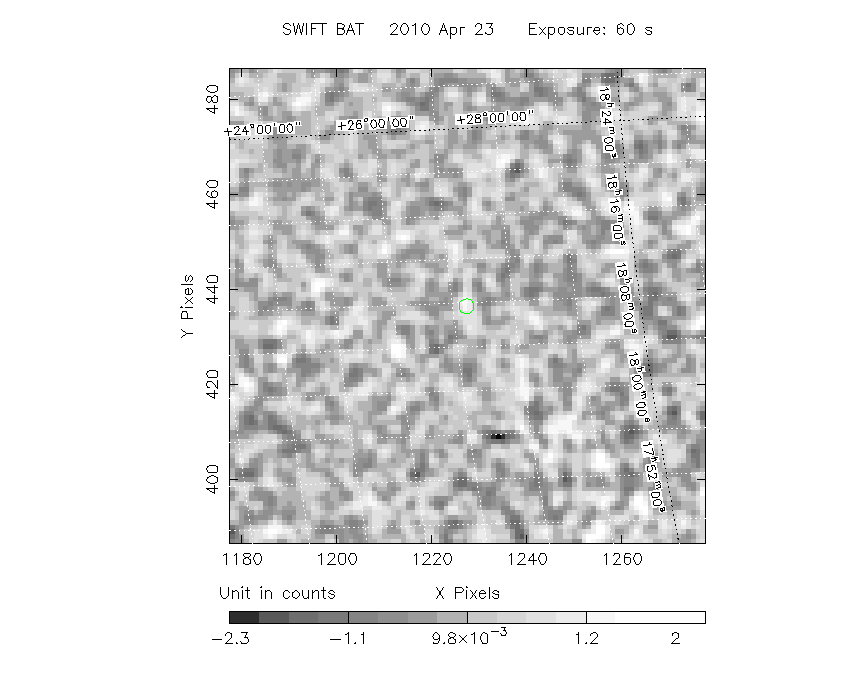
#   RAcent  DECcent POSerr  Theta    Phi     Peak Cts     SNR  Name
  271.9177 +27.2305 0.0665   36.3  173.4       1.5169     2.9  TRIG_00420256
------------------------------------------

Foreground time interval of the image:
 -2.984  56.864 (delta_t =  59.848 [sec])
Background time interval of the image:
 -5.499  -2.984 (delta_t =   2.515 [sec])
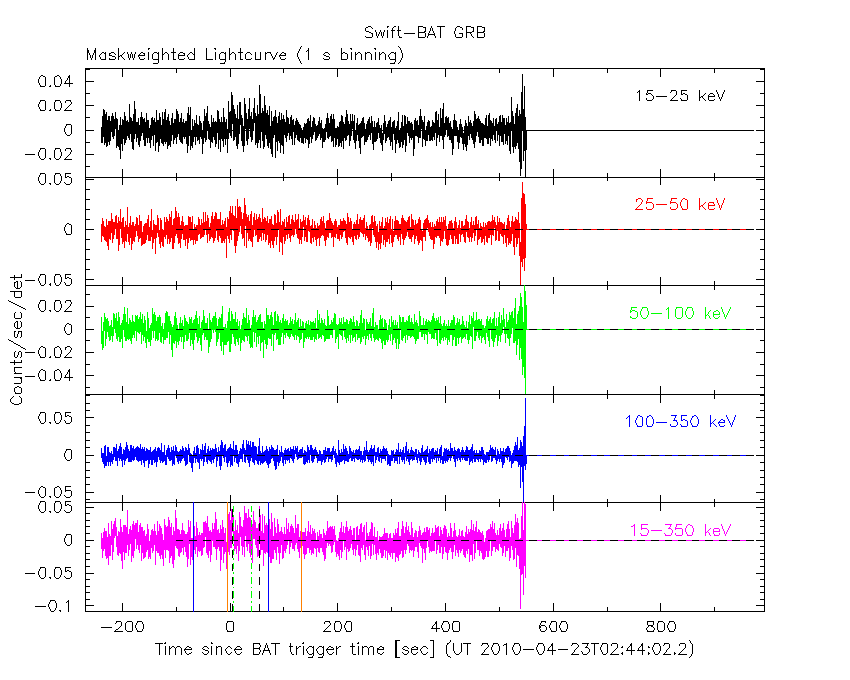
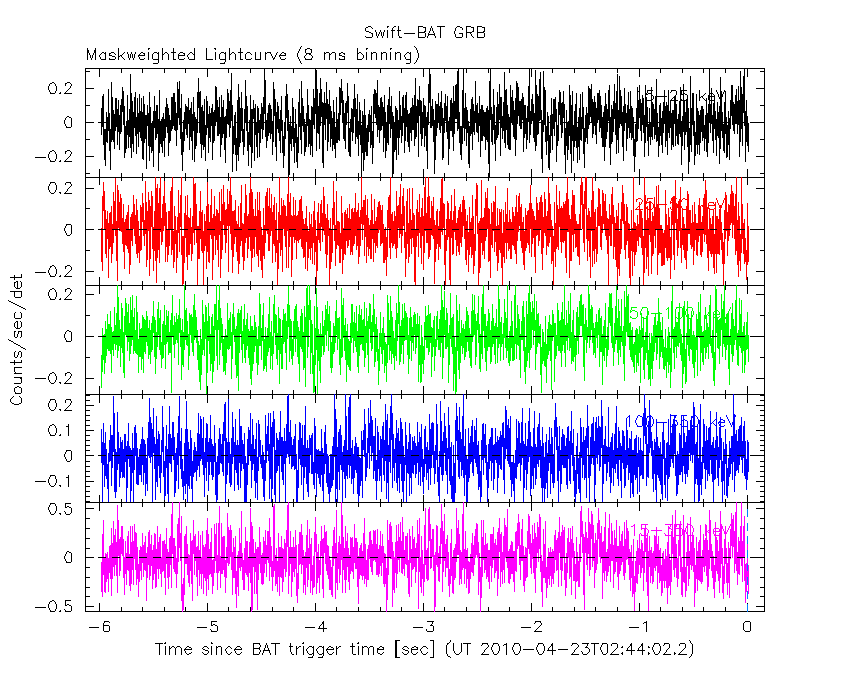
Lightcurves
Notes:
- 1) All plots contain as much data as has been downloaded to date.
- 2) Multiple plots of different time binning/intervals are shown to cover all scenarios of short/long GRBs, rate/image triggers, and real/false positives.
- 3) For all the mask-weighted lightcurves, the y-axis units are counts/sec/det where a det is 0.4 x 0.4 = 0.16 sq cm.
- 4) The verticle lines correspond to following: green dotted lines are T50 interval, black dotted lines are T90 interval, blue solid line(s) is a spacecraft slew start time, and orange solid line(s) is a spacecraft slew end time.
- 5) Time of each bin is in the middle of the bin.
1 s binning
From T0-310 s to T0+310 s

From T100_start - 20 s to T100_end + 30 s

Full time interval
64 ms binning
Full time interval

From T100_start to T100_end

From T0-5 sec to T0+5 sec

16 ms binning
From T100_start-5 s to T100_start+5 s

Blue+Cyan dotted lines: Time interval of the scaled map
From 0.000000 to 64.000000
8 ms binning
From T100_start-3 s to T100_start+3 s
Blue+Cyan dotted lines: Time interval of the scaled map
From 0.000000 to 64.000000
2 ms binning
From T100_start-1 s to T100_start+1 s

Blue+Cyan dotted lines: Time interval of the scaled map
From 0.000000 to 64.000000
SN=5 or 10 sec. binning (whichever binning is satisfied first)
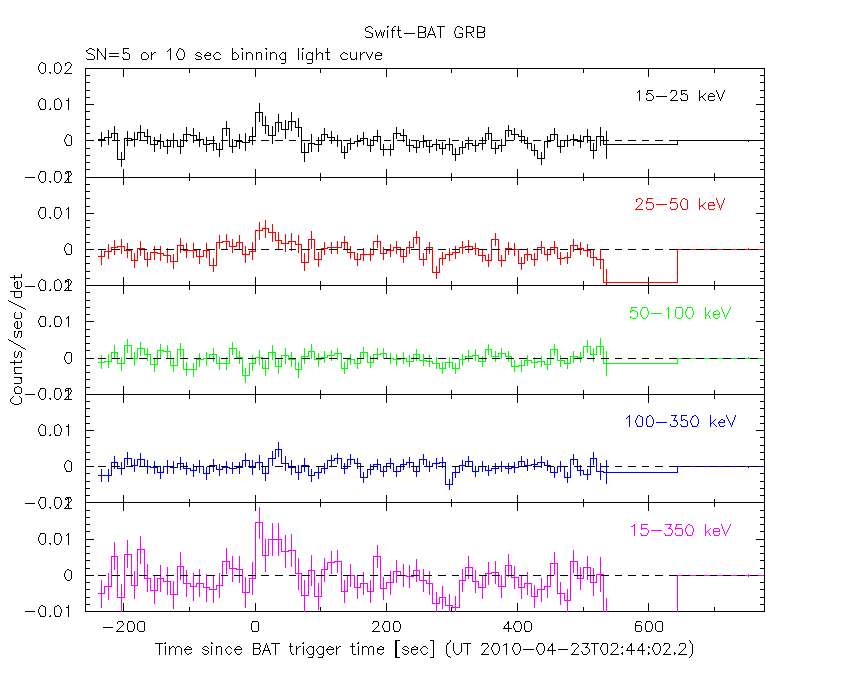
SN=5 or 10 sec. binning (T < 200 sec)

The mask-weighted light curves based on cleaned DPHs

Spectra
Notes:
- 1) The fitting includes the systematic errors.
- 2) For long bursts, a spectral fit of the pre-slew DRM will introduce some errors in both a spectral shape and a normalization if the PHA file contains a lot of the slew/post-slew time interval.
- 3) For fits to more complicated models (e.g. a power-law over a cutoff power-law), the BAT team has decided to require a chi-square improvement of more than 6 for each extra dof.
- 4) For short bursts (T90<1sec), the specrtum is also fit with Blackbody, OTTB, and Double Blackbody.
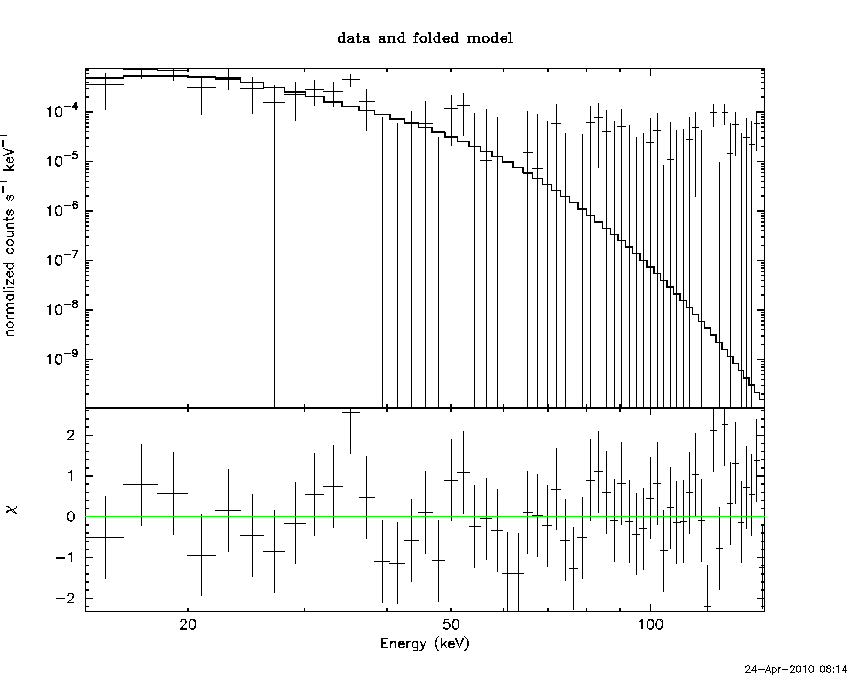
Time averaged spectrum fit using the pre-slew DRM
Power-law model

Time interval is from   -2.984 sec. to   56.864 sec.

Spectral model in power-law:
------------------------------------------------------------
Parameters  : value       lower 90%   higher 90%
Photon index: 2.92078     ( -0.598545   0.769431 )
Norm@50keV  : 3.43720E-04    ( -0.00034372   0.000207829 )
------------------------------------------------------------
# Chi-Squared =          53.62 using 59 PHA bins.
# Reduced chi-squared =         0.9406 for     57 degrees of freedom
# Null hypothesis probability =   6.028055e-01

Photon flux (15-150 keV)    in 59.85 sec: 8.92879E-02 ( -0.0243142  0.0244077 ) ph/cm2/s
Energy fluence (15-150 keV)             : 2.38597e-07 ( -7.93713e-08  8.97989e-08 ) ergs/cm2
Cutoff power-law model
Time interval is from   -2.984 sec. to   56.864 sec.
Spectral model in the cutoff power-law:
------------------------------------------------------------
Parameters  : value       lower 90%   higher 90%
Photon index: -0.341675     (     )
Epeak [keV] : 20.5087      (   )
Norm@50keV  : 7.27628E-02    (     )
------------------------------------------------------------
# Chi-Squared =          50.98 using 59 PHA bins.
# Reduced chi-squared =         0.9104 for     56 degrees of freedom
# Null hypothesis probability =   6.647898e-01

Photon flux (15-150 keV)    in 59.85 sec: 8.75256E-02 ( -0.0231031  0.0232804 ) ph/cm2/s
Energy fluence (15-150 keV)             : 2.06727e-07 ( -5.8592e-08  6.59517e-08 ) ergs/cm2
Band function

Time interval is from   -2.984 sec. to   56.864 sec.

Spectral model in the Band function:
------------------------------------------------------------
Parameters  : value       lower 90%   higher 90%
alpha       : 0.671861   ( 1.5368   6.02246 )
beta        : -8.42723    ( 5.28665   14.6575 )
Epeak [keV] : 21.4970      ( -9.50882 89.8874 )
Norm@50keV   : 0.120148    ( -0.12015   140.682 )
------------------------------------------------------------
# Chi-Squared =          50.93 using 59 PHA bins.
# Reduced chi-squared =         0.9259 for     55 degrees of freedom
# Null hypothesis probability =   6.309986e-01

Photon flux (15-150 keV)    in 59.85 sec:  (    ) ph/cm2/s
Energy fluence (15-150 keV)             : 0 ( 0  0 ) ergs/cm2
Single BB

Spectral model blackbody:
------------------------------------------------------------
Parameters  : value    Lower 90%  Upper 90%
kT [keV]    : 5.85164  (-1.34015  1.57409)
R^2/D10^2   : 0.386436  (-0.252739   0.859187)
(R is the radius in km and D10 is the distance to the source in units of 10 kpc)
------------------------------------------------------------
# Chi-Squared =          50.88 using 59 PHA bins.
# Reduced chi-squared =         0.8927 for     57 degrees of freedom
# Null hypothesis probability =   7.024899e-01

Energy  Fluence     90% Error
[keV]   [erg/cm2]   [erg/cm2]
15- 25  1.014e-07   5.856e-08
25- 50  9.572e-08   6.087e-08
50-150  7.902e-09   6.898e-09
15-150  2.050e-07   1.232e-07
Thermal bremsstrahlung (OTTB)

Spectral model: thermal bremsstrahlung
------------------------------------------------------------
Parameters  : value         Lower 90%    Upper 90%
kT [keV]    : 18.5009       (-7.38333      14.1393)
Norm        : 1.21358       (-0.581863     1.22708)
------------------------------------------------------------
# Chi-Squared =          51.84 using 59 PHA bins.
# Reduced chi-squared =         0.9094 for     57 degrees of freedom
# Null hypothesis probability =   6.685664e-01

Energy  Fluence     90% Error
[keV]   [erg/cm2]   [erg/cm2]
15- 25  1.051e-07   5.704e-08
25- 50  8.652e-08   5.063e-08
50-150  2.266e-08   1.940e-08
15-150  2.143e-07   1.127e-07
Double BB

------------------------------------------------------------
Parameters  : value         Lower 90%    Upper 90%
kT1 [keV]   : 1.28188E-04        (      )
R1^2/D10^2  : 0.880772        (-0.880772      -0.880772)
kT2 [keV]   : 5.85163        (-1.34015      1.57408)
R2^2/D10^2  : 0.386438    (-0.252737   0.859192)
------------------------------------------------------------
# Chi-Squared =          50.96 using 59 PHA bins.
# Chi-Squared =          50.88 using 59 PHA bins.
# Reduced chi-squared =         0.9265 for     55 degrees of freedom
# Reduced chi-squared =         0.9252 for     55 degrees of freedom
# Null hypothesis probability =   6.297155e-01
# Null hypothesis probability =   6.325501e-01

Energy  Fluence     90% Error
[keV]   [erg/cm2]   [erg/cm2]
15- 25  1.028e-07   4.216e-06
25- 50  9.387e-08   1.385e-05
50-150  1.071e-08   7.661e-05
15-150  2.074e-07   1.389e-04
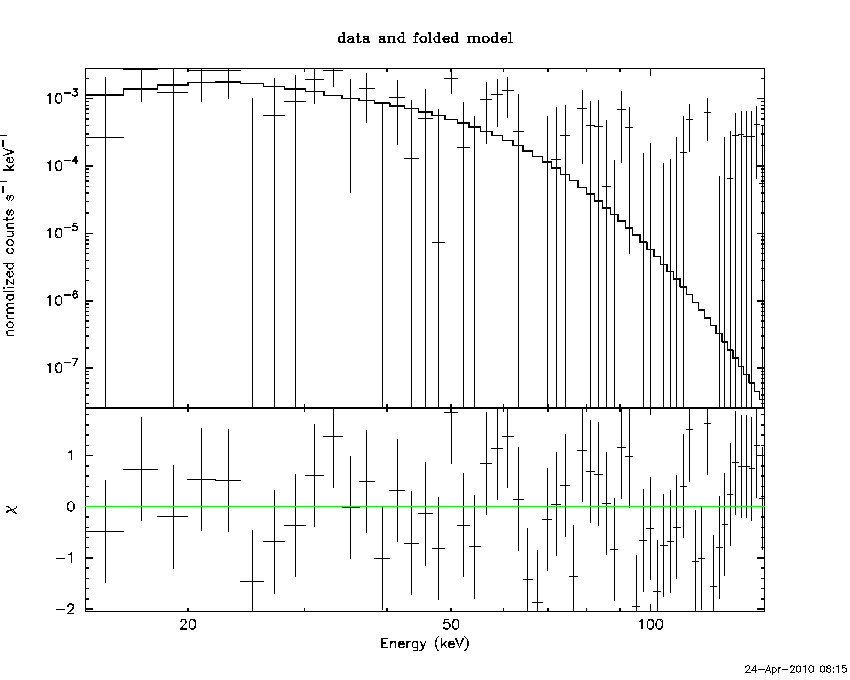
Peak spectrum fit
Power-law model

Time interval is from   27.344 sec. to   28.344 sec.

Spectral model in power-law:
------------------------------------------------------------
Parameters  : value       lower 90%   higher 90%
Photon index: 2.17946     ( -0.691419   0.891751 )
Norm@50keV  : 2.63990E-03    ( -0.00263836   0.00149476 )
------------------------------------------------------------
# Chi-Squared =          55.39 using 59 PHA bins.
# Reduced chi-squared =         0.9717 for     57 degrees of freedom
# Null hypothesis probability =   5.358250e-01

Photon flux (15-150 keV)    in 1 sec: 0.432164 ( -0.186256  0.186259 ) ph/cm2/s
Energy fluence (15-150 keV)             : 2.47338e-08 ( -1.19992e-08  1.32779e-08 ) ergs/cm2
Cutoff power-law model

Time interval is from   27.344 sec. to   28.344 sec.
Spectral model in the cutoff power-law:
------------------------------------------------------------
Parameters  : value       lower 90%   higher 90%
Photon index: -1.52703     ( 1.58498   3.60183 )
Epeak [keV] : 36.8802      ( -36.8967 21.7199 )
Norm@50keV  : 0.437360    ( -0.538475   38.6066 )
------------------------------------------------------------
# Chi-Squared =          52.52 using 59 PHA bins.
# Reduced chi-squared =         0.9379 for     56 degrees of freedom
# Null hypothesis probability =   6.073300e-01

Photon flux (15-150 keV)    in 1 sec: 0.408563 ( -0.166821  0.183263 ) ph/cm2/s
Energy fluence (15-150 keV)             : 2.14179e-08 ( -8.9826e-09  1.12437e-08 ) ergs/cm2
Band function

Time interval is from   27.344 sec. to   28.344 sec.

Spectral model in the Band function:
------------------------------------------------------------
Parameters  : value       lower 90%   higher 90%
alpha       : 2.06652   ( -4.11061   -2.09287 )
beta        : -9.99971    ( 10823.6   10833.6 )
Epeak [keV] : 36.7237      ( -31.3396 21.6632 )
Norm@50keV   : 0.933889    ( -0.933891   29.9121 )
------------------------------------------------------------
# Chi-Squared =          52.50 using 59 PHA bins.
# Reduced chi-squared =         0.9546 for     55 degrees of freedom
# Null hypothesis probability =   5.705644e-01

Photon flux (15-150 keV)    in 1 sec:  (    ) ph/cm2/s
Energy fluence (15-150 keV)             : 0 ( 0  0 ) ergs/cm2
Single BB

Spectral model blackbody:
------------------------------------------------------------
Parameters  : value    Lower 90%  Upper 90%
kT [keV]    : 9.49004  (-2.94918  4.0527)
R^2/D10^2   : 0.277561  (-0.277561   0.886788)
(R is the radius in km and D10 is the distance to the source in units of 10 kpc)
------------------------------------------------------------
# Chi-Squared =          52.49 using 59 PHA bins.
# Reduced chi-squared =         0.9209 for     57 degrees of freedom
# Null hypothesis probability =   6.446857e-01

Energy  Fluence     90% Error
[keV]   [erg/cm2]   [erg/cm2]
15- 25  4.990e-09   3.228e-09
25- 50  1.150e-08   7.345e-09
50-150  5.148e-09   4.190e-09
15-150  2.164e-08   1.386e-08
Thermal bremsstrahlung (OTTB)

Spectral model: thermal bremsstrahlung
------------------------------------------------------------
Parameters  : value         Lower 90%    Upper 90%
kT [keV]    : 44.4057       (-25.6892      120.299)
Norm        : 2.74047       (-1.42228     2.85222)
------------------------------------------------------------
# Chi-Squared =          54.04 using 59 PHA bins.
# Reduced chi-squared =         0.9481 for     57 degrees of freedom
# Null hypothesis probability =   5.867219e-01

Energy  Fluence     90% Error
[keV]   [erg/cm2]   [erg/cm2]
15- 25  6.500e-09   4.159e-09
25- 50  8.929e-09   6.060e-09
50-150  7.715e-09   6.120e-09
15-150  2.314e-08   1.572e-08
Double BB
Spectral model: bbodyrad<1> + bbodyrad<2>
------------------------------------------------------------
Parameters  : value         Lower 90%    Upper 90%
kT1 [keV]   : 0.168724        (-0.168724      -0.168724)
R1^2/D10^2  : 1.26944        (-1.26944      -1.26944)
kT2 [keV]   : 9.48973        (-2.94887      4.05301)
R2^2/D10^2  : 0.277595    (-0.212486   0.886643)
------------------------------------------------------------
# Chi-Squared =          52.49 using 59 PHA bins.
# Reduced chi-squared =         0.9544 for     55 degrees of freedom
# Null hypothesis probability =   5.710454e-01

Energy  Fluence     90% Error
[keV]   [erg/cm2]   [erg/cm2]
15- 25  0.000e+00   0.000e+00
25- 50  0.000e+00   0.000e+00
50-150  0.000e+00   0.000e+00
15-150  0.000e+00   0.000e+00
Pre-slew spectrum (Pre-slew PHA with pre-slew DRM)
Power-law model

Spectral model in power-law:
------------------------------------------------------------
Parameters  : value       lower 90%   higher 90%
Photon index: 2.92078     ( -0.598545   0.769431 )
Norm@50keV  : 3.43720E-04    ( -0.00034372   0.000207829 )
------------------------------------------------------------
# Chi-Squared =          53.62 using 59 PHA bins.
# Reduced chi-squared =         0.9406 for     57 degrees of freedom
# Null hypothesis probability =   6.028055e-01

Photon flux (15-150 keV)    in 59.85 sec: 8.92879E-02 ( -0.0243142  0.0244077 ) ph/cm2/s
Energy fluence (15-150 keV)             : 2.38597e-07 ( -7.93713e-08  8.97989e-08 ) ergs/cm2
Cutoff power-law model

Spectral model in the cutoff power-law:
------------------------------------------------------------
Parameters  : value       lower 90%   higher 90%
Photon index: -0.341675     (     )
Epeak [keV] : 20.5087      (   )
Norm@50keV  : 7.27628E-02    (     )
------------------------------------------------------------
# Chi-Squared =          50.98 using 59 PHA bins.
# Reduced chi-squared =         0.9104 for     56 degrees of freedom
# Null hypothesis probability =   6.647898e-01

Photon flux (15-150 keV)    in 59.85 sec: 8.75256E-02 ( -0.0231031  0.0232804 ) ph/cm2/s
Energy fluence (15-150 keV)             : 2.06727e-07 ( -5.8592e-08  6.59517e-08 ) ergs/cm2
Band function

Spectral model in the Band function:
------------------------------------------------------------
Parameters  : value       lower 90%   higher 90%
alpha       : 0.671861   ( 1.5368   6.04462 )
beta        : -8.42723    ( 5.28665   14.6575 )
Epeak [keV] : 21.4970      ( -9.50882 89.8874 )
Norm@50keV   : 0.120148    ( -0.12015   140.682 )
------------------------------------------------------------
# Chi-Squared =          50.93 using 59 PHA bins.
# Reduced chi-squared =         0.9259 for     55 degrees of freedom
# Null hypothesis probability =   6.309986e-01

Photon flux (15-150 keV)    in 59.85 sec:  (    ) ph/cm2/s
Energy fluence (15-150 keV)             : 0 ( 0  0 ) ergs/cm2
S(25-50 keV) vs. S(50-100 keV) plot

S(25-50 keV)  = 7.99195e-08
S(50-100 keV) = 4.22184e-08
T90 vs. Hardness ratio plot

T90                                   = 50.2479999065399 sec.
Hardness ratio (energy fluence ratio) = 0.528262
Color vs. Color plot

Count Ratio  (25-50 keV) / (15-25 keV) = 0.703915
Count Ratio (50-100 keV) / (15-25 keV) = -0.0199516
Mask shadow pattern

IMX = -7.304218281600970E-01, IMY = -8.444689804430922E-02
TIME vs. PHA plot around the trigger time

Blue+Cyan dotted lines: Time interval of the scaled map
From 0.000000 to 64.000000
TIME vs. DetID plot around the trigger time

Blue+Cyan dotted lines: Time interval of the scaled map
From 0.000000 to 64.000000
100 us light curve (15-350 keV)

Blue+Cyan dotted lines: Time interval of the scaled map
From 0.000000 to 64.000000
Spacecraft aspect plot

Bright source in the pre-burst/pre-slew/post-slew images
Pre-burst image of 15-350 keV band
Time interval of the image:
-5.499400 -2.984000

# RAcent  DECcent POSerr Theta    Phi  PeakCts   SNR AngSep     Name
#  [deg]    [deg]    ['] [deg]  [deg]                   [']
245.0484 -15.6786    5.6  33.3   77.6   0.0760   2.0    4.6	Sco X-1
254.5883  35.2698    6.3  49.1  157.5  -0.0953  -1.8    7.7	Her X-1
256.0072 -37.9351    2.2  35.7   34.2   0.1582   5.2    5.5	4U 1700-377
256.5912 -36.4816    5.2  34.3   35.3  -0.0631  -2.2    8.3	GX 349+2
263.1707 -24.8918   17.2  21.9   42.9  -0.0129  -0.7   12.4	GX 1+4
264.8965 -44.4940    7.1  37.9   19.0  -0.0427  -1.6    7.1	4U 1735-44
268.2147  -1.3128    0.0  12.4  128.1   0.0115   0.7   12.4	SW J1753.5-0127
270.1189 -24.9301    0.0  18.3   27.8   0.0110   0.7   12.7	GX 5-1
270.4562 -25.6116    4.7  18.7   26.0   0.0410   2.4   11.5	GRS 1758-258
274.1024 -14.1823    4.0   7.1   39.0   0.0442   2.9   10.4	GX 17+2
275.7540 -30.2219    0.0  21.9    9.4   0.0171   1.0   12.4	H1820-303
285.1827 -24.7807    5.0  17.6  -17.6   0.0379   2.3   11.6	HT1900.1-2455
288.7011  10.8451    2.5  21.9 -148.4   0.0775   4.6    8.3	GRS 1915+105
299.5726  35.2039    3.9  48.0 -153.2   0.1106   2.9    0.9	Cyg X-1
307.9711  40.9494  176.5  56.4 -150.0  -0.0064  -0.1    6.3	Cyg X-3
319.3591 -30.6121    2.0  44.2  -50.8   0.2490   5.7 ------	UNKNOWN
Pre-slew background subtracted image of 15-350 keV band
Time interval of the image:
-2.984000 56.864000

# RAcent  DECcent POSerr Theta    Phi  PeakCts   SNR AngSep     Name
#  [deg]    [deg]    ['] [deg]  [deg]                   [']
244.8423 -15.6726    6.8  33.6   77.7   1.4834   1.7    8.2	Sco X-1
254.3237  35.1732   86.5  49.3  157.1  -0.1706  -0.1   12.1	Her X-1
256.0019 -37.9910    2.9  35.7   34.2  -2.8583  -4.0    8.8	4U 1700-377
256.6006 -36.5087    4.7  34.3   35.3   1.6226   2.4    9.5	GX 349+2
263.1019 -24.7749   11.6  21.9   43.4   0.4512   1.0    5.4	GX 1+4
264.9164 -44.5130    3.6  37.8   19.0   1.9801   3.2    8.3	4U 1735-44
268.4328  -1.3012    6.9  12.3  128.7  -0.6422  -1.7    9.9	SW J1753.5-0127
270.3010 -25.0175   27.2  18.2   27.5   0.1662   0.4    3.8	GX 5-1
270.1428 -25.7382    8.8  18.9   26.9   0.5194   1.3    8.6	GRS 1758-258
273.9960 -14.0248    7.9   7.0   41.3   0.5243   1.5    0.9	GX 17+2
275.8720 -30.5181  180.6  22.1    9.1   0.0264   0.1    9.5	H1820-303
285.1928 -24.8968   11.1  17.6  -17.5  -0.3970  -1.0    8.7	HT1900.1-2455
288.8502  10.7994    2.8  21.9 -148.4  -1.6624  -4.1    9.3	GRS 1915+105
299.4735  35.2099    3.4  48.0 -153.6   2.9915   3.4    5.7	Cyg X-1
307.9886  41.0468    8.7  56.5 -150.3  -3.2534  -1.3    7.9	Cyg X-3
300.4514 -53.4250    2.0  48.3  -14.2   4.5745   5.8 ------	UNKNOWN
290.5683  48.1637    2.2  57.7 -167.2  11.2829   5.3 ------	UNKNOWN
Post-slew image of 15-350 keV band
Time interval of the image:
133.500600 470.100610

# RAcent  DECcent POSerr Theta    Phi  PeakCts   SNR AngSep     Name
#  [deg]    [deg]    ['] [deg]  [deg]                   [']
254.3417  35.4571    8.1  17.1  149.0  -0.7950  -1.4    8.9	Her X-1
268.2543  -1.3437   11.7  28.7   33.2   0.6913   1.0    9.4	SW J1753.5-0127
274.1014 -14.0760    6.9  41.3   22.3   1.7058   1.7    6.0	GX 17+2
285.0133 -24.9479    7.0  53.6   10.8   2.3783   1.6    2.1	HT1900.1-2455
288.7318  10.9363    2.9  22.7  -22.0   2.2434   3.9    4.0	GRS 1915+105
299.6020  35.2003    0.7  25.0  -90.0  12.3885  17.5    0.6	Cyg X-1
308.0970  40.9467    3.8  32.7  -98.7   3.0902   3.1    0.7	Cyg X-3
212.6863  79.0748    2.3  57.7 -165.5  10.4314   5.1 ------	UNKNOWN
Plot creation:
Sat Apr 24 08:16:07 EDT 2010