Click here for the BAT GCN circular template
Image
Pre-slew 15.0-350.0 keV image (Event data)

#   RAcent    DECcent   POSerr    Theta     Phi              Peak Cts       SNR   Name
  299.1724   -26.4689   0.0205    28.5240   -83.3437         0.7028538      9.392 TRIG_00420398

Foreground time interval of the image:
 -2.064  18.285 (delta_t =  20.349 [sec])
Background time interval of the image:
-239.816  -2.064 (delta_t = 237.752 [sec])
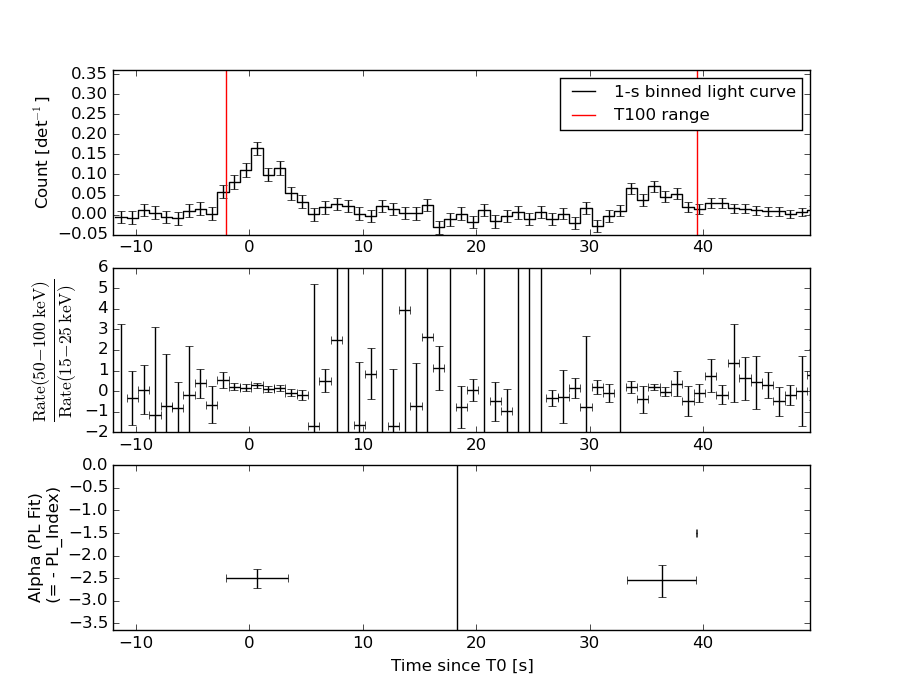
Lightcurves
Notes:
- 1) The mask-weighted light curves are using the flight position.
- 2) Multiple plots of different time binning/intervals are shown to cover all scenarios of short/long GRBs, rate/image triggers, and real/false positives.
- 3) For all the mask-weighted lightcurves, the y-axis units are counts/sec/det where a det is 0.4 x 0.4 = 0.16 sq cm.
- 4) The verticle lines correspond to following: green dotted lines are T50 interval, black dotted lines are T90 interval, blue solid line(s) is a spacecraft slew start time, and orange solid line(s) is a spacecraft slew end time.
- 5) Time of each bin is in the middle of the bin.
1 s binning
From T0-310 s to T0+310 s
From T100_start - 20 s to T100_end + 30 s
Full time interval
64 ms binning
Full time interval
From T100_start to T100_end
From T0-5 sec to T0+5 sec
16 ms binning
From T100_start-5 s to T100_start+5 s
Blue+Cyan dotted lines: Time interval of the scaled map
From 0.000000 to 1.024000
8 ms binning
From T100_start-3 s to T100_start+3 s
Blue+Cyan dotted lines: Time interval of the scaled map
From 0.000000 to 1.024000
2 ms binning
From T100_start-1 s to T100_start+1 s

Blue+Cyan dotted lines: Time interval of the scaled map
From 0.000000 to 1.024000
SN=5 or 10 sec. binning (whichever binning is satisfied first)
SN=5 or 10 sec. binning (T < 200 sec)
Quad-rate summed light curves (from T0-300s to T0+1000s)
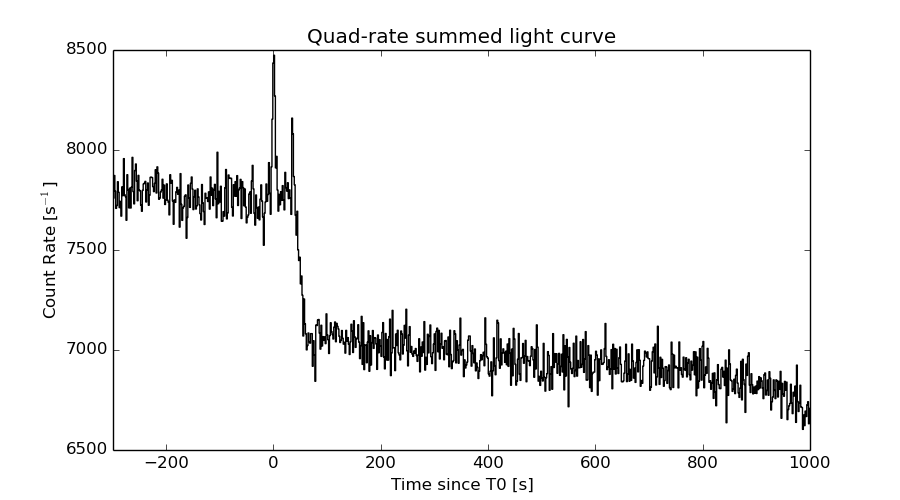
The mask-weighted light curves based on cleaned DPHs

Spectral Evolution
Spectra
Notes:
- 1) The fitting includes the systematic errors.
- 2) When the burst includes telescope slew time periods, the fitting uses an average response file made from multiple 5-s response files through out the slew time plus single time preiod for the non-slew times, and weighted by the total counts in the corresponding time period using addrmf. An average response file is needed becuase a spectral fit using the pre-slew DRM will introduce some errors in both a spectral shape and a normalization if the PHA file contains a lot of the slew/post-slew time interval.
- 3) For fits to more complicated models (e.g. a power-law over a cutoff power-law), the BAT team has decided to require a chi-square improvement of more than 6 for each extra dof.
Time averaged spectrum fit using the average DRM
Power-law model
Time interval is from   -2.064 sec. to   39.428 sec.

Spectral model in power-law:
------------------------------------------------------------
Parameters  : value       lower 90%   higher 90%
Photon index: 2.43681     ( -0.305951   0.346267 )
Norm@50keV  : 1.13551E-03    ( -0.000280728   0.000277733 )
------------------------------------------------------------
#Fit statistic : Chi-Squared =          59.30 using 59 PHA bins.
# Reduced chi-squared =          1.040 for     57 degrees of freedom
# Null hypothesis probability =   3.916241e-01

Photon flux (15-150 keV)    in 41.49 sec: 0.214712 ( -0.03237  0.0323717 ) ph/cm2/s
Energy fluence (15-150 keV)             : 4.63547e-07 ( -8.61884e-08  9.05457e-08 ) ergs/cm2
Cutoff power-law model
Time interval is from   -2.064 sec. to   39.428 sec.
Spectral model in the cutoff power-law:
------------------------------------------------------------
Parameters  : value       lower 90%   higher 90%
Photon index: 0.876178     ( -2.44646   1.12782 )
Epeak [keV] : 25.4036      ( -24.4829 9.26397 )
Norm@50keV  : 1.11363E-02    ( -0.0111435   0.439498 )
------------------------------------------------------------
#Fit statistic : Chi-Squared =          56.65 using 59 PHA bins.
# Reduced chi-squared =          1.012 for     56 degrees of freedom
# Null hypothesis probability =   4.504668e-01

Photon flux (15-150 keV)    in 41.49 sec: 0.206092 ( -0.032933  0.033216 ) ph/cm2/s
Energy fluence (15-150 keV)             : 4.08357e-07 ( -7.9448e-08  1.00327e-07 ) ergs/cm2
Band function

Time interval is from   -2.064 sec. to   39.428 sec.

Spectral model in the Band function:
------------------------------------------------------------
Parameters  : value       lower 90%   higher 90%
alpha       : -0.905328   ( -4.56821   1.74632 )
beta        : -9.37167    ( 9.37167   19.3716 )
Epeak [keV] : 25.2870      ( -6.29148 9.41308 )
Norm@50keV   : 1.06367E-02    ( -0.0106395   850596 )
------------------------------------------------------------
#Fit statistic : Chi-Squared =          56.65 using 59 PHA bins.
# Reduced chi-squared =          1.030 for     55 degrees of freedom
# Null hypothesis probability =   4.130839e-01

Photon flux (15-150 keV)    in 41.49 sec: 0.206330 (    ) ph/cm2/s
Energy fluence (15-150 keV)             : 0 ( 0  0 ) ergs/cm2
Single BB
Spectral model blackbody:
------------------------------------------------------------
Parameters  : value    Lower 90%  Upper 90%
kT [keV]    : 7.69274  (-1.11974  1.29601)
R^2/D10^2   : 0.278669  (-0.132001   0.254797)
(R is the radius in km and D10 is the distance to the source in units of 10 kpc)
------------------------------------------------------------
#Fit statistic : Chi-Squared =          59.46 using 59 PHA bins.
# Reduced chi-squared =          1.043 for     57 degrees of freedom
# Null hypothesis probability =   3.862298e-01

Energy  Fluence     90% Error
[keV]   [erg/cm2]   [erg/cm2]
15- 25  1.200e-07   3.232e-08
25- 50  1.960e-07   4.898e-08
50-150  4.516e-08   2.287e-08
15-150  3.611e-07   8.800e-08
Thermal bremsstrahlung (OTTB)
Spectral model: thermal bremsstrahlung
------------------------------------------------------------
Parameters  : value         Lower 90%    Upper 90%
kT [keV]    : 33.8168       (-10.0944      16.4292)
Norm        : 1.57257       (-0.421414     0.615885)
------------------------------------------------------------
#Fit statistic : Chi-Squared =          56.83 using 59 PHA bins.
# Reduced chi-squared =         0.9971 for     57 degrees of freedom
# Null hypothesis probability =   4.813256e-01

Energy  Fluence     90% Error
[keV]   [erg/cm2]   [erg/cm2]
15- 25  1.405e-07   2.672e-08
25- 50  1.710e-07   3.466e-08
50-150  1.089e-07   5.733e-08
15-150  4.204e-07   8.599e-08
Double BB
------------------------------------------------------------
Parameters  : value         Lower 90%    Upper 90%
kT1 [keV]   : 1.47519        (-1.65632      2.29094)
R1^2/D10^2  : 1500.32        (      )
kT2 [keV]   : 8.44557        (-1.38233      5.02768)
R2^2/D10^2  : 0.178682    (-0.164582   0.0828571)
------------------------------------------------------------
#Fit statistic : Chi-Squared =          55.12 using 59 PHA bins.
#Fit statistic : Chi-Squared =          54.98 using 59 PHA bins.
# Reduced chi-squared =          1.002 for     55 degrees of freedom
# Reduced chi-squared =         0.9996 for     55 degrees of freedom
# Null hypothesis probability =   4.702178e-01
# Null hypothesis probability =   4.754389e-01

Energy  Fluence     90% Error
[keV]   [erg/cm2]   [erg/cm2]
15- 25  1.305e-07   5.485e-08
25- 50  1.882e-07   8.420e-08
50-150  6.346e-08   3.782e-08
15-150  3.821e-07   1.556e-07
Peak spectrum fit
Power-law model
Time interval is from    0.232 sec. to    1.232 sec.

Spectral model in power-law:
------------------------------------------------------------
Parameters  : value       lower 90%   higher 90%
Photon index: 2.35659     ( -0.309397   0.3452 )
Norm@50keV  : 7.59650E-03    ( -0.00191019   0.00188311 )
------------------------------------------------------------
#Fit statistic : Chi-Squared =          50.60 using 59 PHA bins.
# Reduced chi-squared =         0.8878 for     57 degrees of freedom
# Null hypothesis probability =   7.123023e-01

Photon flux (15-150 keV)    in 1 sec: 1.37065 ( -0.233415  0.233416 ) ph/cm2/s
Energy fluence (15-150 keV)             : 7.34035e-08 ( -1.48047e-08  1.54033e-08 ) ergs/cm2
Cutoff power-law model
Time interval is from    0.232 sec. to    1.232 sec.
Spectral model in the cutoff power-law:
------------------------------------------------------------
Parameters  : value       lower 90%   higher 90%
Photon index: 8.71519E-02     ( -2.9958   1.88401 )
Epeak [keV] : 29.1626      (   )
Norm@50keV  : 0.220109    (     )
------------------------------------------------------------
#Fit statistic : Chi-Squared =          45.74 using 59 PHA bins.
# Reduced chi-squared =         0.8168 for     56 degrees of freedom
# Null hypothesis probability =   8.344424e-01

Photon flux (15-150 keV)    in 1 sec: 1.31635 ( -0.23147  0.23265 ) ph/cm2/s
Energy fluence (15-150 keV)             : 6.23477e-08 ( -1.22412e-08  1.46664e-08 ) ergs/cm2
Band function
Time interval is from    0.232 sec. to    1.232 sec.

Spectral model in the Band function:
------------------------------------------------------------
Parameters  : value       lower 90%   higher 90%
alpha       : 0.388259   ( -1.78273   -0.781157 )
beta        : -4.03292    ( 3.93846   1.48111 )
Epeak [keV] : 29.4208      ( -8.18366 6.71654 )
Norm@50keV   : 0.458412    ( -0.437557   669.049 )
------------------------------------------------------------
#Fit statistic : Chi-Squared =          45.64 using 59 PHA bins.
# Reduced chi-squared =         0.8298 for     55 degrees of freedom
# Null hypothesis probability =   8.116716e-01

Photon flux (15-150 keV)    in 1 sec:  (    ) ph/cm2/s
Energy fluence (15-150 keV)             : 6.4568e-08 ( -6.4561e-08  -1.40346e-08 ) ergs/cm2
Single BB
Spectral model blackbody:
------------------------------------------------------------
Parameters  : value    Lower 90%  Upper 90%
kT [keV]    : 7.89420  (-1.18223  1.37789)
R^2/D10^2   : 1.67758  (-0.819701   1.59027)
(R is the radius in km and D10 is the distance to the source in units of 10 kpc)
------------------------------------------------------------
#Fit statistic : Chi-Squared =          46.59 using 59 PHA bins.
# Reduced chi-squared =         0.8174 for     57 degrees of freedom
# Null hypothesis probability =   8.359397e-01

Energy  Fluence     90% Error
[keV]   [erg/cm2]   [erg/cm2]
15- 25  1.871e-08   5.455e-09
25- 50  3.200e-08   8.950e-09
50-150  8.042e-09   3.894e-09
15-150  5.876e-08   1.502e-08
Thermal bremsstrahlung (OTTB)
Spectral model: thermal bremsstrahlung
------------------------------------------------------------
Parameters  : value         Lower 90%    Upper 90%
kT [keV]    : 35.5825       (-10.9482      18.7948)
Norm        : 9.83782       (-2.76895     3.93808)
------------------------------------------------------------
#Fit statistic : Chi-Squared =          47.11 using 59 PHA bins.
# Reduced chi-squared =         0.8264 for     57 degrees of freedom
# Null hypothesis probability =   8.219804e-01

Energy  Fluence     90% Error
[keV]   [erg/cm2]   [erg/cm2]
15- 25  2.164e-08   4.640e-09
25- 50  2.699e-08   6.690e-09
50-150  1.828e-08   9.435e-09
15-150  6.691e-08   1.723e-08
Double BB
------------------------------------------------------------
Parameters  : value         Lower 90%    Upper 90%
kT1 [keV]   : 199.352        (      )
R1^2/D10^2  : 4.06410E-05        (-4.15769e-05      -4.15769e-05)
kT2 [keV]   : 7.63343        (-7.63084      1.37835)
R2^2/D10^2  : 1.88322    (-0.861885   55.295)
------------------------------------------------------------
#Fit statistic : Chi-Squared =          45.66 using 59 PHA bins.
#Fit statistic : Chi-Squared =          45.40 using 59 PHA bins.
# Reduced chi-squared =         0.8302 for     55 degrees of freedom
# Reduced chi-squared =         0.8255 for     55 degrees of freedom
# Null hypothesis probability =   8.110939e-01
# Null hypothesis probability =   8.186357e-01

Energy  Fluence     90% Error
[keV]   [erg/cm2]   [erg/cm2]
15- 25  2.010e-08   1.039e-08
25- 50  3.052e-08   1.735e-08
50-150  1.047e-08   6.675e-09
15-150  6.108e-08   3.194e-08
Pre-slew spectrum (Pre-slew PHA with pre-slew DRM)
Power-law model
Spectral model in power-law:
------------------------------------------------------------
Parameters  : value       lower 90%   higher 90%
Photon index: 2.52504     ( -0.306069   0.346567 )
Norm@50keV  : 1.67597E-03    ( -0.000420705   0.000419657 )
------------------------------------------------------------
#Fit statistic : Chi-Squared =          49.31 using 59 PHA bins.
# Reduced chi-squared =         0.8651 for     57 degrees of freedom
# Null hypothesis probability =   7.556100e-01

Photon flux (15-150 keV)    in 20.35 sec: 0.334353 ( -0.0487891  0.0487946 ) ph/cm2/s
Energy fluence (15-150 keV)             : 3.43398e-07 ( -6.21347e-08  6.53127e-08 ) ergs/cm2
Cutoff power-law model

Spectral model in the cutoff power-law:
------------------------------------------------------------
Parameters  : value       lower 90%   higher 90%
Photon index: 1.41804     ( -2.09268   0.582244 )
Epeak [keV] : 17.9806      (   )
Norm@50keV  : 8.76406E-03    (     )
------------------------------------------------------------
#Fit statistic : Chi-Squared =          47.62 using 59 PHA bins.
# Reduced chi-squared =         0.8503 for     56 degrees of freedom
# Null hypothesis probability =   7.797898e-01

Photon flux (15-150 keV)    in 20.35 sec: 0.325167 ( -0.04923  0.049717 ) ph/cm2/s
Energy fluence (15-150 keV)             : 3.10242e-07 ( -6.08139e-08  7.55229e-08 ) ergs/cm2
Band function
Spectral model in the Band function:
------------------------------------------------------------
Parameters  : value       lower 90%   higher 90%
alpha       : -1.42552   ( -0.643454   1.56797 )
beta        : -10.00000    ( 10   20 )
Epeak [keV] : 17.9577      ( -5.51347 12.7389 )
Norm@50keV   : 8.62566E-03    ( -0.0012495   0.222098 )
------------------------------------------------------------
#Fit statistic : Chi-Squared =          47.62 using 59 PHA bins.
# Reduced chi-squared =         0.8658 for     55 degrees of freedom
# Null hypothesis probability =   7.497223e-01

Photon flux (15-150 keV)    in 20.35 sec:  (    ) ph/cm2/s
Energy fluence (15-150 keV)             : 0 ( 0  0 ) ergs/cm2
S(25-50 keV) vs. S(50-100 keV) plot

S(25-50 keV)  = 1.53e-07
S(50-100 keV) = 1.13e-07
T90 vs. Hardness ratio plot
T90                                   = 38.9679999351501 sec.
Hardness ratio (energy fluence ratio) = 0.738562
Color vs. Color plot
Count Ratio  (25-50 keV) / (15-25 keV) = 1.18613
Count Ratio (50-100 keV) / (15-25 keV) = 0.234185
Mask shadow pattern
IMX = 6.299890713493866E-02, IMY = 5.398339803588269E-01
TIME vs. PHA plot around the trigger time
Blue+Cyan dotted lines: Time interval of the scaled map
From 0.000000 to 1.024000
TIME vs. DetID plot around the trigger time
Blue+Cyan dotted lines: Time interval of the scaled map
From 0.000000 to 1.024000
100 us light curve (15-350 keV)
Blue+Cyan dotted lines: Time interval of the scaled map
From 0.000000 to 1.024000
Spacecraft aspect plot
Bright source in the pre-burst/pre-slew/post-slew images
Pre-burst image of 15-350 keV band
Time interval of the image:
-239.816000 -2.064000

# RAcent  DECcent POSerr Theta    Phi  PeakCts   SNR AngSep     Name
#  [deg]    [deg]    ['] [deg]  [deg]                   [']
244.9856 -15.6525    0.4  22.8   95.1   7.7928  29.0    0.8	Sco X-1
255.9056 -37.9809   17.2  18.8   23.2   0.1425   0.7    9.1	4U 1700-377
256.4371 -36.3866    6.7  17.3   25.3   0.3593   1.7    2.2	GX 349+2
262.9337 -24.6543   10.8   5.2   55.4   0.2032   1.1    6.8	GX 1+4
264.7513 -44.4520    4.0  22.2   -1.6   0.6687   2.9    0.4	4U 1735-44
268.4914  -1.5785   10.2  20.8  173.2   0.2445   1.1   10.6	SW J1753.5-0127
270.3153 -25.1001    6.4   3.4  -44.3   0.4010   1.9    2.1	GX 5-1
270.3688 -25.6719    3.3   3.9  -39.7   0.8417   4.0    5.6	GRS 1758-258
273.9540 -13.9633    3.9  10.1 -153.5   0.6414   3.0    5.3	GX 17+2
276.0165 -30.3653    8.4  10.7  -47.9   0.2963   1.4    4.7	H1820-303
284.8744 -24.7735    0.0  15.6  -85.8   0.0354   0.2   12.5	HT1900.1-2455
288.7733  10.9523    1.3  39.0 -154.5   3.0662   8.7    1.5	GRS 1915+105
263.0754 -33.7740    6.1  12.2   12.2   0.4242   1.9    5.6	GX 354-0
225.5993 -22.4098    2.8  39.2   73.6   3.1851   4.1 ------	UNKNOWN
320.9796 -54.7577    2.9  50.7  -44.4   5.0600   3.9 ------	UNKNOWN
313.8062 -29.9935    3.1  41.5  -77.4   3.5311   3.8 ------	UNKNOWN
Pre-slew background subtracted image of 15-350 keV band
Time interval of the image:
-2.064000 18.284600

# RAcent  DECcent POSerr Theta    Phi  PeakCts   SNR AngSep     Name
#  [deg]    [deg]    ['] [deg]  [deg]                   [']
244.7896 -15.7339    0.0  23.0   94.8   0.1933   2.9   12.3	Sco X-1
255.9850 -37.8710  147.2  18.7   23.2   0.0039   0.1    1.6	4U 1700-377
256.4380 -36.4168   40.1  17.3   25.2  -0.0146  -0.3    0.4	GX 349+2
262.9548 -24.6209    6.5   5.2   55.6   0.0878   1.8    8.0	GX 1+4
264.9706 -44.3255    0.0  22.1   -2.0  -0.1452  -2.7   12.3	4U 1735-44
268.2883  -1.5292    9.3  20.9  172.6   0.0655   1.2    6.6	SW J1753.5-0127
270.0993 -25.2095    0.0   3.4  -40.5   0.0821   1.6   12.7	GX 5-1
270.3878 -25.9033   11.0   4.1  -38.2   0.0536   1.1   10.7	GRS 1758-258
273.8465 -14.0917   71.3   9.9 -153.6  -0.0077  -0.2    9.8	GX 17+2
276.0417 -30.3359    4.8  10.7  -48.1   0.1153   2.4    6.3	H1820-303
285.1679 -25.0667   12.7  15.9  -84.8   0.0515   0.9   11.3	HT1900.1-2455
288.6771  10.9874    5.4  39.0 -154.7  -0.1503  -2.1    7.6	GRS 1915+105
262.9937 -33.8225   13.0  12.3   12.4   0.0420   0.9    0.8	GX 354-0
292.6154 -17.9259    2.0  23.4 -104.4   0.3500   5.8 ------	UNKNOWN
299.1721 -26.4660    1.2  28.5  -83.3   0.7049   9.4 ------	UNKNOWN
311.8331 -43.9606    2.4  41.8  -56.2   0.6369   4.8 ------	UNKNOWN
Post-slew image of 15-350 keV band
Time interval of the image:
68.084600 962.250600

# RAcent  DECcent POSerr Theta    Phi  PeakCts   SNR AngSep     Name
#  [deg]    [deg]    ['] [deg]  [deg]                   [']
256.1020 -37.9354    6.0  37.8   72.0  -2.7721  -1.9    7.7	4U 1700-377
256.4871 -36.5098   11.2  37.4   74.3   1.5515   1.0    5.8	GX 349+2
262.9410 -24.7495    4.4  32.6   95.4   2.8299   2.6    3.7	GX 1+4
264.8377 -44.6052  771.5  32.9   58.2   0.0134   0.0   10.2	4U 1735-44
268.4990  -1.5007    6.0  38.6  135.7   2.4301   1.9    8.4	SW J1753.5-0127
270.4549 -24.9848    9.6  25.9   97.4  -0.9476  -1.2   10.9	GX 5-1
270.2589 -25.6068   11.4  25.9   95.9   0.7938   1.0    8.5	GRS 1758-258
274.0393 -14.0776    1.7  26.6  123.4   4.5570   6.7    3.1	GX 17+2
275.8849 -30.3850    3.5  20.8   84.2   1.9414   3.3    2.3	H1820-303
285.0201 -24.9903    6.3  12.8  104.0   0.8751   1.8    4.3	HT1900.1-2455
288.7848  10.9248    0.7  38.7  174.1  11.7734  15.9    1.5	GRS 1915+105
262.8672 -33.9294    5.7  32.1   78.2  -2.0517  -2.0    8.3	GX 354-0
265.5826 -76.9422    2.6  53.0   19.6   9.6527   4.4 ------	UNKNOWN
283.5526  23.0813    2.4  51.8  172.2   7.6044   4.8 ------	UNKNOWN
325.9297  12.7874    4.7  47.1 -132.6   5.2519   2.5 ------	UNKNOWN
358.9421 -42.8038    3.7  50.7  -44.4  12.7373   3.1 ------	UNKNOWN
Plot creation:
Sun May 31 01:43:00 EDT 2015