Click here for the BAT GCN circular template
Image
Pre-slew 15.0-350.0 keV image (Event data)
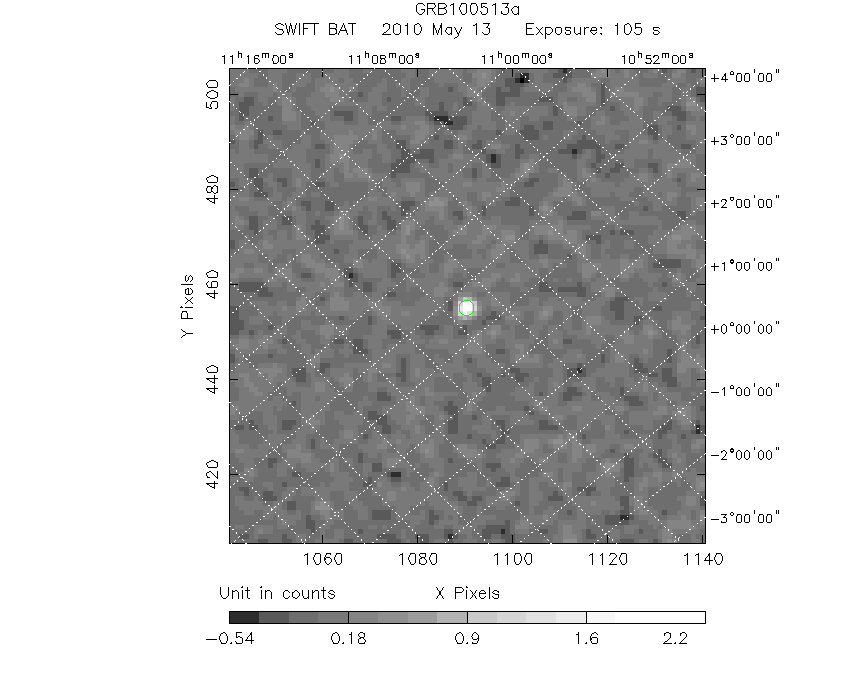
#   RAcent    DECcent   POSerr    Theta     Phi              Peak Cts       SNR   Name
  169.6002     3.6105   0.0104    23.9831   174.1641         2.5082680     18.567 TRIG_00421814

Foreground time interval of the image:
-52.640  52.344 (delta_t = 104.984 [sec])
Background time interval of the image:
-239.560 -52.640 (delta_t = 186.920 [sec])
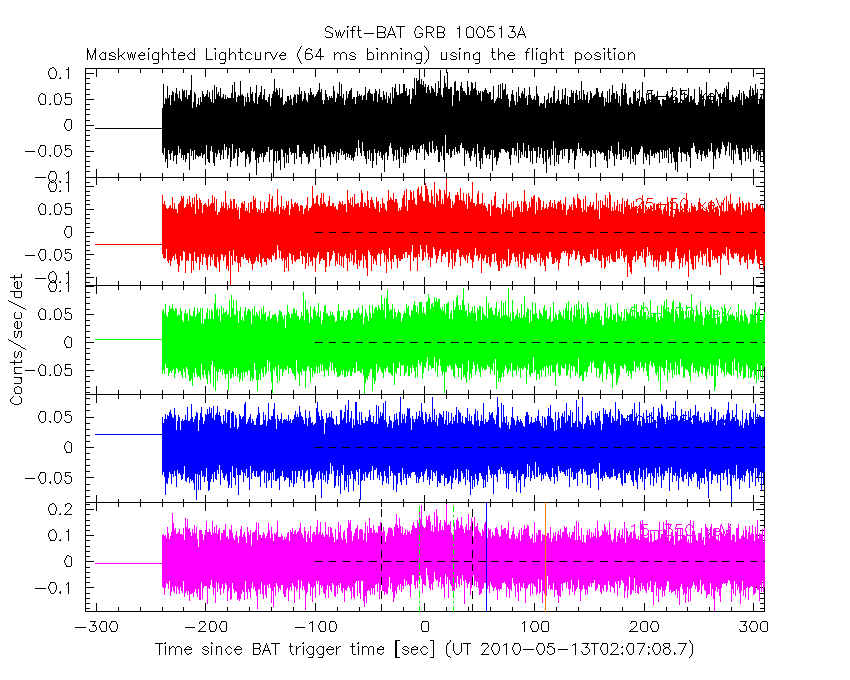
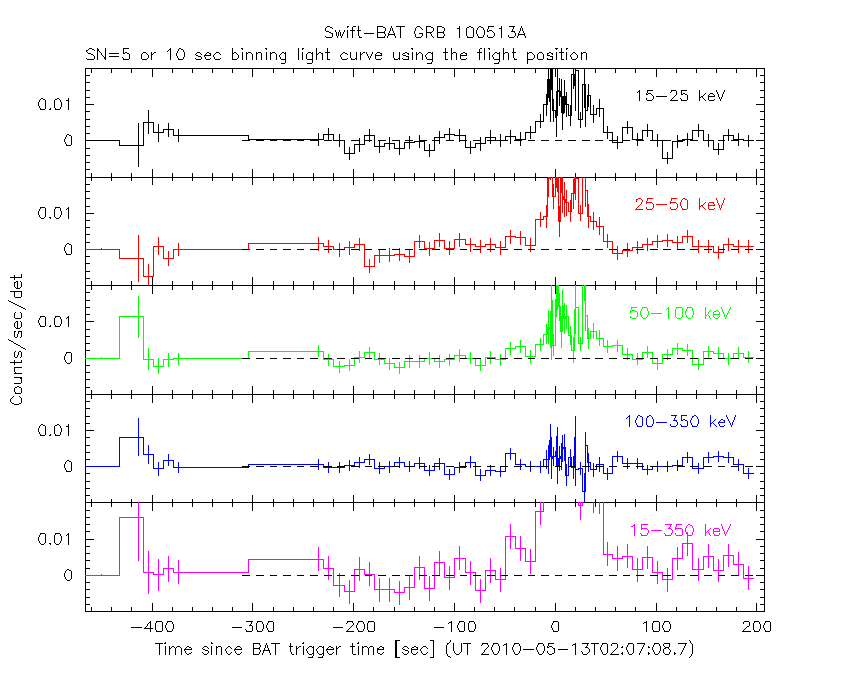
Lightcurves
Notes:
- 1) The mask-weighted light curves are using the flight position.
- 2) Multiple plots of different time binning/intervals are shown to cover all scenarios of short/long GRBs, rate/image triggers, and real/false positives.
- 3) For all the mask-weighted lightcurves, the y-axis units are counts/sec/det where a det is 0.4 x 0.4 = 0.16 sq cm.
- 4) The verticle lines correspond to following: green dotted lines are T50 interval, black dotted lines are T90 interval, blue solid line(s) is a spacecraft slew start time, and orange solid line(s) is a spacecraft slew end time.
- 5) Time of each bin is in the middle of the bin.
1 s binning
From T0-310 s to T0+310 s
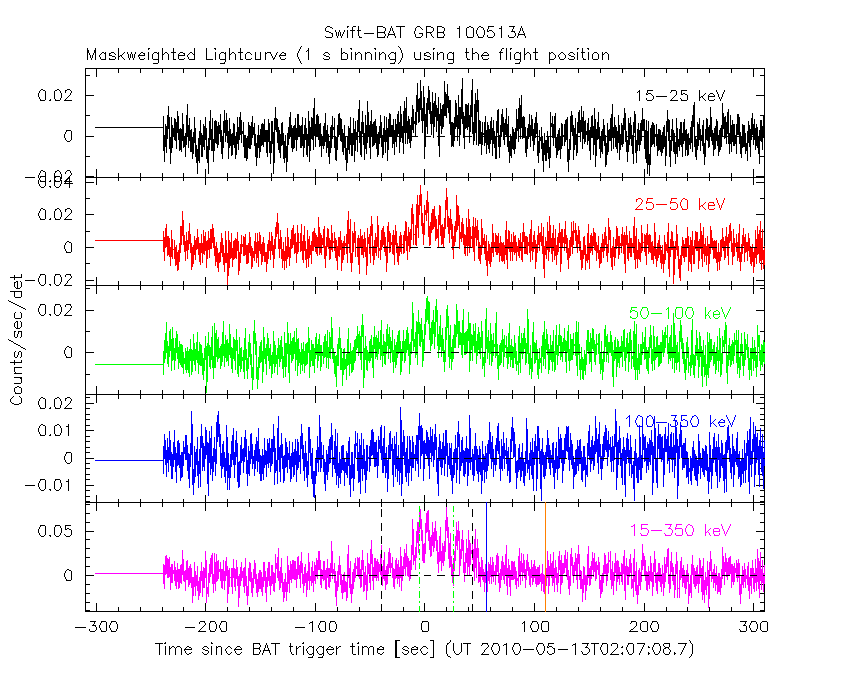
From T100_start - 20 s to T100_end + 30 s

Full time interval

64 ms binning
Full time interval
From T100_start to T100_end
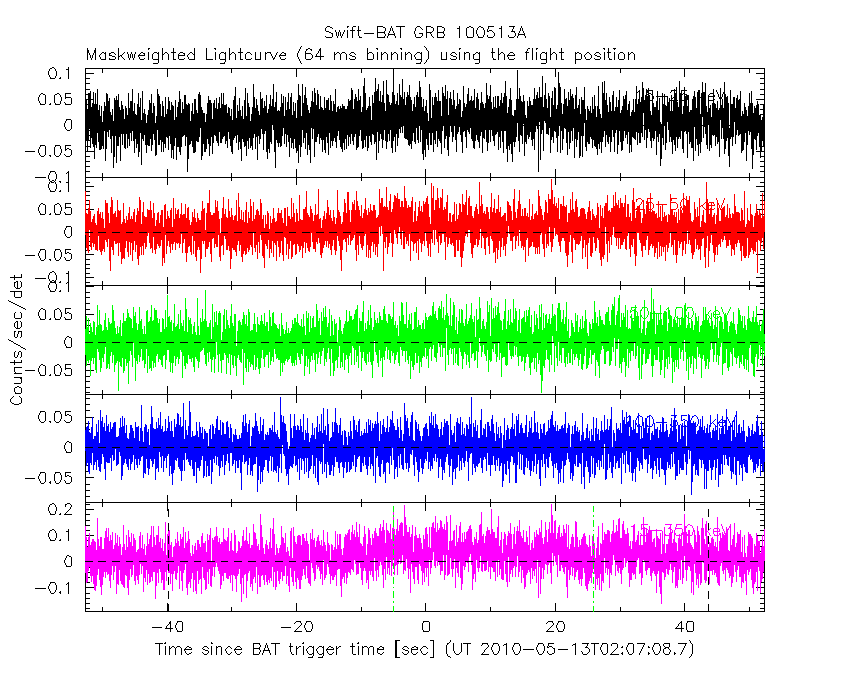
From T0-5 sec to T0+5 sec

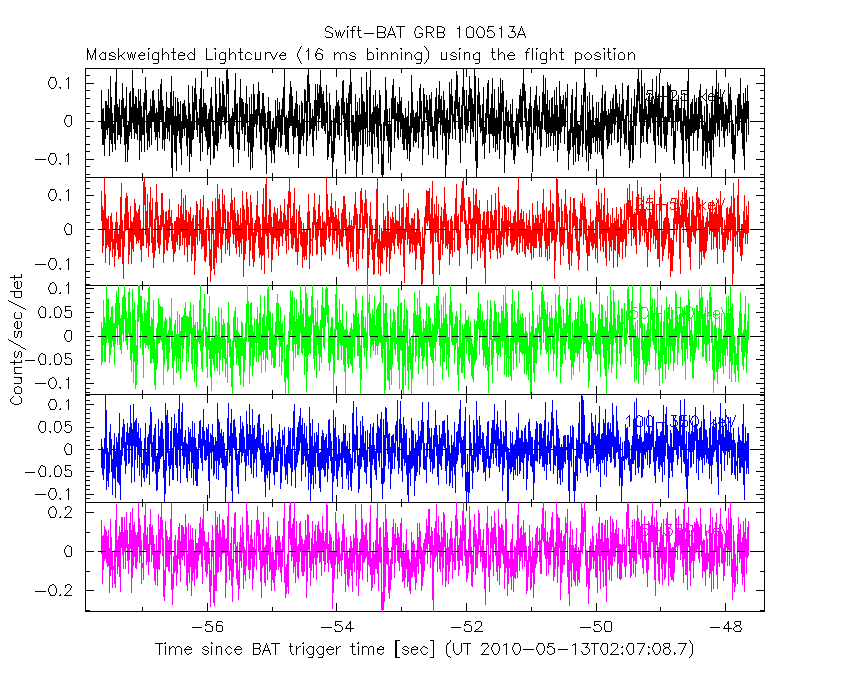
16 ms binning
From T100_start-5 s to T100_start+5 s
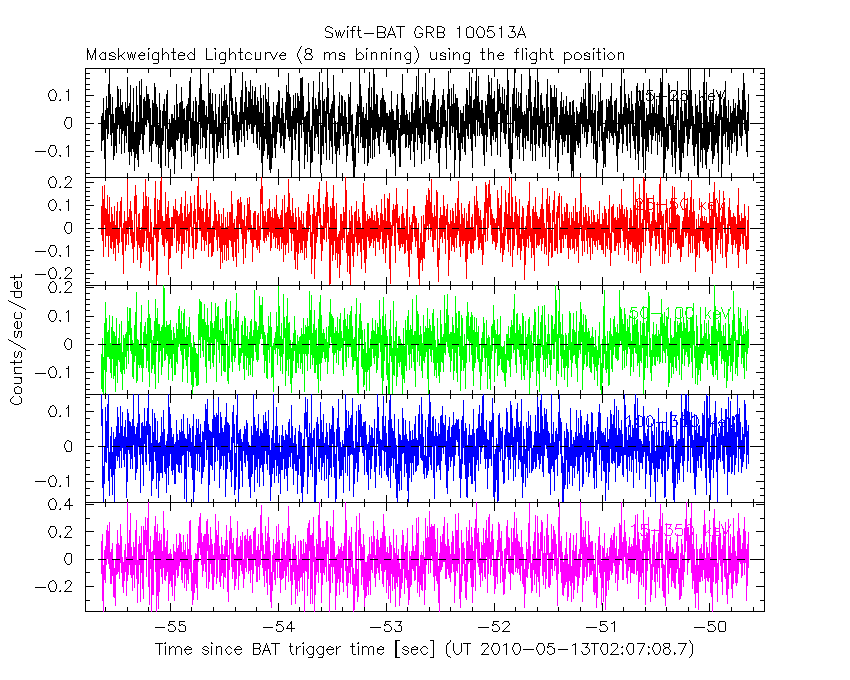
8 ms binning
From T100_start-3 s to T100_start+3 s
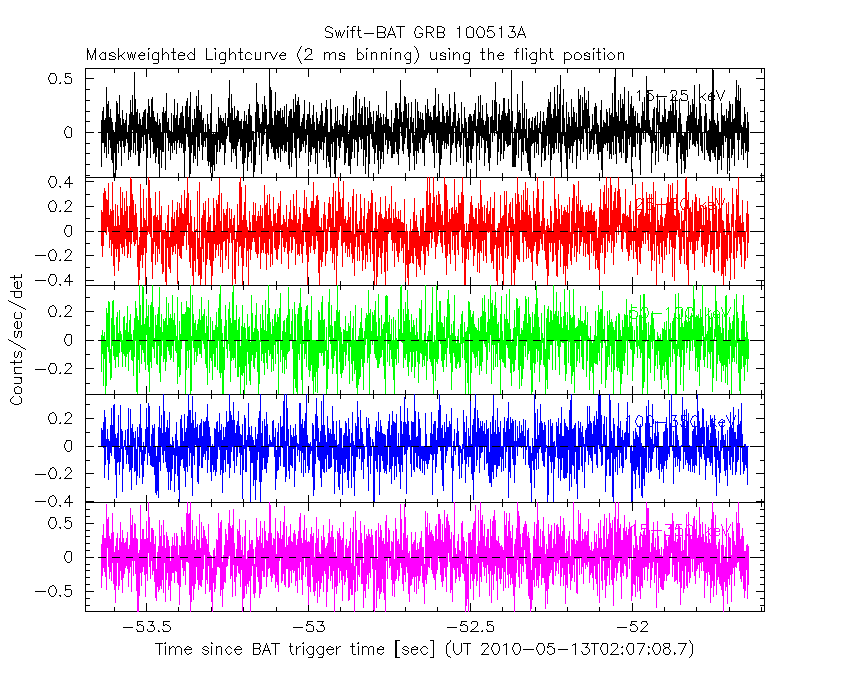
2 ms binning
From T100_start-1 s to T100_start+1 s
SN=5 or 10 sec. binning (whichever binning is satisfied first)
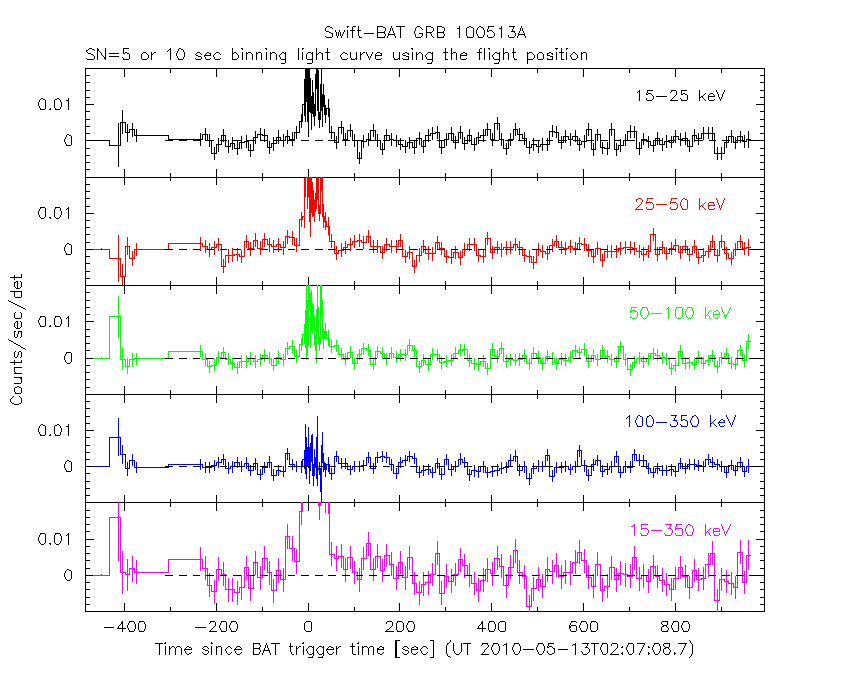
SN=5 or 10 sec. binning (T < 200 sec)
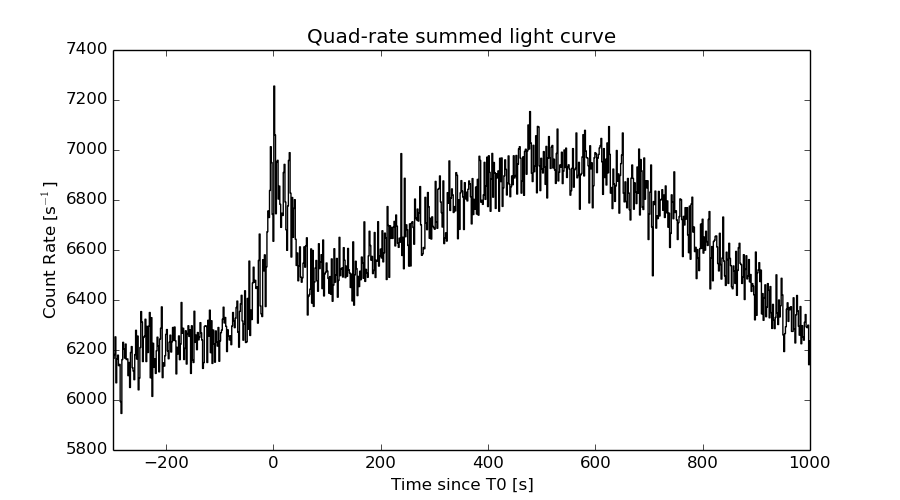
Quad-rate summed light curves (from T0-300s to T0+1000s)
The mask-weighted light curves based on cleaned DPHs

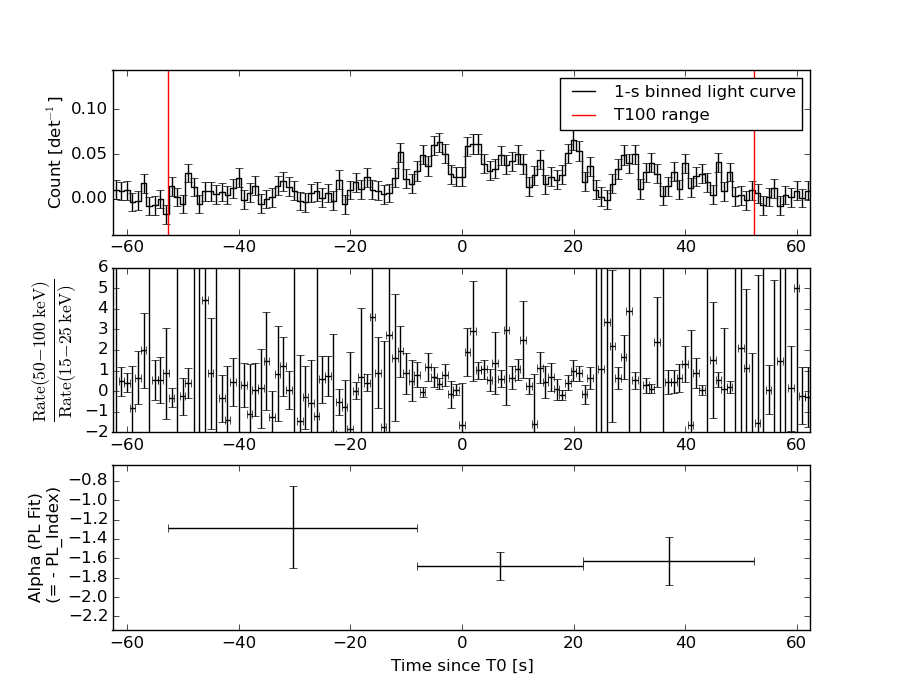
Spectral Evolution
Spectra
Notes:
- 1) The fitting includes the systematic errors.
- 2) When the burst includes telescope slew time periods, the fitting uses an average response file made from multiple 5-s response files through out the slew time plus single time preiod for the non-slew times, and weighted by the total counts in the corresponding time period using addrmf. An average response file is needed becuase a spectral fit using the pre-slew DRM will introduce some errors in both a spectral shape and a normalization if the PHA file contains a lot of the slew/post-slew time interval.
- 3) For fits to more complicated models (e.g. a power-law over a cutoff power-law), the BAT team has decided to require a chi-square improvement of more than 6 for each extra dof.
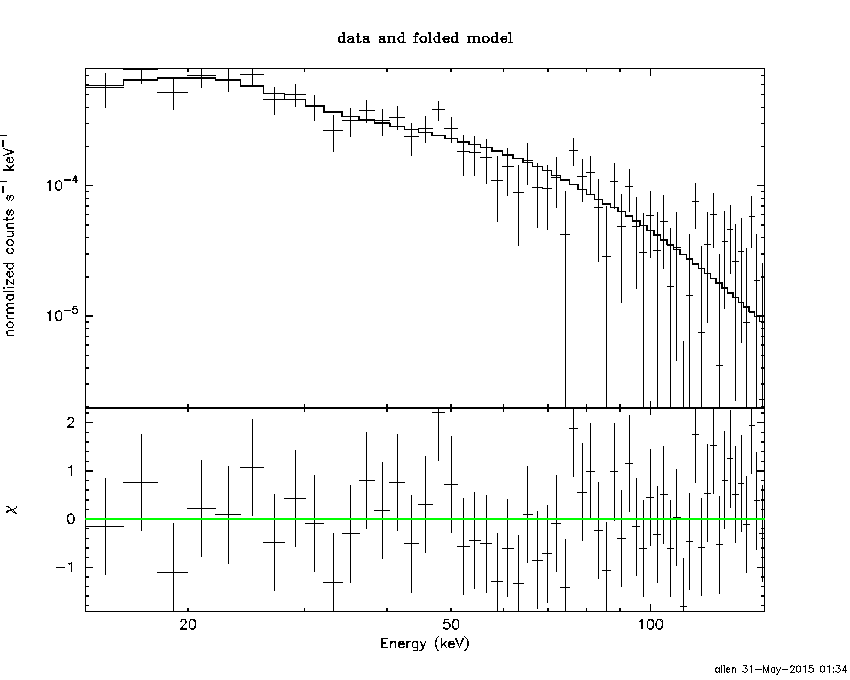
Time averaged spectrum fit using the average DRM
Power-law model

Time interval is from  -52.640 sec. to   52.344 sec.

Spectral model in power-law:
------------------------------------------------------------
Parameters  : value       lower 90%   higher 90%
Photon index: 1.59290     ( -0.133728   0.135252 )
Norm@50keV  : 1.45426E-03    ( -0.000114684   0.00011373 )
------------------------------------------------------------
#Fit statistic : Chi-Squared =          48.19 using 59 PHA bins.
# Reduced chi-squared =         0.8454 for     57 degrees of freedom
# Null hypothesis probability =   7.906150e-01

Photon flux (15-150 keV)    in 105 sec: 0.186470 ( -0.0139438  0.0139555 ) ph/cm2/s
Energy fluence (15-150 keV)             : 1.42929e-06 ( -1.21944e-07  1.23199e-07 ) ergs/cm2
Cutoff power-law model

Time interval is from  -52.640 sec. to   52.344 sec.
Spectral model in the cutoff power-law:
------------------------------------------------------------
Parameters  : value       lower 90%   higher 90%
Photon index: 1.52461     ( -0.560196   0.602142 )
Epeak [keV] : 322.290      ( -342.128 -342.128 )
Norm@50keV  : 1.58202E-03    ( -0.000461778   0.00152922 )
------------------------------------------------------------
#Fit statistic : Chi-Squared =          48.15 using 59 PHA bins.
# Reduced chi-squared =         0.8598 for     56 degrees of freedom
# Null hypothesis probability =   7.630447e-01

Photon flux (15-150 keV)    in 105 sec: 0.185889 ( -0.014629  0.014359 ) ph/cm2/s
Energy fluence (15-150 keV)             : 1.4204e-06 ( -1.44658e-07  1.30694e-07 ) ergs/cm2
Band function
Time interval is from  -52.640 sec. to   52.344 sec.

Spectral model in the Band function:
------------------------------------------------------------
Parameters  : value       lower 90%   higher 90%
alpha       : -0.802520   ( 0.92157   0.92157 )
beta        : -1.73414    ( 1.73564   0.240225 )
Epeak [keV] : 54.2719      ( -54.2136 529.388 )
Norm@50keV   : 4.46347E-03    ( -0.00448436   98.9448 )
------------------------------------------------------------
#Fit statistic : Chi-Squared =          46.88 using 59 PHA bins.
# Reduced chi-squared =         0.8524 for     55 degrees of freedom
# Null hypothesis probability =   7.737589e-01

Photon flux (15-150 keV)    in 105 sec:  (    ) ph/cm2/s
Energy fluence (15-150 keV)             : 0 ( 0  0 ) ergs/cm2
Single BB

Spectral model blackbody:
------------------------------------------------------------
Parameters  : value    Lower 90%  Upper 90%
kT [keV]    : 12.7038  (-1.17805  1.34437)
R^2/D10^2   : 3.66846E-02  (-0.0111999   0.0156006)
(R is the radius in km and D10 is the distance to the source in units of 10 kpc)
------------------------------------------------------------
#Fit statistic : Chi-Squared =          90.38 using 59 PHA bins.
# Reduced chi-squared =          1.586 for     57 degrees of freedom
# Null hypothesis probability =   3.210636e-03

Energy  Fluence     90% Error
[keV]   [erg/cm2]   [erg/cm2]
15- 25  1.318e-07   1.874e-08
25- 50  4.428e-07   4.179e-08
50-150  4.456e-07   7.697e-08
15-150  1.020e-06   9.334e-08
Thermal bremsstrahlung (OTTB)

Spectral model: thermal bremsstrahlung
------------------------------------------------------------
Parameters  : value         Lower 90%    Upper 90%
kT [keV]    : 176.664       (-57.9447      -176.404)
Norm        : 0.759792       (-0.0597911     0.0680201)
------------------------------------------------------------
#Fit statistic : Chi-Squared =          48.68 using 59 PHA bins.
# Reduced chi-squared =         0.8540 for     57 degrees of freedom
# Null hypothesis probability =   7.756917e-01

Energy  Fluence     90% Error
[keV]   [erg/cm2]   [erg/cm2]
15- 25  2.016e-07   3.649e-08
25- 50  3.821e-07   1.207e-07
50-150  8.037e-07   3.861e-07
15-150  1.387e-06   4.935e-07
Double BB

Spectral model: bbodyrad<1> + bbodyrad<2>
------------------------------------------------------------
Parameters  : value         Lower 90%    Upper 90%
kT1 [keV]   : 8.73328        (-1.60016      1.49851)
R1^2/D10^2  : 0.113776        (-0.0456525      0.0793543)
kT2 [keV]   : 47.4615        (-20.2624      -47.7119)
R2^2/D10^2  : 3.28152E-04    (-0.000255716   0.00110914)
------------------------------------------------------------
#Fit statistic : Chi-Squared =          46.27 using 59 PHA bins.
# Reduced chi-squared =         0.8412 for     55 degrees of freedom
# Null hypothesis probability =   7.929907e-01

Energy  Fluence     90% Error
[keV]   [erg/cm2]   [erg/cm2]
15- 25  1.833e-07   3.822e-08
25- 50  4.166e-07   8.185e-08
50-150  8.533e-07   3.919e-07
15-150  1.453e-06   4.805e-07
Peak spectrum fit
Power-law model

Time interval is from    1.088 sec. to    2.088 sec.

Spectral model in power-law:
------------------------------------------------------------
Parameters  : value       lower 90%   higher 90%
Photon index: 1.28610     ( -0.442331   0.425729 )
Norm@50keV  : 4.80599E-03    ( -0.00116625   0.00116389 )
------------------------------------------------------------
#Fit statistic : Chi-Squared =          45.28 using 59 PHA bins.
# Reduced chi-squared =         0.7944 for     57 degrees of freedom
# Null hypothesis probability =   8.686543e-01

Photon flux (15-150 keV)    in 1 sec: 0.571925 ( -0.141388  0.141853 ) ph/cm2/s
Energy fluence (15-150 keV)             : 4.7655e-08 ( -1.28087e-08  1.30566e-08 ) ergs/cm2
Cutoff power-law model

Time interval is from    1.088 sec. to    2.088 sec.
Spectral model in the cutoff power-law:
------------------------------------------------------------
Parameters  : value       lower 90%   higher 90%
Photon index: 2.76028     (     )
Epeak [keV] : 227.973      (   )
Norm@50keV  : 6.67784E-04    (     )
------------------------------------------------------------
#Fit statistic : Chi-Squared =          45.08 using 59 PHA bins.
# Reduced chi-squared =         0.8050 for     56 degrees of freedom
# Null hypothesis probability =   8.516154e-01

Photon flux (15-150 keV)    in 1 sec: 0.572259 ( -0.142245  0.141259 ) ph/cm2/s
Energy fluence (15-150 keV)             : 4.76152e-08 ( -1.40303e-08  1.29983e-08 ) ergs/cm2
Band function

Time interval is from    1.088 sec. to    2.088 sec.

Spectral model in the Band function:
------------------------------------------------------------
Parameters  : value       lower 90%   higher 90%
alpha       : 8.62090E-02   ( 0.547174   0.547174 )
beta        : -1.48587    ( 1.40355   0.537276 )
Epeak [keV] : 55.2068      ( -56.037 163.602 )
Norm@50keV   : 3.29288E-02    ( -0.0354127   49.8431 )
------------------------------------------------------------
#Fit statistic : Chi-Squared =          44.92 using 59 PHA bins.
# Reduced chi-squared =         0.8168 for     55 degrees of freedom
# Null hypothesis probability =   8.319376e-01

Photon flux (15-150 keV)    in 1 sec:  (    ) ph/cm2/s
Energy fluence (15-150 keV)             : 0 ( 0  0 ) ergs/cm2
Single BB

Spectral model blackbody:
------------------------------------------------------------
Parameters  : value    Lower 90%  Upper 90%
kT [keV]    : 14.5157  (-3.95595  7.85872)
R^2/D10^2   : 7.43785E-02  (-0.0569997   0.152789)
(R is the radius in km and D10 is the distance to the source in units of 10 kpc)
------------------------------------------------------------
#Fit statistic : Chi-Squared =          49.85 using 59 PHA bins.
# Reduced chi-squared =         0.8746 for     57 degrees of freedom
# Null hypothesis probability =   7.376970e-01

Energy  Fluence     90% Error
[keV]   [erg/cm2]   [erg/cm2]
15- 25  3.297e-09   1.788e-09
25- 50  1.270e-08   6.478e-09
50-150  1.794e-08   1.067e-08
15-150  3.394e-08   1.830e-08
Thermal bremsstrahlung (OTTB)

Spectral model: thermal bremsstrahlung
------------------------------------------------------------
Parameters  : value         Lower 90%    Upper 90%
kT [keV]    : 199.362       (-100.596      -199.363)
Norm        : 2.36291       (-0.577978     0.57797)
------------------------------------------------------------
#Fit statistic : Chi-Squared =          46.42 using 59 PHA bins.
# Reduced chi-squared =         0.8144 for     57 degrees of freedom
# Null hypothesis probability =   8.403853e-01

Energy  Fluence     90% Error
[keV]   [erg/cm2]   [erg/cm2]
15- 25  5.884e-09   3.595e-09
25- 50  1.132e-08   6.680e-09
50-150  2.482e-08   1.469e-08
15-150  4.203e-08   2.468e-08
Double BB

------------------------------------------------------------
#Fit statistic : Chi-Squared =          48.64 using 59 PHA bins.
#Fit statistic : Chi-Squared =          43.50 using 59 PHA bins.
#Fit statistic : Chi-Squared =          43.47 using 59 PHA bins.
#Fit statistic : Chi-Squared =          43.43 using 59 PHA bins.
# Reduced chi-squared =         0.8844 for     55 degrees of freedom
# Reduced chi-squared =         0.7908 for     55 degrees of freedom
# Reduced chi-squared =         0.7905 for     55 degrees of freedom
# Reduced chi-squared =         0.7897 for     55 degrees of freedom
# Null hypothesis probability =   7.146851e-01
# Null hypothesis probability =   8.685351e-01
# Null hypothesis probability =   8.690353e-01
# Null hypothesis probability =   8.700361e-01

Energy  Fluence     90% Error
[keV]   [erg/cm2]   [erg/cm2]
15- 25  3.863e-09   1.773e-09
25- 50  1.151e-08   6.793e-09
50-150  2.053e-08   1.356e-08
15-150  3.591e-08   2.106e-08
Pre-slew spectrum (Pre-slew PHA with pre-slew DRM)
Power-law model

Spectral model in power-law:
------------------------------------------------------------
Parameters  : value       lower 90%   higher 90%
Photon index: 1.59290     ( -0.133728   0.135252 )
Norm@50keV  : 1.45426E-03    ( -0.000114684   0.00011373 )
------------------------------------------------------------
#Fit statistic : Chi-Squared =          48.19 using 59 PHA bins.
# Reduced chi-squared =         0.8454 for     57 degrees of freedom
# Null hypothesis probability =   7.906150e-01

Photon flux (15-150 keV)    in 105 sec: 0.186470 ( -0.0139438  0.0139555 ) ph/cm2/s
Energy fluence (15-150 keV)             : 1.42929e-06 ( -1.21944e-07  1.23199e-07 ) ergs/cm2
Cutoff power-law model

Spectral model in the cutoff power-law:
------------------------------------------------------------
Parameters  : value       lower 90%   higher 90%
Photon index: 1.52461     ( -0.560196   0.602142 )
Epeak [keV] : 322.290      ( -342.128 -342.128 )
Norm@50keV  : 1.58202E-03    ( -0.000461778   0.00152922 )
------------------------------------------------------------
#Fit statistic : Chi-Squared =          48.15 using 59 PHA bins.
# Reduced chi-squared =         0.8598 for     56 degrees of freedom
# Null hypothesis probability =   7.630447e-01

Photon flux (15-150 keV)    in 105 sec: 0.185889 ( -0.014629  0.014359 ) ph/cm2/s
Energy fluence (15-150 keV)             : 1.4204e-06 ( -1.44658e-07  1.30694e-07 ) ergs/cm2
Band function

Spectral model in the Band function:
------------------------------------------------------------
Parameters  : value       lower 90%   higher 90%
alpha       : -0.802520   ( 0.92157   0.92157 )
beta        : -1.73414    ( 1.73564   0.240225 )
Epeak [keV] : 54.2719      ( -54.2136 529.388 )
Norm@50keV   : 4.46347E-03    ( -0.00448436   95.1429 )
------------------------------------------------------------
#Fit statistic : Chi-Squared =          46.88 using 59 PHA bins.
# Reduced chi-squared =         0.8524 for     55 degrees of freedom
# Null hypothesis probability =   7.737589e-01

Photon flux (15-150 keV)    in 105 sec:  (    ) ph/cm2/s
Energy fluence (15-150 keV)             : 0 ( 0  0 ) ergs/cm2
S(25-50 keV) vs. S(50-100 keV) plot
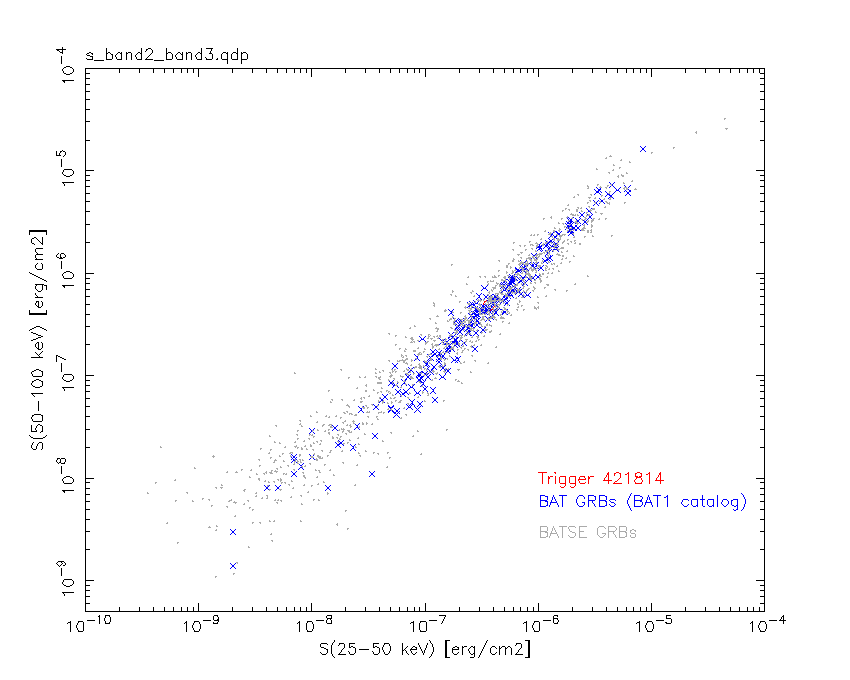
S(25-50 keV)  = 3.69e-07
S(50-100 keV) = 4.90e-07
T90 vs. Hardness ratio plot
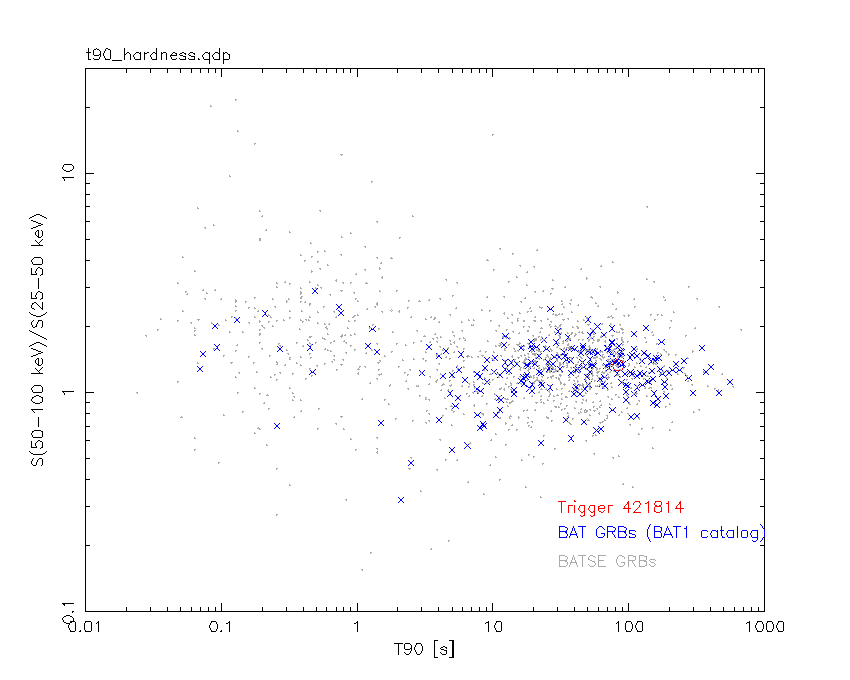
T90                                   = 83.4959999918938 sec.
Hardness ratio (energy fluence ratio) = 1.32791
Color vs. Color plot

Count Ratio  (25-50 keV) / (15-25 keV) = 1.32365
Count Ratio (50-100 keV) / (15-25 keV) = 0.823398
Mask shadow pattern
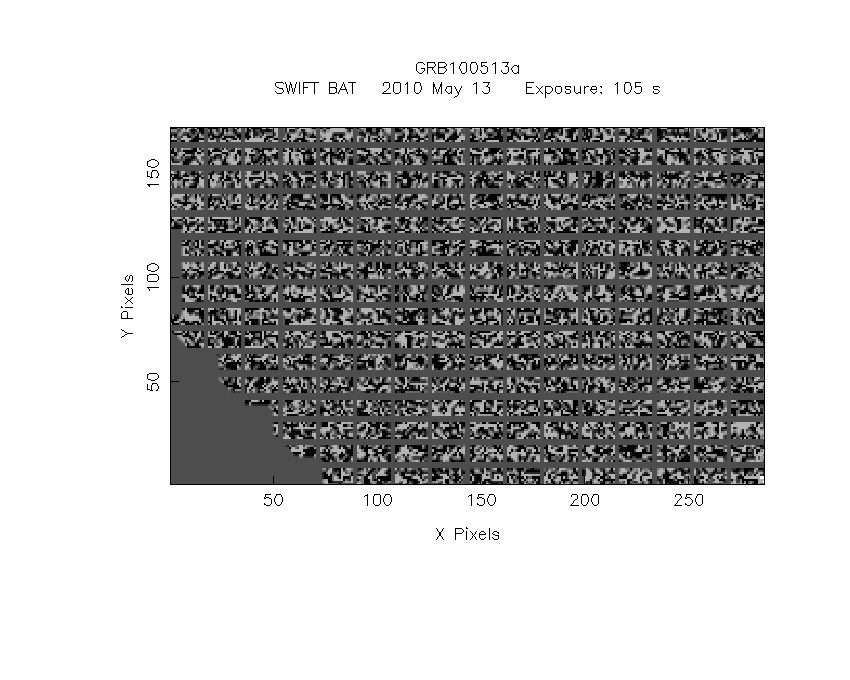
IMX = -4.425686930936857E-01, IMY = -4.523435147514752E-02
TIME vs. PHA plot around the trigger time

TIME vs. DetID plot around the trigger time
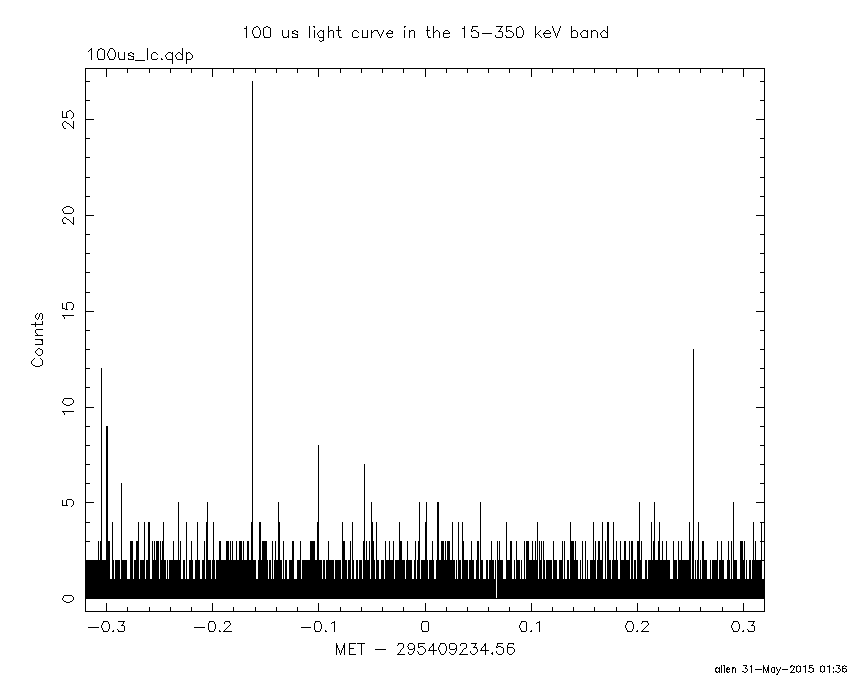
100 us light curve (15-350 keV)
Spacecraft aspect plot

Bright source in the pre-burst/pre-slew/post-slew images
Pre-burst image of 15-350 keV band
Time interval of the image:
-239.560000 -52.640000

# RAcent  DECcent POSerr Theta    Phi  PeakCts   SNR AngSep     Name
#  [deg]    [deg]    ['] [deg]  [deg]                   [']
221.8721   0.4046    2.1  40.6   66.0   3.2698   5.6 ------	UNKNOWN
147.5331 -17.2988    3.9  54.1  177.0   1.7948   3.0 ------	UNKNOWN
170.9045   5.6650    2.8  21.6  175.2   0.6131   4.1 ------	UNKNOWN
155.0813  -1.9877    2.6  38.4 -174.0   0.9323   4.5 ------	UNKNOWN
164.7606  48.9224    3.1  32.4  -77.0   1.0448   3.7 ------	UNKNOWN
175.1054  66.8567    3.0  46.0  -56.4   2.7832   3.9 ------	UNKNOWN
Pre-slew background subtracted image of 15-350 keV band
Time interval of the image:
-52.640000 52.344000

# RAcent  DECcent POSerr Theta    Phi  PeakCts   SNR AngSep     Name
#  [deg]    [deg]    ['] [deg]  [deg]                   [']
175.0736 -15.5548    2.2  38.5  147.0   1.2251   5.3 ------	UNKNOWN
169.6002   3.6105    0.6  24.0  174.2   2.5081  18.6 ------	UNKNOWN
193.1372  51.0997    2.4  30.2  -41.7   0.7352   4.8 ------	UNKNOWN
Post-slew image of 15-350 keV band
Time interval of the image:
110.340600 962.483800

# RAcent  DECcent POSerr Theta    Phi  PeakCts   SNR AngSep     Name
#  [deg]    [deg]    ['] [deg]  [deg]                   [']
135.5288 -40.5540  182.6  54.0 -170.7   0.1095   0.1    0.0	Vela X-1
214.7585  17.1113    2.7  46.3   47.3  10.6284   4.4 ------	UNKNOWN
206.0027  24.7255    2.6  40.9   33.0   4.1242   4.5 ------	UNKNOWN
146.4213 -46.4508    4.3  54.1  177.1   6.0632   2.7 ------	UNKNOWN
Plot creation:
Sun May 31 01:36:18 EDT 2015